1. Day 10 Proportional Relationship.notebook November 21, 2012
AIM: Proportional Relationships Day 2
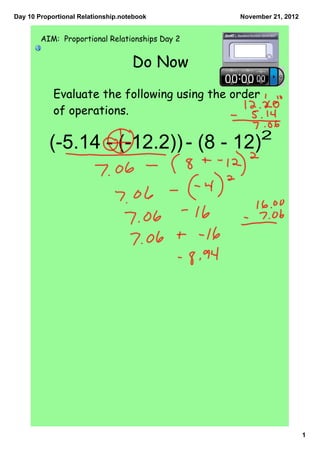
Do Now
Evaluate the following using the order
of operations.
2
(5.14 (12.2)) (8 12)
1
3. Day 10 Proportional Relationship.notebook November 21, 2012
1.) Most showerheads that were manufactured before
1994 use 5 gallons of water per minute. Based on the
table below, is the relationship between the number of
gallons of water and the number of minutes a
proportional relationship? Explain your answer.
Time
1 2 3 7 10
(min)
Water
5 10 15 35 50
Used (gal)
y
50
45
40
35
30
25
20
15
10
5
x
0 1 2 3 4 5 6 7 8 9 10
3
4. Day 10 Proportional Relationship.notebook November 21, 2012
2.) What is the constant of proportionality?
3.) If another showerhead uses less water per
minute, how would its graph compare to the
one you plotted?
4
5. Day 10 Proportional Relationship.notebook November 21, 2012
y
50
45
40
35
30
25
20
15
10
5
x
0 1 2 3 4 5 6 7 8 9 10
Low flow showerheads can reduce water consumption by 50
to 70 percent. Graph the table below that contains data for a
low flow showerhead.
Time (min) 1 2 3 7 10
Water Used
1.5 3 4.5 10.5 15
(gal)
5
8. Day 10 Proportional Relationship.notebook November 21, 2012
Example: The Jakobshavn Isbrae glacier in Greenland
moves an average of 25 meters a day. Create a table and
a graph using this rate. Is the relationship between the
movement and the days proportional? If so, what is the
constant of proportionality?
Time
(days)
Distance
(meters)
y
250
240
230
220
210
200
190
180
170
160
150
140
130
120
110
100
90
80
70
60
50
40
30
20
10 x
0 1 2 3 4 5
8
10. Day 10 Proportional Relationship.notebook November 21, 2012
SMART Document Camera
Before You Leave
Create a graph that shows a proportional relationship and one that doesn’t.
10