SlideShare uma empresa Scribd logo
1 de 21
How do geographers look at the world?
How do geographers map the world around them?
Cartography is the science of creating maps.
“Carto” means paper and “graphy” means
writing. The science and practice of map
making is paper-writing.
The first maps were created thousands of
years ago and have since become elaborate
technological wonders.
 Geographers use maps to display more than just
locations and shapes.
 Maps can display social data such as whether a
carbonated product is either “soda” or “pop.”
 Type into Google a search for “soda vs. pop” and
view the results.
 This leads us to the genres and types of maps…
There are two major genres of maps
• Reference
 Used to identify locations and places and their geographical
features
 Example: Topographic maps, road maps, regional maps
• Thematic
 Used to show space, patterns, distribution, movement, and
relative location
 Example: Map showing elk migrations across Canada, map
identifying income levels, soda vs. pop
• Right now you have a map in your mind of
how to get to the nearest shopping mall, or
how to get to your friend’s house, or how to
get to school. These maps are called mental
maps.
• These places (malls, houses, schools) are
activity spaces. Activity spaces are places we
perform our day to day activities.
• The skill of reading a map is not something we are
born with.
• You must understand the characteristics of most
maps:
– Title (Name for the map)
– Key/Legend (Explanatory table of symbols)
– Orientation/Compass (Identifies cardinal directions)
– Scale (the unit and size of measurement on the map)
– Credited sources (source of data)
– Purpose (why is the map important?)
Scale is an important part of any map. Scale
dictates how much detail should be placed on
a small piece of paper.
There are three different types of scales
• Graphical scale-
• Fractional scale (representative fraction) ex. 1:10,000
• Verbal scale- “One inch equals 1,000 miles”
Locating Places on Earth
Latitude lines run east to west but measure distances north and south of the
Equator (0°). Also called parallels.
The Equator splits the Earth into the northern and southern hemispheres.
Equator
Places located north of the Equator have a north latitude(N) address.
Places located south of the Equator have a south latitude(S) address.
Longitude lines run north to south but measure distances west to east
of the Prime Meridian (0°). Also called meridians.
The Prime Meridian and the 180° line split the Earth into eastern and
western hemispheres.
Prime Meridian (0°)
Places located east of the Prime Meridian have an east longitude (E) address.
Places located west of the Prime Meridian have a west longitude (W) address.
Prime Meridian
Equator
Longitude
Latitude
Northern Hemisphere
Southern Hemisphere
Equator
Western Hemisphere Eastern Hemisphere
Prime Meridian
 Coordinates provide the absolute location of a specific
reference point.
 Coordinates are written with latitude first then longitude.
 Coordinates are labeled based on a point’s location in the
N, S, E, or W hemispheres.
 The grid of latitude and longitude is broken down into
degrees°, minutes’, and seconds’’.
 There are many ways to present coordinates:
• Degrees, minutes, and seconds 65° 24' 12.1674", 8° 10' 26.508"
• Degrees and decimal minutes 65 24.2028, 8 10.4418
• Decimal degrees 65.40338, 8.17403
Prime Meridian
Equator
Longitude
Latitude
New York City Coordinates:
41°8′44″N 73°59′42″W
Beijing Coordinates:
39.9100° N 116.4000° E
Sydney Coordinates:
-33.86148, 151.20548
At this time pause this lesson and
return to the Moodle and
complete the Coordinate
Assignment
Return to the lesson when
completed
 Longitude is an important tool used to calculate
time because the Earth (a sphere) is broken into
360° of longitude.
 We let every 15° of longitude equal one time
zone and we end up with 24 time zones, or, one
for each hour of an Earth day.
 An international committee declared Greenwich,
England as the master reference time for all of
Earth. This is called Greenwich Mean Time (GMT)
or Coordinated Universal Time (UTC).
 When you cross the International Date Line
(follows 180° longitude for the most part) you
either go back one day (moving eastward) or
forward one day (moving westward).
 This means it can be 10am on Tuesday in
Honolulu, Hawaii while at the same time it is 6am
on Wednesday in Sydney, Australia.
 Some countries have elected to move either east
or west of the date line. See the following map:
International
Date Line
Greenwich
Mean Time
(GMT or UTC)
• Cartography is the science of making maps
• There are two genres of maps: reference and thematic
• Mental maps are parts of the world you memorize to live in
your activity spaces
• Most maps have six essential characteristics
• Most maps use a coordinate grid system of latitude and
longitude (N, S, E, W hemispheres)
• The Earth is divided into 24 time zones around the Prime
Meridian (Greenwich Mean Time) and the 180° longitude
(International Date Line).
 Cartography
 Reference Maps
 Thematic Maps
 Mental Maps
 Activity Spaces
 Characteristics of Maps
 Latitude
 Parallels
 Equator
 Hemispheres
 Longitude
 Meridians
 Prime Meridian
 Coordinates
 Time Zones
 Greenwich Mean Time (UTC)
 International Date Line
Maps:
Image: Public Domain-
http://commons.wikimedia.org/wiki/File:1794_Samuel_Dunn_Wall_Map_of_the_World_in_Hemispheres_
-_Geographicus_-_World2-dunn-1794.jpg
Scale:
Image: Public Domain- http://commons.wikimedia.org/wiki/File:Map_scale_-_8km,_5mi.png
Latitude and Longitude:
Image: Public Domain- http://commons.wikimedia.org/wiki/File:Globe_Atlantic.svg
Latitude:
Image: Public Domain- http://commons.wikimedia.org/wiki/File:Latitude_lines.svg
Longitude:
Image: Public Domain- http://commons.wikimedia.org/wiki/File:Longitude_(PSF).png
Globe:
Image: Public Domain- http://commons.wikimedia.org/wiki/File:CIA_Political_World_Map_2002.jpg
Hemispheres:
Image: Public Domain- http://commons.wikimedia.org/wiki/File:CIA_Political_World_Map_2002.jpg
Hemispheres 2:
Image: Public Domain- http://commons.wikimedia.org/wiki/File:CIA_Political_World_Map_2002.jpg
Application:
Image: Public Domain- http://commons.wikimedia.org/wiki/File:CIA_Political_World_Map_2002.jpg
Telling Time Continued:
Image- Public Domain: http://commons.wikimedia.org/wiki/File:Standard_time_zones_of_the_world.png

Mais conteúdo relacionado

Mais procurados

Mais procurados (20)

History of cartography
History of cartographyHistory of cartography
History of cartography
 
GIS Map Projection
GIS Map ProjectionGIS Map Projection
GIS Map Projection
 
Map projections
Map projectionsMap projections
Map projections
 
Map Projections ―concepts, classes and usage
Map Projections ―concepts, classes and usage Map Projections ―concepts, classes and usage
Map Projections ―concepts, classes and usage
 
Introduction to remote sensing pt 1
Introduction to remote sensing pt 1Introduction to remote sensing pt 1
Introduction to remote sensing pt 1
 
UTM UNIVERSAL TRANSVERSE MERCATOR
UTM UNIVERSAL TRANSVERSE MERCATORUTM UNIVERSAL TRANSVERSE MERCATOR
UTM UNIVERSAL TRANSVERSE MERCATOR
 
2019 tg lithosphere4 landforms
2019 tg lithosphere4 landforms2019 tg lithosphere4 landforms
2019 tg lithosphere4 landforms
 
Digital Cartography
Digital CartographyDigital Cartography
Digital Cartography
 
Geographic coordinate system & map projection
Geographic coordinate system & map projectionGeographic coordinate system & map projection
Geographic coordinate system & map projection
 
Gis functions
Gis functionsGis functions
Gis functions
 
datum
datumdatum
datum
 
Gis Geographical Information System Fundamentals
Gis Geographical Information System FundamentalsGis Geographical Information System Fundamentals
Gis Geographical Information System Fundamentals
 
Map projection
Map projectionMap projection
Map projection
 
DTM
DTMDTM
DTM
 
Geodetic systems (earth, ellipsoid)
Geodetic systems (earth, ellipsoid)Geodetic systems (earth, ellipsoid)
Geodetic systems (earth, ellipsoid)
 
Coordinate systems, datum & map projections
Coordinate systems, datum & map projectionsCoordinate systems, datum & map projections
Coordinate systems, datum & map projections
 
Gis georeference
Gis georeferenceGis georeference
Gis georeference
 
Map Projection
Map ProjectionMap Projection
Map Projection
 
Introduction to MAPS,Coordinate System and Projection System
Introduction to MAPS,Coordinate System and Projection SystemIntroduction to MAPS,Coordinate System and Projection System
Introduction to MAPS,Coordinate System and Projection System
 
Map projection
Map projectionMap projection
Map projection
 

Semelhante a Cartography

Latitudes and longitudes and india size and location
Latitudes and longitudes and india   size and locationLatitudes and longitudes and india   size and location
Latitudes and longitudes and india size and locationRajesh Kumar
 
Unit 5 Orientation and Maps
Unit 5 Orientation and MapsUnit 5 Orientation and Maps
Unit 5 Orientation and MapsYourTeachers
 
Geography_Map Skills .pptx
 Geography_Map Skills .pptx Geography_Map Skills .pptx
Geography_Map Skills .pptxNataliaBurgess
 
Intro to world geography skills
Intro to world geography skillsIntro to world geography skills
Intro to world geography skillskarrinem
 
BASIC GEOGRAPHY 2011.ppt
BASIC GEOGRAPHY 2011.pptBASIC GEOGRAPHY 2011.ppt
BASIC GEOGRAPHY 2011.pptSatyavratDhull2
 
BASIC GEOGRAPHY 2011.ppt
BASIC GEOGRAPHY 2011.pptBASIC GEOGRAPHY 2011.ppt
BASIC GEOGRAPHY 2011.pptkirthick06K
 
Map and Geography .pdf
Map and Geography  .pdfMap and Geography  .pdf
Map and Geography .pdfshucaybcabdi
 
Types of maps, long, lat, satellites, time zones
Types of maps, long, lat, satellites, time zonesTypes of maps, long, lat, satellites, time zones
Types of maps, long, lat, satellites, time zonesBantay's Earth Science!
 
Geography skills handbook1
Geography skills handbook1Geography skills handbook1
Geography skills handbook1kjanchild
 
GIS_lec 2_Different_Spatial coordinate system.ppt
GIS_lec 2_Different_Spatial coordinate system.pptGIS_lec 2_Different_Spatial coordinate system.ppt
GIS_lec 2_Different_Spatial coordinate system.pptMahinMobarrat
 
Lab two location and time
Lab two location and timeLab two location and time
Lab two location and timelschmidt1170
 

Semelhante a Cartography (20)

Readingmaps
ReadingmapsReadingmaps
Readingmaps
 
Latitudes and longitudes and india size and location
Latitudes and longitudes and india   size and locationLatitudes and longitudes and india   size and location
Latitudes and longitudes and india size and location
 
Unit 5 Orientation and Maps
Unit 5 Orientation and MapsUnit 5 Orientation and Maps
Unit 5 Orientation and Maps
 
2.0MapsGlobes.pptx
2.0MapsGlobes.pptx2.0MapsGlobes.pptx
2.0MapsGlobes.pptx
 
Geography_Map Skills .pptx
 Geography_Map Skills .pptx Geography_Map Skills .pptx
Geography_Map Skills .pptx
 
Intro to world geography skills
Intro to world geography skillsIntro to world geography skills
Intro to world geography skills
 
BASIC GEOGRAPHY 2011.ppt
BASIC GEOGRAPHY 2011.pptBASIC GEOGRAPHY 2011.ppt
BASIC GEOGRAPHY 2011.ppt
 
BASIC GEOGRAPHY 2011.ppt
BASIC GEOGRAPHY 2011.pptBASIC GEOGRAPHY 2011.ppt
BASIC GEOGRAPHY 2011.ppt
 
Map and Geography .pdf
Map and Geography  .pdfMap and Geography  .pdf
Map and Geography .pdf
 
Types of maps, long, lat, satellites, time zones
Types of maps, long, lat, satellites, time zonesTypes of maps, long, lat, satellites, time zones
Types of maps, long, lat, satellites, time zones
 
Geography skills handbook1
Geography skills handbook1Geography skills handbook1
Geography skills handbook1
 
Unit 1 Maps
Unit 1 MapsUnit 1 Maps
Unit 1 Maps
 
Readingmaps 1
Readingmaps 1Readingmaps 1
Readingmaps 1
 
GIS_lec 2_Different_Spatial coordinate system.ppt
GIS_lec 2_Different_Spatial coordinate system.pptGIS_lec 2_Different_Spatial coordinate system.ppt
GIS_lec 2_Different_Spatial coordinate system.ppt
 
Location and time
Location and timeLocation and time
Location and time
 
Map Skills
Map SkillsMap Skills
Map Skills
 
Geography Handbook
Geography HandbookGeography Handbook
Geography Handbook
 
Location and time
Location and timeLocation and time
Location and time
 
Lab two location and time
Lab two location and timeLab two location and time
Lab two location and time
 
Orienteering
Orienteering Orienteering
Orienteering
 

Mais de Ulster BOCES

Sampling distributions
Sampling distributionsSampling distributions
Sampling distributionsUlster BOCES
 
Geometric distributions
Geometric distributionsGeometric distributions
Geometric distributionsUlster BOCES
 
Binomial distributions
Binomial distributionsBinomial distributions
Binomial distributionsUlster BOCES
 
Means and variances of random variables
Means and variances of random variablesMeans and variances of random variables
Means and variances of random variablesUlster BOCES
 
General probability rules
General probability rulesGeneral probability rules
General probability rulesUlster BOCES
 
Planning and conducting surveys
Planning and conducting surveysPlanning and conducting surveys
Planning and conducting surveysUlster BOCES
 
Overview of data collection methods
Overview of data collection methodsOverview of data collection methods
Overview of data collection methodsUlster BOCES
 
Exploring bivariate data
Exploring bivariate dataExploring bivariate data
Exploring bivariate dataUlster BOCES
 
Normal probability plot
Normal probability plotNormal probability plot
Normal probability plotUlster BOCES
 
Exploring data stemplot
Exploring data   stemplotExploring data   stemplot
Exploring data stemplotUlster BOCES
 
Exploring data other plots
Exploring data   other plotsExploring data   other plots
Exploring data other plotsUlster BOCES
 
Exploring data histograms
Exploring data   histogramsExploring data   histograms
Exploring data histogramsUlster BOCES
 
Calculating percentages from z scores
Calculating percentages from z scoresCalculating percentages from z scores
Calculating percentages from z scoresUlster BOCES
 
Standardizing scores
Standardizing scoresStandardizing scores
Standardizing scoresUlster BOCES
 
Intro to statistics
Intro to statisticsIntro to statistics
Intro to statisticsUlster BOCES
 
Describing quantitative data with numbers
Describing quantitative data with numbersDescribing quantitative data with numbers
Describing quantitative data with numbersUlster BOCES
 
Displaying quantitative data
Displaying quantitative dataDisplaying quantitative data
Displaying quantitative dataUlster BOCES
 

Mais de Ulster BOCES (20)

Sampling means
Sampling meansSampling means
Sampling means
 
Sampling distributions
Sampling distributionsSampling distributions
Sampling distributions
 
Geometric distributions
Geometric distributionsGeometric distributions
Geometric distributions
 
Binomial distributions
Binomial distributionsBinomial distributions
Binomial distributions
 
Means and variances of random variables
Means and variances of random variablesMeans and variances of random variables
Means and variances of random variables
 
Simulation
SimulationSimulation
Simulation
 
General probability rules
General probability rulesGeneral probability rules
General probability rules
 
Planning and conducting surveys
Planning and conducting surveysPlanning and conducting surveys
Planning and conducting surveys
 
Overview of data collection methods
Overview of data collection methodsOverview of data collection methods
Overview of data collection methods
 
Exploring bivariate data
Exploring bivariate dataExploring bivariate data
Exploring bivariate data
 
Normal probability plot
Normal probability plotNormal probability plot
Normal probability plot
 
Exploring data stemplot
Exploring data   stemplotExploring data   stemplot
Exploring data stemplot
 
Exploring data other plots
Exploring data   other plotsExploring data   other plots
Exploring data other plots
 
Exploring data histograms
Exploring data   histogramsExploring data   histograms
Exploring data histograms
 
Calculating percentages from z scores
Calculating percentages from z scoresCalculating percentages from z scores
Calculating percentages from z scores
 
Density curve
Density curveDensity curve
Density curve
 
Standardizing scores
Standardizing scoresStandardizing scores
Standardizing scores
 
Intro to statistics
Intro to statisticsIntro to statistics
Intro to statistics
 
Describing quantitative data with numbers
Describing quantitative data with numbersDescribing quantitative data with numbers
Describing quantitative data with numbers
 
Displaying quantitative data
Displaying quantitative dataDisplaying quantitative data
Displaying quantitative data
 

Último

Presentation by Andreas Schleicher Tackling the School Absenteeism Crisis 30 ...
Presentation by Andreas Schleicher Tackling the School Absenteeism Crisis 30 ...Presentation by Andreas Schleicher Tackling the School Absenteeism Crisis 30 ...
Presentation by Andreas Schleicher Tackling the School Absenteeism Crisis 30 ...EduSkills OECD
 
Call Girls in Dwarka Mor Delhi Contact Us 9654467111
Call Girls in Dwarka Mor Delhi Contact Us 9654467111Call Girls in Dwarka Mor Delhi Contact Us 9654467111
Call Girls in Dwarka Mor Delhi Contact Us 9654467111Sapana Sha
 
Measures of Central Tendency: Mean, Median and Mode
Measures of Central Tendency: Mean, Median and ModeMeasures of Central Tendency: Mean, Median and Mode
Measures of Central Tendency: Mean, Median and ModeThiyagu K
 
Hybridoma Technology ( Production , Purification , and Application )
Hybridoma Technology  ( Production , Purification , and Application  ) Hybridoma Technology  ( Production , Purification , and Application  )
Hybridoma Technology ( Production , Purification , and Application ) Sakshi Ghasle
 
BASLIQ CURRENT LOOKBOOK LOOKBOOK(1) (1).pdf
BASLIQ CURRENT LOOKBOOK  LOOKBOOK(1) (1).pdfBASLIQ CURRENT LOOKBOOK  LOOKBOOK(1) (1).pdf
BASLIQ CURRENT LOOKBOOK LOOKBOOK(1) (1).pdfSoniaTolstoy
 
Kisan Call Centre - To harness potential of ICT in Agriculture by answer farm...
Kisan Call Centre - To harness potential of ICT in Agriculture by answer farm...Kisan Call Centre - To harness potential of ICT in Agriculture by answer farm...
Kisan Call Centre - To harness potential of ICT in Agriculture by answer farm...Krashi Coaching
 
Web & Social Media Analytics Previous Year Question Paper.pdf
Web & Social Media Analytics Previous Year Question Paper.pdfWeb & Social Media Analytics Previous Year Question Paper.pdf
Web & Social Media Analytics Previous Year Question Paper.pdfJayanti Pande
 
mini mental status format.docx
mini    mental       status     format.docxmini    mental       status     format.docx
mini mental status format.docxPoojaSen20
 
SOCIAL AND HISTORICAL CONTEXT - LFTVD.pptx
SOCIAL AND HISTORICAL CONTEXT - LFTVD.pptxSOCIAL AND HISTORICAL CONTEXT - LFTVD.pptx
SOCIAL AND HISTORICAL CONTEXT - LFTVD.pptxiammrhaywood
 
Employee wellbeing at the workplace.pptx
Employee wellbeing at the workplace.pptxEmployee wellbeing at the workplace.pptx
Employee wellbeing at the workplace.pptxNirmalaLoungPoorunde1
 
Interactive Powerpoint_How to Master effective communication
Interactive Powerpoint_How to Master effective communicationInteractive Powerpoint_How to Master effective communication
Interactive Powerpoint_How to Master effective communicationnomboosow
 
Q4-W6-Restating Informational Text Grade 3
Q4-W6-Restating Informational Text Grade 3Q4-W6-Restating Informational Text Grade 3
Q4-W6-Restating Informational Text Grade 3JemimahLaneBuaron
 
The Most Excellent Way | 1 Corinthians 13
The Most Excellent Way | 1 Corinthians 13The Most Excellent Way | 1 Corinthians 13
The Most Excellent Way | 1 Corinthians 13Steve Thomason
 
“Oh GOSH! Reflecting on Hackteria's Collaborative Practices in a Global Do-It...
“Oh GOSH! Reflecting on Hackteria's Collaborative Practices in a Global Do-It...“Oh GOSH! Reflecting on Hackteria's Collaborative Practices in a Global Do-It...
“Oh GOSH! Reflecting on Hackteria's Collaborative Practices in a Global Do-It...Marc Dusseiller Dusjagr
 
Contemporary philippine arts from the regions_PPT_Module_12 [Autosaved] (1).pptx
Contemporary philippine arts from the regions_PPT_Module_12 [Autosaved] (1).pptxContemporary philippine arts from the regions_PPT_Module_12 [Autosaved] (1).pptx
Contemporary philippine arts from the regions_PPT_Module_12 [Autosaved] (1).pptxRoyAbrique
 
Accessible design: Minimum effort, maximum impact
Accessible design: Minimum effort, maximum impactAccessible design: Minimum effort, maximum impact
Accessible design: Minimum effort, maximum impactdawncurless
 

Último (20)

INDIA QUIZ 2024 RLAC DELHI UNIVERSITY.pptx
INDIA QUIZ 2024 RLAC DELHI UNIVERSITY.pptxINDIA QUIZ 2024 RLAC DELHI UNIVERSITY.pptx
INDIA QUIZ 2024 RLAC DELHI UNIVERSITY.pptx
 
Mattingly "AI & Prompt Design: Structured Data, Assistants, & RAG"
Mattingly "AI & Prompt Design: Structured Data, Assistants, & RAG"Mattingly "AI & Prompt Design: Structured Data, Assistants, & RAG"
Mattingly "AI & Prompt Design: Structured Data, Assistants, & RAG"
 
Presentation by Andreas Schleicher Tackling the School Absenteeism Crisis 30 ...
Presentation by Andreas Schleicher Tackling the School Absenteeism Crisis 30 ...Presentation by Andreas Schleicher Tackling the School Absenteeism Crisis 30 ...
Presentation by Andreas Schleicher Tackling the School Absenteeism Crisis 30 ...
 
Call Girls in Dwarka Mor Delhi Contact Us 9654467111
Call Girls in Dwarka Mor Delhi Contact Us 9654467111Call Girls in Dwarka Mor Delhi Contact Us 9654467111
Call Girls in Dwarka Mor Delhi Contact Us 9654467111
 
Measures of Central Tendency: Mean, Median and Mode
Measures of Central Tendency: Mean, Median and ModeMeasures of Central Tendency: Mean, Median and Mode
Measures of Central Tendency: Mean, Median and Mode
 
Hybridoma Technology ( Production , Purification , and Application )
Hybridoma Technology  ( Production , Purification , and Application  ) Hybridoma Technology  ( Production , Purification , and Application  )
Hybridoma Technology ( Production , Purification , and Application )
 
BASLIQ CURRENT LOOKBOOK LOOKBOOK(1) (1).pdf
BASLIQ CURRENT LOOKBOOK  LOOKBOOK(1) (1).pdfBASLIQ CURRENT LOOKBOOK  LOOKBOOK(1) (1).pdf
BASLIQ CURRENT LOOKBOOK LOOKBOOK(1) (1).pdf
 
Kisan Call Centre - To harness potential of ICT in Agriculture by answer farm...
Kisan Call Centre - To harness potential of ICT in Agriculture by answer farm...Kisan Call Centre - To harness potential of ICT in Agriculture by answer farm...
Kisan Call Centre - To harness potential of ICT in Agriculture by answer farm...
 
Mattingly "AI & Prompt Design: The Basics of Prompt Design"
Mattingly "AI & Prompt Design: The Basics of Prompt Design"Mattingly "AI & Prompt Design: The Basics of Prompt Design"
Mattingly "AI & Prompt Design: The Basics of Prompt Design"
 
Web & Social Media Analytics Previous Year Question Paper.pdf
Web & Social Media Analytics Previous Year Question Paper.pdfWeb & Social Media Analytics Previous Year Question Paper.pdf
Web & Social Media Analytics Previous Year Question Paper.pdf
 
mini mental status format.docx
mini    mental       status     format.docxmini    mental       status     format.docx
mini mental status format.docx
 
SOCIAL AND HISTORICAL CONTEXT - LFTVD.pptx
SOCIAL AND HISTORICAL CONTEXT - LFTVD.pptxSOCIAL AND HISTORICAL CONTEXT - LFTVD.pptx
SOCIAL AND HISTORICAL CONTEXT - LFTVD.pptx
 
Employee wellbeing at the workplace.pptx
Employee wellbeing at the workplace.pptxEmployee wellbeing at the workplace.pptx
Employee wellbeing at the workplace.pptx
 
Interactive Powerpoint_How to Master effective communication
Interactive Powerpoint_How to Master effective communicationInteractive Powerpoint_How to Master effective communication
Interactive Powerpoint_How to Master effective communication
 
Q4-W6-Restating Informational Text Grade 3
Q4-W6-Restating Informational Text Grade 3Q4-W6-Restating Informational Text Grade 3
Q4-W6-Restating Informational Text Grade 3
 
The Most Excellent Way | 1 Corinthians 13
The Most Excellent Way | 1 Corinthians 13The Most Excellent Way | 1 Corinthians 13
The Most Excellent Way | 1 Corinthians 13
 
“Oh GOSH! Reflecting on Hackteria's Collaborative Practices in a Global Do-It...
“Oh GOSH! Reflecting on Hackteria's Collaborative Practices in a Global Do-It...“Oh GOSH! Reflecting on Hackteria's Collaborative Practices in a Global Do-It...
“Oh GOSH! Reflecting on Hackteria's Collaborative Practices in a Global Do-It...
 
Contemporary philippine arts from the regions_PPT_Module_12 [Autosaved] (1).pptx
Contemporary philippine arts from the regions_PPT_Module_12 [Autosaved] (1).pptxContemporary philippine arts from the regions_PPT_Module_12 [Autosaved] (1).pptx
Contemporary philippine arts from the regions_PPT_Module_12 [Autosaved] (1).pptx
 
Accessible design: Minimum effort, maximum impact
Accessible design: Minimum effort, maximum impactAccessible design: Minimum effort, maximum impact
Accessible design: Minimum effort, maximum impact
 
TataKelola dan KamSiber Kecerdasan Buatan v022.pdf
TataKelola dan KamSiber Kecerdasan Buatan v022.pdfTataKelola dan KamSiber Kecerdasan Buatan v022.pdf
TataKelola dan KamSiber Kecerdasan Buatan v022.pdf
 

Cartography

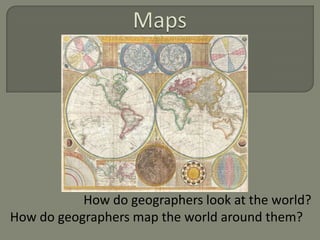
  • 1. How do geographers look at the world? How do geographers map the world around them?
  • 2. Cartography is the science of creating maps. “Carto” means paper and “graphy” means writing. The science and practice of map making is paper-writing. The first maps were created thousands of years ago and have since become elaborate technological wonders.
  • 3.  Geographers use maps to display more than just locations and shapes.  Maps can display social data such as whether a carbonated product is either “soda” or “pop.”  Type into Google a search for “soda vs. pop” and view the results.  This leads us to the genres and types of maps…
  • 4. There are two major genres of maps • Reference  Used to identify locations and places and their geographical features  Example: Topographic maps, road maps, regional maps • Thematic  Used to show space, patterns, distribution, movement, and relative location  Example: Map showing elk migrations across Canada, map identifying income levels, soda vs. pop
  • 5. • Right now you have a map in your mind of how to get to the nearest shopping mall, or how to get to your friend’s house, or how to get to school. These maps are called mental maps. • These places (malls, houses, schools) are activity spaces. Activity spaces are places we perform our day to day activities.
  • 6. • The skill of reading a map is not something we are born with. • You must understand the characteristics of most maps: – Title (Name for the map) – Key/Legend (Explanatory table of symbols) – Orientation/Compass (Identifies cardinal directions) – Scale (the unit and size of measurement on the map) – Credited sources (source of data) – Purpose (why is the map important?)
  • 7. Scale is an important part of any map. Scale dictates how much detail should be placed on a small piece of paper. There are three different types of scales • Graphical scale- • Fractional scale (representative fraction) ex. 1:10,000 • Verbal scale- “One inch equals 1,000 miles”
  • 9. Latitude lines run east to west but measure distances north and south of the Equator (0°). Also called parallels. The Equator splits the Earth into the northern and southern hemispheres. Equator Places located north of the Equator have a north latitude(N) address. Places located south of the Equator have a south latitude(S) address.
  • 10. Longitude lines run north to south but measure distances west to east of the Prime Meridian (0°). Also called meridians. The Prime Meridian and the 180° line split the Earth into eastern and western hemispheres. Prime Meridian (0°) Places located east of the Prime Meridian have an east longitude (E) address. Places located west of the Prime Meridian have a west longitude (W) address.
  • 13. Western Hemisphere Eastern Hemisphere Prime Meridian
  • 14.  Coordinates provide the absolute location of a specific reference point.  Coordinates are written with latitude first then longitude.  Coordinates are labeled based on a point’s location in the N, S, E, or W hemispheres.  The grid of latitude and longitude is broken down into degrees°, minutes’, and seconds’’.  There are many ways to present coordinates: • Degrees, minutes, and seconds 65° 24' 12.1674", 8° 10' 26.508" • Degrees and decimal minutes 65 24.2028, 8 10.4418 • Decimal degrees 65.40338, 8.17403
  • 15. Prime Meridian Equator Longitude Latitude New York City Coordinates: 41°8′44″N 73°59′42″W Beijing Coordinates: 39.9100° N 116.4000° E Sydney Coordinates: -33.86148, 151.20548
  • 16. At this time pause this lesson and return to the Moodle and complete the Coordinate Assignment Return to the lesson when completed
  • 17.  Longitude is an important tool used to calculate time because the Earth (a sphere) is broken into 360° of longitude.  We let every 15° of longitude equal one time zone and we end up with 24 time zones, or, one for each hour of an Earth day.  An international committee declared Greenwich, England as the master reference time for all of Earth. This is called Greenwich Mean Time (GMT) or Coordinated Universal Time (UTC).
  • 18.  When you cross the International Date Line (follows 180° longitude for the most part) you either go back one day (moving eastward) or forward one day (moving westward).  This means it can be 10am on Tuesday in Honolulu, Hawaii while at the same time it is 6am on Wednesday in Sydney, Australia.  Some countries have elected to move either east or west of the date line. See the following map: International Date Line Greenwich Mean Time (GMT or UTC)
  • 19. • Cartography is the science of making maps • There are two genres of maps: reference and thematic • Mental maps are parts of the world you memorize to live in your activity spaces • Most maps have six essential characteristics • Most maps use a coordinate grid system of latitude and longitude (N, S, E, W hemispheres) • The Earth is divided into 24 time zones around the Prime Meridian (Greenwich Mean Time) and the 180° longitude (International Date Line).
  • 20.  Cartography  Reference Maps  Thematic Maps  Mental Maps  Activity Spaces  Characteristics of Maps  Latitude  Parallels  Equator  Hemispheres  Longitude  Meridians  Prime Meridian  Coordinates  Time Zones  Greenwich Mean Time (UTC)  International Date Line
  • 21. Maps: Image: Public Domain- http://commons.wikimedia.org/wiki/File:1794_Samuel_Dunn_Wall_Map_of_the_World_in_Hemispheres_ -_Geographicus_-_World2-dunn-1794.jpg Scale: Image: Public Domain- http://commons.wikimedia.org/wiki/File:Map_scale_-_8km,_5mi.png Latitude and Longitude: Image: Public Domain- http://commons.wikimedia.org/wiki/File:Globe_Atlantic.svg Latitude: Image: Public Domain- http://commons.wikimedia.org/wiki/File:Latitude_lines.svg Longitude: Image: Public Domain- http://commons.wikimedia.org/wiki/File:Longitude_(PSF).png Globe: Image: Public Domain- http://commons.wikimedia.org/wiki/File:CIA_Political_World_Map_2002.jpg Hemispheres: Image: Public Domain- http://commons.wikimedia.org/wiki/File:CIA_Political_World_Map_2002.jpg Hemispheres 2: Image: Public Domain- http://commons.wikimedia.org/wiki/File:CIA_Political_World_Map_2002.jpg Application: Image: Public Domain- http://commons.wikimedia.org/wiki/File:CIA_Political_World_Map_2002.jpg Telling Time Continued: Image- Public Domain: http://commons.wikimedia.org/wiki/File:Standard_time_zones_of_the_world.png

Notas do Editor

  1. Image: Public Domain- http://commons.wikimedia.org/wiki/File:1794_Samuel_Dunn_Wall_Map_of_the_World_in_Hemispheres_-_Geographicus_-_World2-dunn-1794.jpg
  2. Graphical scale- Public Domain: http://commons.wikimedia.org/wiki/File:Map_scale_-_8km,_5mi.png
  3. Image: Public Domain- http://commons.wikimedia.org/wiki/File:Globe_Atlantic.svg
  4. Image: Public Domain- http://commons.wikimedia.org/wiki/File:Latitude_lines.svg
  5. Image: Public Domain- http://commons.wikimedia.org/wiki/File:Longitude_(PSF).png
  6. Image: Public Domain- http://commons.wikimedia.org/wiki/File:CIA_Political_World_Map_2002.jpg
  7. Image: Public Domain- http://commons.wikimedia.org/wiki/File:CIA_Political_World_Map_2002.jpg
  8. Image: Public Domain- http://commons.wikimedia.org/wiki/File:CIA_Political_World_Map_2002.jpg
  9. Image: Public Domain- http://commons.wikimedia.org/wiki/File:CIA_Political_World_Map_2002.jpg
  10. Image- Public Domain: http://commons.wikimedia.org/wiki/File:Standard_time_zones_of_the_world.png