
Recomendados
Recomendados
Mais conteúdo relacionado
Mais procurados
Mais procurados (20)
Destaque
Semelhante a Corrosive microenvironments at lead solder surfaces arising from galvanic corrosion
Semelhante a Corrosive microenvironments at lead solder surfaces arising from galvanic corrosion (20)
Último
Último (20)
Corrosive microenvironments at lead solder surfaces arising from galvanic corrosion
- 1. Environ. Sci. Technol. 2010, 44, 7076–7081 which is consistent with observations of Reiber et al. in Corrosive Microenvironments at continuous flow testing of waters to which sulfate was added Lead Solder Surfaces Arising from (11, 12). Later practical data demonstrated very strong links between the reported 90th percentile lead at certain utilities Galvanic Corrosion with Copper Pipe and the CSMR (13), as well as elevated CSMR due to changing coagulant chemical from aluminum sulfate to either ferric chloride or polyaluminum chloride (2). Increased leaching CAROLINE K. NGUYEN, and galvanic corrosion of lead solder at higher CSMR has KENDALL R. STONE, ABHIJEET DUDI, also been unambiguously demonstrated at bench scale by AND MARC A. EDWARDS* Dudi et al. (14) and Edwards et al. (2). Practical case studies Civil and Environmental Engineering Department, Virginia by Nguyen et al. found a correlation between the CSMR and Tech, 407 Durham Hall, Blacksburg, Virginia 24061 lead release from galvanic solder in a range of waters (15). Although the practical link between higher CSMR and Received May 4, 2010. Revised manuscript received August higher lead leaching from solder is now well established in 9, 2010. Accepted August 11, 2010. the literature, the precise mechanism(s) for the sustained attack due to chloride have never been elucidated. The goal of this work was to unambiguously identify the key steps by which galvanic corrosion currents can cause persistent As stagnant water contacts copper pipe and lead solder dissolution of lead bearing materials connected to copper (simulated soldered joints), a corrosion cell is formed between pipe. Conceptually, when lead is physically connected to the metals in solder (Pb, Sn) and the copper. If the resulting copper, the lead surface is anodic and the rate of lead galvanic current exceeds about 2 µA/cm2, a highly corrosive corrosion is accelerated. The free lead (Pb2+) released to the microenvironment can form at the solder surface, with pH < 2.5 water is a Lewis acid, which decreases pH upon removal of and chloride concentrations at least 11 times higher than OH- ions from the water via formation of soluble complexes bulk water levels. Waters with relatively high chloride tend to or insoluble precipitates that contain OH- (14). Specifically, sustain high galvanic currents, preventing passivation of the release of 50 mg/L Pb(II) can reduce the pH from 8 to 5.8 in solder surface, and contributing to lead contamination of potable water with 20 mg/L alkalinity as CaCO3. However, if the same mass of tin, which is a stronger Lewis acid than lead, were water supplies. The total mass of lead corroded was consistent released from 50:50 (by weight) Pb/Sn solder, the pH is with predictions based on the galvanic current, and lead predicted to decrease to 2.9-3.5. A higher alkalinity might leaching to water was correlated with galvanic current. If the tend to buffer the pH drop (14). Because the resulting low concentration of sulfate in the water increased relative to pH can hinder formation of passive films on the lead solder chloride, galvanic currents and associated lead contamination surfaces, it could contribute to self-perpetuation of the attack could be greatly reduced, and solder surfaces were readily and associated water contamination. passivated. Another factor affecting corrosion is the migration of anions such as chloride or sulfate to the lead anode surface, which is necessary to balance electroneutrality of the released Introduction Pb2+ or Sn2+. The increased concentration of anions at anode Seemingly innocuous changes in chemistry can sometimes surfaces versus the concentration in bulk water is well dramatically increase the likelihood of lead contamination understood, and has even been considered as a means of from lead pipes, soldered joints, and lead-bearing brass (1-5). removing anionic contaminants from soils via electromi- In some cases, the changes have resulted in exceedances of gration (16, 17). The net concentration of anions at anode lead levels specified in the United States Environmental surfaces can be predicted using a one-dimensional model Protection Agency (U.S. EPA) Lead and Copper Rule (LCR), that accounts for anion migration and diffusion (18). Key elevated blood lead, and even lead poisoning (2, 6-8). One results of this model illustrate two extremes in behavior that important subset of influential treatment changes, as high- are relevant to the current application. Specifically, if the lighted by Edwards et al., involves dramatically increased current density exceeds about 2 µA/cm2, net anion transport lead release from lead solder:copper joints that are triggered is toward the anode (anion migration toward the anode is by increases in the chloride-to-sulfate mass ratio (CSMR ) much greater than diffusion of anions away from the anode), mg/L chloride divided by mg/L sulfate) of the water supply resulting in accumulation of Cl- or SO42- at the anode surface (2). Some of the resulting problems with elevated lead relative to bulk water (16). In other words, when this threshold occurred while utilities practiced optimized corrosion control of current density is exceeded, the anion concentration factor using orthophosphate inhibitors (2). (CF ) anion concentration near the anode surface divided The nature and importance of galvanic corrosion on by the anion concentration in the bulk water) becomes very contamination of water from lead plumbing was first detailed high. At another extreme, if the current density is very low, by Oliphant and Gregory (9, 10). These authors discovered net transport of anions toward the anode is low relative to that waters with a CSMR above about 0.6 had very high and diffusion of anions away from the anode, reducing the net persistent galvanic currents flowing between copper pipe CF of anions near the anode surface. In the experimental and lead solder. The lead solder anode, sacrificed by the data of Horng using a copper anode, sulfate was concentrated connection to the cathodic copper, was suspected to cause at the anode surface by a factor of 1.4-5 when the current severe lead contamination of potable water (9, 10). If the density increased from 10 to 25 µA/cm2 (16). CSMR of the water was lower, galvanic currents between In general, the range of chloride and sulfate concentrations lead solder and copper decreased markedly with time (9, 10), commonly encountered in potable water are not expected to influence lead solubility via formation of either soluble * Corresponding author phone: (540)231-7236; fax: (540)231-7916; complexes or lead precipitates (19). However, if these ions e-mail: edwardsm@vt.edu. were to become concentrated at the surface of the anode, 7076 9 ENVIRONMENTAL SCIENCE & TECHNOLOGY / VOL. 44, NO. 18, 2010 10.1021/es1015185 2010 American Chemical Society Published on Web 08/25/2010
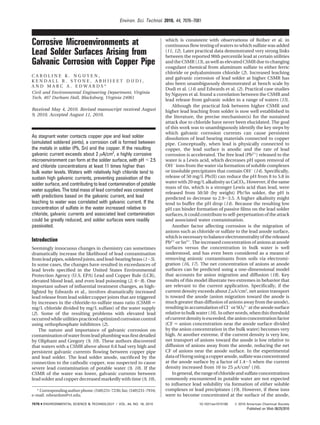
- 2. connected to the copper pipes via copper wires. The apparatus was oriented vertically so that the solder, lead, and tin wires were at the bottom. Pure lead and tin wires were also evaluated in this study to identify tendencies specific to each metal present in 50:50 Pb/Sn solder. Water Chemistry. The pipes were exposed to different water chemistries to simulate real-world problems observed in practice (Table 1). Raw water from the utility in Case Study 1 was received and treated at bench scale with the specified coagulants and disinfectants to simulate full-scale treatment (Table 1). In Case Study 2, treated water, but prior to disinfection, was received at Virginia Tech from Utility 2. Water for Case Study 3 was treated using reagent grade chemicals. The chloride and sulfate concentrations were selected to represent the range of chloride and sulfate concentrations quantified in potable water. The pH, inhibitor dose, and disinfectant concentrations were adjusted for all FIGURE 1. Schematic of copper joint macrocell used in case waters prior to exposure to the macrocells. Details of the studies. bench scale treatment for each case study are provided in the Supporting Information (SI). significant impacts on lead solubility at the anode surface Experimental Protocol. The water in the pipes was are predicted. Specifically, at high concentrations, chloride changed three times per week using a “dump-and-fill” is predicted to form soluble complexes with lead and increase protocol (2). Each water condition was tested in triplicate. its solubility, whereas sulfate can form a relatively insoluble Water left stagnant in the pipes for two to three days was precipitate with lead and decrease its solubility (20, 21). Work collected and analyzed for metals at the end of each week. by Guo with polarized lead electrodes suggested that insoluble Although the average stagnation time in buildings between metal salts, such as PbSO4 or other salts containing multi- valent anions, could passivate the scale from the active state flow events is on the order of 30 min, a longer stagnation even under highly acidic conditions (22, 23). However, in the time was selected in this study to represent that encountered presence of chloride, very rapid corrosion (metal polishing) during a typical weekend in many buildings such as schools. could occur as soluble metal chloride complexes form (23), A mass balance of lead released throughout the study which occurs for iron if chloride exceeds about 8 M (24). was determined at the end of Case Study 2 for the pure lead The experimental work that follows attempts to verify the wire apparatus. The scale of the lead wire was carefully expectations of very low pH and higher anion concentration abraded from the surface using a soft cloth. The lead wire, in the solder anode microlayer, thereby providing funda- which remained inserted in the 1.3 cm diameter stopper, mental mechanistic insights to explain practical observations was weighed before and after removal of the scale, and the of CSMR impacts on lead contamination of potable water collected scale was dissolved with 2% nitric acid and analyzed from solder. to determine the fraction of lead in the scale. The internal surface of the upper copper pipe section (1.9 cm diameter) Experimental Methods was soaked in pH 1.5 water (approximately 0.15% HNO3) for Pipe Setup. The volume of water in the microlayer contacting 16 h. Following stagnation, the water was removed from each solder in a real-world pipe joint is extremely small and the pipe, acidified to a total of 2% nitric acid, and analyzed for physical contact between the dissimilar metals prevents lead and copper. measurement of ambient galvanic currents. Therefore, a Analytical Methods. Total lead release was quantified by simulated pipe joint corrosion macrocell was designed and acidifying water samples with 2% nitric acid for at least 24 h. constructed to track changes in water chemistry that result Lead, chloride, and sulfate in the bulk water were measured from galvanic corrosion between copper pipe and lead solder using an inductively coupled plasma mass spectrometer (ICP- during stagnation events (Figure 1). This type of apparatus MS) in accordance with Standard Method 3125-B (25). was shown to semiquantitatively track observed changes in Concentrations of chloride and sulfate were cross-checked lead leaching due to real-world pipe joints (2). using DIONEX DX-120 ion chromatography according to The macrocell in this work included a 1.9 cm diameter Standard Method 4110 (25). Chloride microelectrode mea- copper pipe (31 cm long) and a 1.3 cm diameter copper pipe surements were made with an ion-selective microelectrode (6.4 cm long), connected by clear Tygon tubing with a 2-mm by Lazar for Case Studies 1 and 3. Chloride and sulfate gap separation between the pipes. A 50:50 lead:tin, pure tin, concentrations used in the calculation of the concentration or pure lead wire was inserted through the center of a silicone factors were determined from ICP analysis of “anode” and stopper, and then the stopper with wire was inserted into “cathode” water samples. “Anode” samples consisted of the the 1.3 cm diameter copper pipe. The wetted surface area of lead solder (or pure lead or pure tin wire) was 6.2 cm2 9-mL solution closest to the solder wire, and “cathode” (Case Studies 1 and 3) or 5.2 cm2 (Case Study 2). The smaller samples comprised the 10 mL solution withdrawn from diameter (1.3 cm) copper pipe could be removed to isolate the apparatus top, farthest from the solder wire (Figure 1). a volume of water near the surface of the anodic solder, The pH of the bulk water was measured before exposure suitable for measurement of Cl- or SO42-. The larger diameter to the macrocells with an Accumet electrode in accordance (1.9 cm) pipe had the dual purpose of allowing extraction of with Standard Method 4500-H+ B (25). The pH of the anode water samples from various depths within the apparatus using (within 1 mm from the solder, Pb, or Sn surface) and cathode a pipet inserted into the apparatus, and also providing a (in the bulk water in the 1.9 cm diameter copper pipe) was large copper-to-solder surface area of approximately 34:1 in measured using a flat membrane microelectrode and a Case Studies 1 and 3 and 41:1 in Case Study 2. To simulate reference electrode from Microelectrodes, Inc. Electrochemi- the galvanic connection between copper pipes and lead solder cal measurements between the copper pipes and the solder, in joints while having the ability to measure galvanic corrosion lead, or tin wires were conducted using RadioShack multi- with an ammeter, each lead or tin bearing wire was externally meters with 100 Ω resistance. VOL. 44, NO. 18, 2010 / ENVIRONMENTAL SCIENCE & TECHNOLOGY 9 7077
- 3. TABLE 1. Bulk Water Chemistry of Test Waters SO42-, alkalinity, (case study no.) water type Cl-, mg/L Cl mg/L SO4 CSMRa mg/L as CaCO3 pH inhibitor (dose) disinfectant, mg/L as Cl2 (1) alum-treated 27 21 1.4 25 7.7 orthophosphate various - free chlorine or (1) PACl-treatedb 32 6 5.3 25 7.7 (1 mg/L P) chloramines (3.5 mg/L) b (1) PACl-treated , simulated road 48 6 8.5 25 7.7 salt runoff (+16 mg/L Cl) (2) Typical treated water subjected to 4 and 14 3-12 3.0-4.7 8-58 7.3 orthophosphate free chlorine (2 mg/L) corrosion control strategies (various: 0-1 mg/L P) (3) low chloride and high sulfate 22 121 0.2 10 8.3 none chloramines (4 mg/L) (3) high chloride and low sulfate 129 8 16 10 8.3 a Chloride-to-sulfate mass ratio (CSMR) is given as mg/L Cl- per mg/L SO42-. b PACl, polyaluminum chloride. Results and Discussion Effect of Galvanic Corrosion on Lead Release. Galvanic current measured between the anode (solder, lead, or tin wire) and the cathode (copper pipe) is an indicator of galvanic corrosion (26). For this study, negative current values indicated that the lead-tin solder, lead, or tin wires were anodic (sacrificed) while the copper pipes were cathodic (protected). As the magnitude of the measured galvanic current increased, lead release to the water increased for solder wires across all three case studies and for pure lead wire investigated in the second case study (Figure 2). Lead release followed a roughly linear relationship with the galvanic current, consistent with expectations based on Faraday’s law. This is also consistent with recent work by Sastri et al. who linked galvanic corrosion to lead leaching from solder in drinking water (27). In some cases lead concentrations reached more than 20 000 ppb in the macrocell anode compartment (results not shown). For 50:50 Pb/Sn solder, the measured currents reflected not only the corrosion rate of lead but also that of tin. Solder alloy corrosion may proceed with preferential leaching of one metal versus the other, but if it is assumed that each metal corroded at the same rate, the lead released from 50:50 Pb/Sn solder to the water was approximately three times less than predicted by Faraday’s law for the three case studies (Figure 2). Similarly, lead release to water from pure lead wire in Case Study 2 was about 4 times less compared to the predicted amount, assuming that 100% of the galvanic FIGURE 2. Lead release to bulk water, pH at solder surface, current was associated with the lead release. However, chloride concentration factor (CF), sulfate CF, and phosphate CF consistent with Oliphant’s findings (10), the vast majority of at the anode as a function of galvanic current. The blue dia- this “missing” lead was found to be accumulated in lead monds, red squares, purple asterisks, and black triangles scales on the lead anode and elsewhere in the apparatus, as represent Case Study 1 solder, Case Study 2 solder, Case Study 3 solder, and Case Study 2 lead wire, respectively. The solid confirmed by mass balances at the end of the experiment. line, dash-dot line, and dashed line represent the linear Similar trends were observed for tin release from solder and regression for solder, predicted oxidized lead from solder, and tin wires. predicted oxidized lead from pure lead wire, respectively. The potential of the copper pipe was stable ((0.1 V) as Measurements were taken after two days of water stagnation. the CSMR was varied (results not shown), further confirming The CF is equal to the concentration at the anode divided by that the electrochemical factors propagating the attack at the concentration at the cathode. The lead measurements were higher CSMR were occurring at the lead anode surfaces. The taken from the entire volume in the apparatus, while the actual lead levels released to the water from the apparatus chloride and sulfate concentrations were determined from used in these case studies was much greater than is observed “anode” and “cathode” volumes (Figure 2). The pH was mea- in practice, but is in close agreement to prior studies sured within 1 mm of the solder surface using a micro- examining small volumes of water contacting typical lead electrode. Case Study 2 solder data points include conditions solder joints in copper pipe (2). with no phosphate, and the lead wire data are the waters with Anion Migration. Anions such as chloride, sulfate, and 4 and 14 mg/L Cl and alkalinity above 15 mg/L as CaCO3. phosphate must be drawn to the anode surface to coun- terbalance released Pb2+ and Sn2+ and maintain electro- calculated by dividing the concentration in the 9 mL of neutrality (Figure 3). The measured concentrations of these solution closest to the anode by the concentration near the metals in the water near the anode were as high as 157 000 cathode. As the galvanic corrosion rate increased, the sulfate, ppb Pb and 41 000 ppb Sn, and cations such as sodium (Na+) phosphate, and chloride CFs increased as electromigration also migrated toward the cathode, which is the site of OH- became dominant over ion diffusion (Figure 2). For instance, production (results not shown). Other work by Kim (17) and sulfate was concentrated at the anode surface by a factor of Horng (16) also measured chloride and sulfate migration to 1.5 when the current density was approximately -1.2 µA/ the anode. Concentration factors (CFs) were used to compare cm2. When the current density quadrupled to -4.8 µA/cm2, anion accumulation at the anode versus the cathode in this 2.7 times more sulfate was measured in the anode compart- work and in Horng’s work. The CFs in this study were ment than in the cathodic area of the pipe. Similar trends 7078 9 ENVIRONMENTAL SCIENCE & TECHNOLOGY / VOL. 44, NO. 18, 2010
- 4. measurement technique as was observed in the other two case studies, a chloride concentration factor of 4 was detected using a microelectrode brought to within 1 mm of the anode surface. Hence, the actual CFs in the microlayer at the lead anode surface are likely much larger than reported herein based on collection of the relatively large water volumes (≈ 9 mL) near the anode surface. As expected based on the higher ionic transport numbers of sulfate versus chloride (28, 29), sulfate had a CF higher than for chloride at a given current density (Figure 2). Pure lead and pure tin wires were also evaluated in Case Study 2. For reasons that are not fully understood, in one water tested, only sulfate and phosphate accumulated at the pure lead anode surface, and chloride did not (Figure 2). For example, the sulfate concentration factor ranged from 0.7 to 3.3 for some water conditions, but there was not a strong trend between the concentration factor and the galvanic current density, which ranged from -0.6 to -6.9 µA/cm2. For pure tin wire in Case Study 2, there was little concentra- tion of the anions because the current density was nearly always below 2 µA/cm2. pH at Anodic Solder Surface. As the galvanic corrosion rate increased, the pH decreased at the anodic solder surface due to the Lewis acidity of lead and tin (Figure 2). At the solder surface after a two-day stagnation period, pH was as FIGURE 3. pH, chloride concentration, and sulfate concentration low as 3.7 for Case Study 1 and 2.5 for Case Study 3. Some as a function of distance from the bottom-most part of the measurements indicated that the pH dropped as much as 2 solder anode for Utility 1. The pH and the chloride con- pH units within 1 h of stagnation, demonstrating that days centrations were measured using a microelectrode. Sulfate of stagnation are not required to observe significant galvanic was measured by withdrawing samples from the apparatus. effects. Even when the galvanic corrosion activity was The location of the anode was between 0 and 6.4 cm on the relatively low as in Case Study 2, the pH still dropped from x-axis, and distances greater than 6.4 cm on the x-axis was pH 7.3 in the bulk water to as low as pH 3.8 at the solder considered the cathodic region. Error bars represent 95% surface. The very low pH values measured for solder and tin confidence intervals over triplicate measurements. wire were in the range of those predicted by solubility models (30), considering the Lewis acidity of the detected lead and tin concentrations. Consistent with expectations and prior research (31), the pH increased with distance from the anode due to the net OH- production at the cathode (Figure 3). Predicted Effect of pH and Anion Migration on Lead Leaching. To illustrate the effects of chloride and sulfate on lead solubility at the surface of lead anodes, modeling with MINEQL+ was conducted. For example, if 50 mg/L Pb(II) were released to the microlayer of water with 8 mg/L alkalinity as CaCO3 and the sulfate concentration at equilibrium was 240 mg/L (2.5 mM SO42-), 95% of the released lead is predicted FIGURE 4. Lead release from 50:50 Pb/Sn solder as a function to form larnakite (PbSO4:PbO) and cerrusite (PbCO3) solid of the chloride-to-sulfate mass ratio (CSMR) for the case stud- precipitates at pH 6.5 (Figure 5). These solids could coat the ies. Data from Case Study 2 in the plot represent a range of anode surface and reduce the rate of corrosive galvanic attack. alkalinity (8-58 mg/L as CaCO3) with and without orthophos- The 240 mg/L SO42- in the microlayer near the lead surface phate. Water in Case Study 1 was dosed with orthophosphate, could also be obtained by a 10× concentration of 24 mg/L and treated water in Case Study 3 contained no phosphate. SO42- (0.25 mM) from in the bulk water concentrating 10 times due to electromigration. In contrast, if chloride were were observed in Horng’s work, although the extent of ion present at the similar molar concentration mentioned for migration was less than that measured in this work. Specif- sulfate in the preceding example, the solubility of lead at the ically, a current density of -10 µA/cm2 resulted in a sulfate anode would be increased by 37% to 3.7 mg/L soluble Pb concentration factor of 1.4 at the anode, and the concentra- tion factor increased to 5 when the current density increased due to the formation of soluble PbCl+ complexes (Figure 5). to -25 µA/cm2 (16). The most prominent difference between The relative effect of chloride and sulfate on soluble lead the two studies is the presence of a cathodic copper surface at the solder surface would be much more dramatic at lower immediately adjacent to the anode in this work, which would pH values, or with greater concentration factors arising from tend to decrease the CF versus the microlayer at anode higher galvanic current densities. For example, if 240 mg/L surfaces in practice, since this portion of the copper surface SO42- and 50 mg/L Pb(II) were added to water at pH 4, only in the apparatus carried about 50% of the cathodic current. 3.7 mg/L Pb is predicted to remain soluble, while 93% of the In situations with very low galvanic currents, lead lead would precipitate as PbSO4 which could coat the anode concentrations were not as strongly impacted by the levels and reduce the corrosion rate (Figure 5). Conversely, chloride, of chloride and sulfate in the water in this study (ex., Case if present in the microlayer near the anode surface at the Study 2; Figure 4), consistent with expectations outlined same molar concentration as sulfate in this example, would earlier. Although CFs greater than one for sulfate and chloride yield 100% soluble lead at the same pH (77% free Pb2+, 15% in Case Study 3 were not detected with the macrocell PbHCO3+, 8% PbCl+). This explains the benefits of sulfate VOL. 44, NO. 18, 2010 / ENVIRONMENTAL SCIENCE & TECHNOLOGY 9 7079
- 5. Acknowledgments C.K.N. was partially supported by a National Science Foundation (NSF) Graduate Fellowship and a Via Fellowship. The experimental work was supported by funding from the Water Research Foundation (WaterRF) and the U.S. EPA, whereas the advanced analysis of the data and writing of the manuscript was supported by the NSF under grant CBET- 0933246. The opinions, findings, conclusions, or recom- mendations are those of the authors and do not necessarily reflect the views of the WaterRF, NSF, or the U.S. EPA. The authors also thank Traci Case, Christopher Hill, France Lemieux, Joseph Marcinko, and Anne Spiesman. Supporting Information Available Additional descriptions, figures, and tables regarding the bench scale water treatment, tin release, predicted pH, FIGURE 5. Equilibrium soluble lead concentrations at pH 6.5 chloride concentrations in Case Study 3, potential measure- (top) and pH 4.0 (bottom) at a lead surface if 50 mg/L Pb(II) is ments, and mass balance of oxidized lead. This material is released to water with 8 mg/L alkalinity as CaCO3. Sulfate and available free of charge via the Internet at http://pubs.acs.org. chloride concentrations at the lead surface can be greater than in bulk water due to electromigration. In water with sulfate, larnakite (PbSO4:PbO), anglesite (PbSO4), and cerrusite (PbCO3) Literature Cited solids are predicted to form at pH 6.5, and PbSO4 solids are (1) Edwards, M.; Dudi, A. Role of chlorine and chloramine in predicted to begin forming at 0.1 mM SO4 at pH 4.0. If chloride corrosion of lead-bearing plumbing materials. J. Am. Water were dominant in the water and at the lead anode, PbCO3 and Works Assoc. 2004, 96 (10), 69–81. Pb(OH)2 solids would form at pH 6.5, and no precipitates are (2) Edwards, M.; Triantafyllidou, S. Chloride-to-sulfate mass ratio predicted to form at pH 4.0. and lead leaching to water. J. Am. Water Works Assoc. 2007, 99 (7), 96. (3) Giammar, D. In Influence of Water Chemistry on the Dissolution and the detrimental effect of chloride in preventing lead Rates of Lead Corrosion Products Proceedings of American Water contamination of potable water in lead solder:copper joints Works Association Water Quality Technology Conference, Seattle, (Figure 4). WA, November 15 2009; American Water Works Association: In the present study, all of the lead would be leached Denver, CO, 2009. (4) Lytle, D. A.; Schock, M. R. Formation of Pb(IV) oxides in from the solder wires in Case Study 2 after the experiment chlorinated water. J. Am. Water Works Assoc. 2005, 97 (11), 102– continued 5-630 years, based on the galvanic currents from 114. Week 15 of the study. In practice, the quality of soldering (5) Schock, M. R.; Swertfeger, J.; Harmon, S. M.; Lohmann, R.; workmanship varies from home to home, as exposed solder DeMarco, J. In Tetravalent lead: A hitherto unrecognized control at a given pipe joint can range from a nearly negligible mass of tap water lead contamination, Proceedings of American Wa- ter Works Association Water Quality Technology Conference, to well over 10 g (32). Thus, the self-perpetuating corrosion Nashville, TN, November 11-14, 2001; American Water Works can be very serious in some situations and can require Association: Denver, CO, 2001. adjustment of the CSMR back to lower ranges to reduce lead (6) Edwards, M.; Triantafyllidou, S.; Best, D. Elevated blood lead leaching to below the USEPA LCR action level of 15 ppb (2). in young children due to lead-contaminated drinking water: Implications for Drinking Water Systems. Galvanic Washington, DC, 2001-2004. Environ. Sci. Technol. 2009, 43 (5), 1618–1623. reactions can drive corrosion of lead metal at copper joints (7) Miranda, M. L.; Kim, D.; Hull, A. P.; Paul, C. J.; Galeano, M. A. and contribute to exceedance of the U.S. EPA LCR (2, 15). Changes in blood lead levels associated with use of chloramines Furthermore, in waters supporting relatively high galvanic in water treatment systems. Environ. Health Perspect. 2007, currents, higher chloride and lower sulfate can worsen 115 (2), 221–225. (8) Renner, R. Mapping out lead’s legacy. Environ. Sci. Technol. corrosion of lead solder, which is believed to be the dominant 2009, 43 (6), 1655–1658. source of lead in water in many situations (11). The detriments (9) Gregory, R. Galvanic corrosion of lead solder in copper pipework. of chloride are attributed to its migration to the anode surface Water Environ. J. 1990, 4 (2), 112–118. and formation of soluble PbCl+ complexes, whereas the (10) Oliphant, R. J. Summary Report on the Contamination of Potable benefits of sulfate may be attributed to formation of relatively Water by Lead from Soldered Joints; 125E; Water Research Centre: Wiltshire, UK, November,1983. insoluble PbSO4 (or similar) solids. This work is the first to (11) American Water Works Association Research Foundation. demonstrate the very large gradation in pH, chloride, sulfate, Internal Corrosion of Water Distribution Systems, 2nd ed.; and lead that can be produced via galvanic corrosion of lead American Water Works Association: Denver, CO, 1996. solder:copper joints under stagnant water conditions, which (12) Reiber, S. Galvanic stimulation of corrosion on lead-tin solder sweated joints. J. Am. Water Works Assoc. 1991, 83 (7), 83–91. can often exceed 48 h duration over weekends in building (13) Edwards, M.; Jacobs, S.; Dodrill, D. Desktop guidance for plumbing systems. Recently, similar conclusions about low mitigating Pb and Cu corrosion by-products. J. Am. Water Works local pH, high chloride, high sulfate, and very high lead in Assoc. 1999, 91 (5), 66–77. microenvironments near surfaces of lead anodes were drawn (14) Dudi, A. Reconsidering Lead Corrosion in Drinking Water: by Desantis et al., based on independent mineralogical Product Testing, Direct Chloramines Attack and Galvanic Corrosion. Master’s Thesis, Virginia Tech, Blacksburg, VA, 2004. examination of lead:copper pipe connections from extracted (15) Nguyen, C. K.; Stone, K. R.; Edwards, M. A. Chloride-to-sulfate service line samples (20). In sum, these microlayer effects mass ratio: Practical studies in lead solder galvanic corrosion. can explain a subset of persistent lead corrosion problems J. Am. Water Works Assoc. 2010. In Press. in some buildings and from lead:copper service line joints (16) Horng, J.-J. A Model Study of Ionic Transport and Its Role in at some water utilities (2). Additional work is needed to better Electrokinetic Treatment of Contaminated Soils. Doctoral Dissertation, University of Washington, Seattle, 1993. understand situations in which persistent galvanic currents (17) Kim, K.-J.; Cho, J.-M.; Baek, K.; Yang, J.-S.; Ko, S.-H. Electrokinetic occur, and how they can be practically mitigated through removal of chloride and sodium from tidelands. J. Appl. control of water chemistry. Electrochem. 2010. 7080 9 ENVIRONMENTAL SCIENCE & TECHNOLOGY / VOL. 44, NO. 18, 2010
- 6. (18) Lim, K.-H.; Franses, E. I., Change in overall ohmic resistance (25) American Public Health Association (APHA). Standard Methods due to migration/diffusion of electrolytes. In Electrochemical for the Examination of Water and Wastewater, 20th ed.; APHA, Cell Design, White, R. E., Ed.; Plenum Press: Houston, TX, American Water Works Association, and Water Environment 1984. Federation: Washington, D.C., 1998. (19) Schock, M. R. Understanding corrosion control strategies for (26) ASTM Standard G71-81, Standard Guide for Conducting and lead. J. Am. Water Works Assoc. 1989, 81 (7), 88–100. Evaluating Galvanic Corrosion Tests in Electrolytes; ASTM (20) DeSantis, M. K.; Welch, M. M.; Schock, M. R. In Mineralogical International: West Conshohocken, PA, 2009. evidence of galvanic corrosion in domestic, drinking water (27) Sastri, V. S.; Subramanian, K. S.; Elboujdaini, M.; Perumareddi, J. R. pipes, Proceedings of American Water Works Association Water Inhibition of release of lead into water owing to galvanic corrosion Quality Technology Conference, Seattle, WA, November 15- of lead solders. Corros. Eng. Sci. Technol. 2006, 41 (3), 249–254. 19, 2009; American Water Works Association: Denver, CO, (28) Tower, O. F. The Conductivity of Liquids: Methods, Results, 2009. Chemical Applications, and Theoretical Considerations; Chemi- cal Publishing Company: Easton, PA, 1905. (21) Nguyen, C.; Edwards, M.; Stone, K.; Clark, B. In Mechanistic (29) Arrhenius, S. Textbook of Electrochemistry; Longmans, Green, effects of chloride-to-sulfate ratio on lead corrosion, Proceedings and Co.: New York, NY, 1902. of American Water Works Association Annual Conference and (30) Schecher, W. D.; McAvoy, D. C. MINEQL+: A Chemical Equi- Exposition, Atlanta, GA, June 8-12, 2008; American Water Works librium Modeling System. Version 4.0 for Windows; Environ- Association: Denver, CO, 2008. mental Research Software: Hallowell, ME. (22) Guo, Y. A new potential-pH diagram for an anodic film on Pb (31) Kuhn, A. T.; Chan, C. Y. pH changes at near-electrode surfaces. in H2SO4. J. Electrochem. Soc. 1992, 139 (8), 2114–2120. J. Appl. Electrochem. 1983, 13 (2), 189–207. (23) Sato, N. Interfacial ion-selective diffusion layer and passivation (32) Economic and Engineering Services. Lead Control Strategies; of metal anodes. Electrochim. Acta 1996, 41 (9), 1525–1532. Water Research Foundation: Denver, CO, 1990. (24) Sato, N. The stability of localized corrosion. Corros. Sci. 1995, 37 (12), 1947–1967. ES1015185 VOL. 44, NO. 18, 2010 / ENVIRONMENTAL SCIENCE & TECHNOLOGY 9 7081