
Recomendados
Recomendados
Mais conteúdo relacionado
Destaque
Destaque (11)
Semelhante a The Digital Grain Size Project: grain size estimates from images of sediment
Semelhante a The Digital Grain Size Project: grain size estimates from images of sediment (20)
Último
Último (20)
The Digital Grain Size Project: grain size estimates from images of sediment
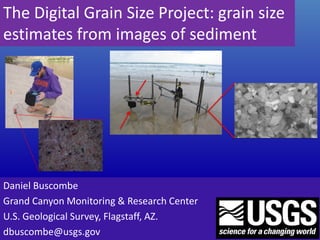
- 1. The Digital Grain Size Project: grain size estimates from images of sediment Daniel Buscombe Grand Canyon Monitoring & Research Center U.S. Geological Survey, Flagstaff, AZ. dbuscombe@usgs.gov
- 2. Collaborators: Martin Austin, Daniel Conley, Gerd Masselink, Alex Nimmo-Smith (UoP) Dave Rubin, Jessie Lacy, Jon Warrick, Chris Sherwood, Guy Gelfenbaum, Bruce Jaffe, Curt Storlazzi, Paul Grams, Scott Wright, Ted Melis (USGS) Ian Miller (Wash. SeaGrant) Jon Williams (ABPmer) Dayton Dove (BGS) Joe Wheaton (USU) Technical Support: Hank Chezar (USGS) Gerry Hatcher (USGS) Robert Wyland (USGS) Bob Tusso (USGS) Thanks
- 3. Outline • Why take pictures of sediment? • How do you estimate grain size from those images? • How do you take suitable pictures? • Software (the Digital Grain Size Project) • The future
- 4. Why take pictures of sediment? Huge increase in temporal resolution and/or spatial coverage No physical samples required You can’t always visit your field site Temporal Resolution
- 5. How do you estimate grain size from those images? • Deterministic versus statistical • Evolution of methods • Current method
- 6. No 'background' intensity against which to threshold Subjective choice of filter sizes and operation sequences Difficult to design a 'universal‘ algorithm which works equally well Non-diffuse reflectance, particle overlap, marks/scratches,etc Deterministic
- 7. Statistical – Rubin (2004) Rubin (2004) J. Sed. Res Characterize features without directly measuring them Circumnavigate problem of detecting grains
- 8. But reliant on calibration Errors introduced by calibration Buscombe (2008), Sedimentary Geology Buscombe and Masselink (2009), Sedimentology Statistical Could also use spectra, fractals and variograms
- 9. Grain size found as 2pi times typical grain-scale wavenumber 1. Requires neither calibration nor advanced image processing algorithms 2. Direct statistical estimate, grid-by- number style, of mean of all intermediate axes Buscombe, Rubin & Warrick (2010) Journal of Geophysical Research Rk 2 Statistical – Buscombe et al (2010)
- 10. •Generic & transferable expressions for particle size mean and standard deviation •No calibration or tunable parameters •Supported using a simple theoretical model Buscombe & Rubin (2012) Journal of Geophysical Research Statistical – Buscombe and Rubin (2012)
- 11. Global wavelet power spectrum Short sequences Non-stationarity, aperiodic Non-Gaussian distributions Statistical – Buscombe (2013) Buscombe (2013) Sedimentology
- 12. Tested with a wide range of sediments
- 14. How do you take suitable pictures? • Exposed sediment • Submerged sediment • Biogenic? • Mud?
- 15. Praa Sands, UK Dan Conley, Plymouth University Dave Rubin, USGS
- 16. Praa Sands, UK Buscombe, Conley, Nimmo-Smith, Rubin (in prep)
- 17. Colorado River in Grand Canyon Dave Rubin, USGS Paul Grams, USGS Ted Melis, USGS 100 microns 300 microns
- 18. Slapton Sands, UK Gerd Masselink, Plymouth University Buscombe, PhD thesis (2008)
- 19. Strait of Juan de Fuca Elwha River Dungeness SpitPort Angeles Jon Warrick, USGS Ian Miller, UCSC
- 20. How do you take suitable pictures? • Exposed sediment • Submerged sediment • Biogenic? • Mud?
- 21. Praa Sands, UK A paddle constructed from a dive fin (1) is pushed back and forth by waves, turning a ratcheting speed-reducer in an oil-filled cylinder (2). The rotating output wheel of the speed-reducer (3) pulls down on the chain (4), which raises the video camera (5). When the chain on the wheel (3) passes its the lowest position, the ratchet allows the camera to fall to the bed … … and a tilt sensor turns on a battery-powered video camera (5) and solid-state recorder (6) to collect a video Buscombe et al (2014), Limnology & Oceanography Methods
- 22. Grainsize(mm) Grain size (mm) Inverse relationship between flow speed and bed grain size • Weak flow, preferential selection of fines, leaving coarse lag • Stronger flow, more equal mobilisation, lag appears finer Bottom orbital velocity Praa Sands, UK Buscombe, Conley, Nimmo-Smith, Rubin (in prep)
- 23. Decreasing vertical gradient with increasing shear (less selective resuspension with increasing shear) Buscombe, Conley, Nimmo-Smith, Rubin (in prep) Praa Sands, UK Image from holographic camera High energy Low energy
- 24. The Santa Cruz Seafloor Observatory Dave Rubin, USGS Jessie Lacy, USGS Curt Storlazzi, USGS Chris Sherwood, USGS
- 25. The Santa Cruz Seafloor Observatory
- 26. The Santa Cruz Seafloor Observatory
- 27. The Santa Cruz Seafloor Observatory
- 28. The Santa Cruz Seafloor Observatory Buscombe et al (2014), Limnology & Oceanography Methods
- 29. Colorado River in Grand Canyon Rubin et al (2007), Sedimentary Geology
- 30. Bars: Eddies: Channel: > 0.5 mm~0.45 mm< 0.4mm ~500 m Lower Marble Canyon, 2009-12 Above LCR confluence, 2009 – 2014:
- 31. UK Continental Shelf Dayton Dove, BGS Images courtesy of British Geological Survey
- 32. The Digital Grain Size Project Matlab tools Python tools Web/cloud application
- 34. Resolution Image courtesy of British Geological Survey Matlab tools https://github.com/dbuscombe-usgs/DGS
- 35. Cropping Image courtesy of British Geological Survey Matlab tools https://github.com/dbuscombe-usgs/DGS
- 36. Cropping Image courtesy of British Geological Survey Matlab tools https://github.com/dbuscombe-usgs/DGS
- 37. Matlab tools https://github.com/dbuscombe-usgs/DGS Select/cycle through images Set resolution Save results CalculateSelect ROI Filter
- 38. IMG1931 Mean = 7.7 pixels Median = 7.22 D75-D25 = 13.67 Skewness = 0.17 Image courtesy of British Geological Survey
- 39. IMG2008 Mean = 18.02 pixels Median = 17.1 D75-D25 = 27.59 Skewness = 0.1 Image courtesy of British Geological Survey
- 40. IMG2016 Mean = 20.4 pixels Median = 20.18 D75-D25 = 28.97 Skewness = 0.07 Image courtesy of British Geological Survey
- 41. IMG1936 Mean = 24.6 pixels Median = 24.26 D75-D25 = 30.77 Skewness = 0.04 Image courtesy of British Geological Survey
- 42. pip install pyDGS git clone https://github.com/dbuscombe-usgs/pyDGS.git python setup.py install import DGS density = 10 # process every 10 lines res = 0.01 # mm/pixel doplot = 0 # don't make plots image_folder = '/home/sed_images' DGS.dgs(image_folder,density,doplot,res) image_file = '/home/sed_images/my_image.png' mnsz, srt, sk, kurt, pd = DGS.dgs(image_file,density,doplot,res) Python tools https://github.com/dbuscombe-usgs/pyDGS
- 43. Used by (at least) 47 institutions in 12 countries US Geological Survey, USA Dept. of Ecology, State of Washington, USA Northwest Hydraulic Consultants, Canada Northern Arizona University, USA Dartmouth College, USA Johns Hopkins University, USA University of California Santa Cruz, USA Franklin and Marshall College, USA University of California Los Angeles, USA Utah State University, USA Southwest Research Institute, Boulder, USA Universidad EAFIT, Colombia University of Washington, USA Oregon State University, USA University of California Davis, USA University of Pennsylvania, USA Brigham Young University, USA University of Calgary, Canada University of Texas at Austin, USA Geoengineers Inc. USA University of Delaware, USA Western Washington University, USA River Design Group Inc., USA GMA Hydrology Inc. USA Iowa State University, USA U.S. Forest Service, USA Queens University Belfast, UK Freie Universitat Berlin, Germany Instituto Superior Technico, Portugal Plymouth University, UK Institut de Physique du Globe du Paris, France Deltares, the Netherlands Imperial College London, UK Durham University, UK Technical University Delft, the Netherlands University of Queensland, Australia University of Sydney, Australia University of Auckland, New Zealand Tsinghua University, China Zhejiang University, China University of Liverpool, UK Centre Européen de Recherche et d'Enseignement des Géosciences de l'Environnement, France Heriot-Watt University, UK Instituto de Ciencias Agrarias, Spain Université de Caen Basse Normandie, France British Geological Survey, UK University of Leicester, UK
- 44. What’s next? Digital Grain Size in the web browser? Current USGS-CDI proposal in review
- 45. What’s next? Images courtesy of Gary Barton,USGS Idaho Water Science Center Glen Canyon, AZ Dec 2014 mixed sand/gravel/veg Areal coverage of sediment types?
- 46. Image courtesy Raleigh Martin, UCLA Image courtesy Jon Warrick, USGS Areal map of sediment sizes? Size in pixels
- 47. Thanks for listening • Python: https://pypi.python.org/pypi/pyDGS pip install pyDGS https://github.com/dbuscombe-usgs/pyDGS python setup.py install • Matlab: https://github.com/dbuscombe-usgs/DGS • Web application … watch this space Daniel Buscombe Grand Canyon Monitoring & Research Center U.S. Geological Survey, Flagstaff, AZ. dbuscombe@usgs.gov