
Recomendados
Recomendados
Mais conteúdo relacionado
Mais procurados
Mais procurados (20)
Semelhante a Bmb 496 spring '10
Semelhante a Bmb 496 spring '10 (20)
Bmb 496 spring '10
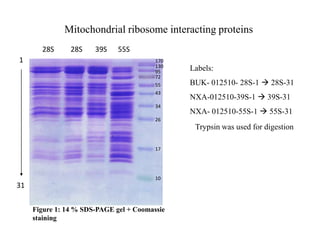
- 1. Mitochondrial ribosome interacting proteins 28S 28S39S 55S 1 170 130 Labels: BUK- 012510- 28S-1 28S-31 NXA-012510-39S-1 39S-31 NXA- 012510-55S-1 55S-31 95 72 55 43 34 26 Trypsin was used for digestion 17 10 31 Figure 1: 14 % SDS-PAGE gel + Coomassie staining
- 2. Database analysis criteria Ribosomal and metabolic proteins, except for S4, 3-ketoacyl-CoA thiolase and acetyl-CoAacetyltransferase, were not taken into consideration. Proteins found at least in one of the subunits (28S, 39S) and in the intact ribosome were noted. For the proteins that were observed in multiple bands, the ones with the highest scores were selected. The results that scored lower than 55 and included more than 1 peptide were excluded. The results that scored lower than 50 were excluded from the list.
- 3. Mitochondrial Ribosome Associated Proteins Huseyin’s samples 39S Control 39S RNase 55S Contol 55S RNase Database analysis criteria: Proteins that were present in control samples and lost in RNase samples were reported as ribosome associated proteins in the list of 39S and 55S. MRPs that are present in control samples and increase in RNase samples were reported in the list of 39S and 55S. Apoptosis inducing factor (AIF) was investigated by Western Blot by Huseyin. No difference was observed between Control and RNase samples.
- 5. EF-G overexpression (16.5 hours at 22°C) was not visible. Figure 2 : 12 % SDS-PAGE gel + Coomassie Staining EF-Tuoverexpression : Aliquots (1 ml) were collected at 0, 1 ,2, 3, 4 hours and 40, 25, 15, 10, 5 µl were loaded respectively. EF-G overexpression: Aliquots (1 ml) were collected at 0, 16.5 hours and 40, 5 µlwere loaded respectively.
- 7. Some of the protein was left in the pellet.
- 8. Purification was repeated with other pellets of the same samples. Beads 15K- Pellet 15K-Soup E#3 E#5 E#2 E#1 E#4 EF-G Figure3&4: 12% SDS-PAGE + Coomassie staining. 20 µl of each sample was loaded. Ni-NTA (PerfectPRO) was used for purification. Ni-NTA resin slurry was incubated with soups at 4°C for 2 hours.
- 9. EF-Tu and EF-G Purification (4/16/2010) Wash #1 15K-Soup Beads E#5 Wash #1 E#1 E#4 E#2 15K-Soup E#5 E#3 E#1 E#4 Beads E#2 E#3 EF-G EF- Tu Figure5&6: Western Blot. 20 µl of each sample was loaded to 12% SDS-PAGE gels. Ni-NTA was used for purification (O/N washing). Ni-NTA resin slurry was incubated with soups at 4°C for 2 hours.
- 10. EF-Tu and EF- G overexpression (4.12.2010) EF-G EF-Tu EF-G EF-Tu 0h 16.5h 0h 2h 4h 0h 16.5h 0h 2h 4h EF-G (83.5 kDa) EF-Tu (49.5 kDa) Figure 7: 12 % SDS-PAGE gel + coommasie staining EF-Tuoverexpression: Aliquots (1 ml) were collected at 0,2,4 hours and 40, 15, 5 µl were loaded respectively. EF-G overexpression : Aliquots ( 1ml) were collected at 0 and 16.5 hours and 40 and 5 µl were loaded respectively. Figure 8: Western Blot