Interactive Web Map of BALEPHI-B HYDROPOWER PROJECT
•
2 gostaram•1,022 visualizações

Web Mapping Application of Balephi-B Hydropower Project. Probably the first of its kind in Nepal

Recomendados
Mais conteúdo relacionado
Mais procurados
Mais procurados (7)
Destaque
Destaque (10)
Semelhante a Interactive Web Map of BALEPHI-B HYDROPOWER PROJECT
Semelhante a Interactive Web Map of BALEPHI-B HYDROPOWER PROJECT (20)
Mais de Biplov Bhandari
Mais de Biplov Bhandari (12)
Último
Último (20)
Interactive Web Map of BALEPHI-B HYDROPOWER PROJECT
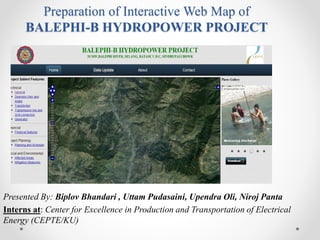
- 1. Preparation of Interactive Web Map of BALEPHI-B HYDROPOWER PROJECT Presented By:Biplov Bhandari , UttamPudasaini, UpendraOli, Niroj Panta Interns at: Center for Excellence in Production and Transportation of Electrical Energy (CEPTE/KU)
- 2. PRESENTATION OUTLINE Introduction Objectives Rationale Scope of work Resources Used Methodologies Results Limitations Recommendations Conclusion Work Schedule
- 3. INTRODUCTION Balephi B hydropower Capacity : 20 MW Project lies between longitudes 85°45’00” and 85°46’30” and latitudes 27°48’24” and 27°50’48” Lies on Jalbire, Bataseand Phulpingkot VDCs of Sindhupalchowkdistrict
- 4. Interactive Web Mapping Computerized maps that allow users to interact with various aspects of the maps themselves. Interactive options may include Zooming in or out on a specified location, Panning easily between geographic areas, Have detail information of particular locations by the means of additional info's added to the map objects . Such maps have become even more detailed and user-friendly, permitting professionals the ability to interact, update, and make changes to the maps in real time.
- 5. RATIONALE Static maps provides limited information regarding an object or phenomenon Tedious job of recording attribute information in the paper regarding every detail Planning gets ineffective in lack of spatial overview of different features Details regarding every components at different locations along with different types of interactions on maps aren't available at a single portal As a result planning activities aren't scientific and effective
- 6. SCOPE OF WORK Development of a website of Balephi Hydropower focusing on Interactive Web Mapping with following two major information: Spatial Information: Location of Intake structure and dam works, Desilting Basin, Flushing System, Headrace Tunnel, Surge tank, Powerhouse and its inner components, Penstock, Access Roads, Turbine and all other natural and man-made structures. Attribute Information: Attributes of above mentioned elements of Hydropower
- 7. OBJECTIVES The main objective of this project is to prepare a web map of Balephi hydropower with following features: An ‘easy to handle’ data updating interface which would actually update the core database A server connection to the database A map viewer which would display the database elements (addressing all the recent updates) Different components of the hydropower along with their specific details Other important aspects like Social and Environmental impacts of the project
- 8. RESOURCES USED Geoserver:An source software server written in Java that allows users to share and edit geospatial data. PostgreSQL(postGIS):PostgreSQLis a powerful, open source object- relational database system. Openlayers: Pure JavaScript library for displaying map data in most modern web browsers, with no server-side dependencies. Apache(http server):Apache is an open-source software. The Apache HTTP Server is a web server software program.
- 9. METHODOLOGY Data Collection Data Preparation Web Mapping System Architecture
- 10. OUTPUTS Finaloutputofthisprojectisn’tjustaninteractivemapbutit’sacompletewebsiteofBalephiHydro Majorfeatureofwebsite: AdminandgeneralUserPrivilege:Providesdifferentlevelofaccessaccordingtotheusertype.eg:Adminscaneditthedata CustomizedPop-Ups:Detailsregardingeverycomponentsofthehydropowercanbeobtainedinteractively Zooming,Panning,Overview,LayerSwitchersetc.hasaddedmorelevelofinteraction DownloadfacilitywhereuserscandownloadthefilesindifferentformatslikeCSV,KML,PDFandshpfileformats AttractiveCSStoincreasethebeautyofthewebsite
- 11. MAJOR ADVANTAGES Visiting the project site each and every time to obtain information on the works progress can now be done sitting in-front of your computers Researchers can now download and upload the information regarding the natural environment around the hydropower plant Different levels of security according to the user groups has increased the reliability of the system
- 12. LIMITATIONS Requires good internet connection. Offline data loading is not available for data layers. Data loading is comparatively slower in our website while loading large amount of data Data regarding Social and Environmental factors are still lacking in the website. Present website can only be accessed through local server
- 13. RECOMMENDATIONS Other modern libraries like leaflets can be used for visually attractive maps GeoJSON data formats can to be used for effective and fast data loading Real time data from sensors can also be incorporated Map prepared in this way can be hosted through the map server installed at KU It will help any individual to easily visualize the details of the hydropower components and ongoing works
- 14. CONCLUSION Aweb based visualization of all the details of a hydropower plant has been finally created. Interactive web maps should be prioritized in the website of Hydropower companies because they explains a lot about every single components of project A trend of utilizing the power of geospatial knowledge and World Wide Webto disseminate the useful information of a project site through interactive web maps is already initiated.