SlideShare uma empresa Scribd logo
1 de 15
0–29
8
6
4
2
0
Test Result in %
The Shape of Graphed Results involves Symmetry and Skew
0–29
8
6
4
2
0
Test Result in %
There are a small number of students who have done well, which makes
this Graph stretch out horizontally to the right.
Going to the Right is Positive, so it has “Positive Skew”
0–29
8
6
4
2
0
Test Result in %
The Kangaroo fits onto our graph with its tail going to the RIGHT.
Going to the Right is Positive, so it has “Positive Skew”
0–29
8
6
4
2
0
Test Result in %
This particular group has lots of Low scores and has not performed well.
The Mode will be to the left of the Median, and the Mean to the right.
Mode < Median < Mean
0–29
8
6
4
2
0
Test Result in %
There are a small number of students who have done poorly, which
makes this Graph stretch out horizontally to the left.
Going to the Left is Negative, so it has “Negative Skew”
0–29
8
6
4
2
0
Test Result in %
The Kangaroo fits onto our graph with its tail going to the LEFT.
Going to the Left is Negative, so it has “Negative Skew”
0–29
8
6
4
2
0
Test Result in %
This particular class has lots of High scores and has performed very well.
The Mode will be to the right of the Median, and the Mean to the left.
Mean < Median < Mode
0–29
8
6
4
2
0
Test Result in %
This particular class is fairly normal and has both low and high scores.
This graph stretches out evenly on both sides of the Mode at 60-69.
The Graph is “Symmetrical”
0–29
8
6
4
2
0
Test Result in %
Two identical Kangaroos show this graph is a mirror image type shape.
The Graph is “Symmetrical”
0–29
8
6
4
2
0
Test Result in %
This particular class is fairly normal and has both low and high scores.
The Mean, Median, and Mode will all be close together in the middle.
Mean ~ Median ~ Mode
The Kangaroo fits onto our graph with its tail going to the RIGHT.
Going to the Right is Positive, so it has “Positive Skew”
Stem Leaf
0 1 1 2 4 7 8
1 2 2 3 5 6 6 8 9
2 1 5 6 7 7 8 8 9 9 9
3 2 4 4 5 7 7 8
4 1 3 5 8
5 2 3 7
6 2 3 4
7 2 6
8 3
9 2
Look at the S&L Plot
sideways, and form a
rotated 90 degrees view
StemLeaf
0112478
122356689
21567788999
32445778
41358
5237
6234
726
83
92
The Kangaroo fits onto our graph with its tail going to the LEFT.
Going to the Left is Negative, so it has “Negative Skew”
Stem Leaf
0 1
1 2
2 1 5
3 2 4 8
4 1 3 5
5 2 3 7
6 2 3 4 5 6 6 7 7
7 2 2 5 5 6 7 7 7 8 8 9
8 1 3 4 4 5 6 6 7 7 7
9 2 3 4 5 6 6 7 8
StemLeaf
01
12
215
3248
4135
5237
623456677
722556777889
81344566777
923456678
Look at the S&L Plot sideways
to form a rotated 90 degrees view
Stem Leaf
0 1 2
1 2 4 6
2 1 5 6 6
3 2 4 8 8 9
4 1 3 5 6 7 7 8
5 2 3 4 5 6 6 9 9 9
6 2 3 4 5 6 6 7
7 2 2 5 5 6
8 1 3 4 7
9 2 3 5
Look from the side of
the S&L Plot and form a
rotated 90 degrees view
StemLeaf
012
1246
21566
324889
41356778
5234566999
62345667
722556
81347
9235
Two identical Kangaroos show this graph is a mirror image type shape.
The S&L Plot is “Symmetrical”
SYMMETRIC RIGHT LEFT
DATA SKEWED SKEWED
3 7 3 58 3 0
4 36 4 013345569 4 5
5 017 5 2446 5
6 1120 6 17 6 2
7 356789 7 7 17
8 0158 8 2 8 2445
9 43 9 5 9 012235569
10 0 10 0 10 000
http://passyworldofmathematics.wordpress.com/

Mais conteúdo relacionado

Mais procurados

Introduction to Data Analysis With R and R Studio
Introduction to Data Analysis With R and R StudioIntroduction to Data Analysis With R and R Studio
Introduction to Data Analysis With R and R StudioAzmi Mohd Tamil
 
Multiple Regression and Logistic Regression
Multiple Regression and Logistic RegressionMultiple Regression and Logistic Regression
Multiple Regression and Logistic RegressionKaushik Rajan
 
SPSS skills- Qualitative vs. Quantitative Research using SPSS
SPSS skills- Qualitative vs. Quantitative Research using SPSSSPSS skills- Qualitative vs. Quantitative Research using SPSS
SPSS skills- Qualitative vs. Quantitative Research using SPSSMahesh Kumar, cert. FSA
 
Chi square test final
Chi square test finalChi square test final
Chi square test finalHar Jindal
 
Correlation analysis
Correlation analysisCorrelation analysis
Correlation analysisVan Martija
 
Hypothesis testing1
Hypothesis testing1Hypothesis testing1
Hypothesis testing1HanaaBayomy
 
Sampling and sample size determination
Sampling and sample size determinationSampling and sample size determination
Sampling and sample size determinationRemas Mohamed
 
2 way ANOVA(Analysis Of VAriance
2 way ANOVA(Analysis Of VAriance2 way ANOVA(Analysis Of VAriance
2 way ANOVA(Analysis Of VAriancemusadoto
 
Scatter plots
Scatter plotsScatter plots
Scatter plotsswartzje
 
Probability Distributions
Probability DistributionsProbability Distributions
Probability DistributionsCIToolkit
 
Inferential statistics powerpoint
Inferential statistics powerpointInferential statistics powerpoint
Inferential statistics powerpointkellula
 
Descriptive and Inferential Statistics
Descriptive and Inferential StatisticsDescriptive and Inferential Statistics
Descriptive and Inferential StatisticsDanica Antiquina
 
Statistics "Descriptive & Inferential"
Statistics "Descriptive & Inferential"Statistics "Descriptive & Inferential"
Statistics "Descriptive & Inferential"Dalia El-Shafei
 

Mais procurados (20)

SCATTER PLOTS
SCATTER PLOTSSCATTER PLOTS
SCATTER PLOTS
 
Spss training notes
Spss training notesSpss training notes
Spss training notes
 
Introduction to Data Analysis With R and R Studio
Introduction to Data Analysis With R and R StudioIntroduction to Data Analysis With R and R Studio
Introduction to Data Analysis With R and R Studio
 
Multiple Regression and Logistic Regression
Multiple Regression and Logistic RegressionMultiple Regression and Logistic Regression
Multiple Regression and Logistic Regression
 
SPSS skills- Qualitative vs. Quantitative Research using SPSS
SPSS skills- Qualitative vs. Quantitative Research using SPSSSPSS skills- Qualitative vs. Quantitative Research using SPSS
SPSS skills- Qualitative vs. Quantitative Research using SPSS
 
Chi square test final
Chi square test finalChi square test final
Chi square test final
 
Correlation analysis
Correlation analysisCorrelation analysis
Correlation analysis
 
Linear regression
Linear regressionLinear regression
Linear regression
 
Hypothesis testing1
Hypothesis testing1Hypothesis testing1
Hypothesis testing1
 
Sampling and sample size determination
Sampling and sample size determinationSampling and sample size determination
Sampling and sample size determination
 
Comparing means
Comparing meansComparing means
Comparing means
 
Testing Hypothesis
Testing HypothesisTesting Hypothesis
Testing Hypothesis
 
2 way ANOVA(Analysis Of VAriance
2 way ANOVA(Analysis Of VAriance2 way ANOVA(Analysis Of VAriance
2 way ANOVA(Analysis Of VAriance
 
Coefficient of correlation
Coefficient of correlationCoefficient of correlation
Coefficient of correlation
 
Correlations
CorrelationsCorrelations
Correlations
 
Scatter plots
Scatter plotsScatter plots
Scatter plots
 
Probability Distributions
Probability DistributionsProbability Distributions
Probability Distributions
 
Inferential statistics powerpoint
Inferential statistics powerpointInferential statistics powerpoint
Inferential statistics powerpoint
 
Descriptive and Inferential Statistics
Descriptive and Inferential StatisticsDescriptive and Inferential Statistics
Descriptive and Inferential Statistics
 
Statistics "Descriptive & Inferential"
Statistics "Descriptive & Inferential"Statistics "Descriptive & Inferential"
Statistics "Descriptive & Inferential"
 

Destaque

Skewness & Kurtosis
Skewness & KurtosisSkewness & Kurtosis
Skewness & KurtosisNavin Bafna
 
Finding the Mean from Grouped Frequency Table
Finding the Mean from Grouped Frequency TableFinding the Mean from Grouped Frequency Table
Finding the Mean from Grouped Frequency TableMoonie Kim
 
Globalization is (not) God: Leadership Challenges for Civil Society Sectors
Globalization is (not) God: Leadership Challenges for Civil Society SectorsGlobalization is (not) God: Leadership Challenges for Civil Society Sectors
Globalization is (not) God: Leadership Challenges for Civil Society SectorsCharmaine Barton
 
3. frequency distribution
3. frequency distribution3. frequency distribution
3. frequency distributionIlham Bashir
 
Data Representations
Data RepresentationsData Representations
Data Representationsbujols
 
Stem & leaf plots + histograms
Stem & leaf plots + histogramsStem & leaf plots + histograms
Stem & leaf plots + histogramsListeningDaisy
 
Finding Interquartile Range from Stem-Leaf Plot 1
Finding Interquartile Range from Stem-Leaf Plot 1Finding Interquartile Range from Stem-Leaf Plot 1
Finding Interquartile Range from Stem-Leaf Plot 1Moonie Kim
 
Sql delete, truncate, drop statements
Sql delete, truncate, drop statementsSql delete, truncate, drop statements
Sql delete, truncate, drop statementsVivek Singh
 
Stem and leaf plot
Stem and leaf plotStem and leaf plot
Stem and leaf plotbbeiers
 
Finding Interquartile Range from Stem-Leaf Plot 2
Finding Interquartile Range from Stem-Leaf Plot 2Finding Interquartile Range from Stem-Leaf Plot 2
Finding Interquartile Range from Stem-Leaf Plot 2Moonie Kim
 
Shape of distribution copy
Shape of distribution   copyShape of distribution   copy
Shape of distribution copymaryam kazemi
 
Skew or kurtosis
Skew or kurtosisSkew or kurtosis
Skew or kurtosisKen Plummer
 

Destaque (20)

Skewness
SkewnessSkewness
Skewness
 
Kurtosis
KurtosisKurtosis
Kurtosis
 
Skewness
SkewnessSkewness
Skewness
 
Skewness
SkewnessSkewness
Skewness
 
Skewness & Kurtosis
Skewness & KurtosisSkewness & Kurtosis
Skewness & Kurtosis
 
Finding the Mean from Grouped Frequency Table
Finding the Mean from Grouped Frequency TableFinding the Mean from Grouped Frequency Table
Finding the Mean from Grouped Frequency Table
 
Globalization is (not) God: Leadership Challenges for Civil Society Sectors
Globalization is (not) God: Leadership Challenges for Civil Society SectorsGlobalization is (not) God: Leadership Challenges for Civil Society Sectors
Globalization is (not) God: Leadership Challenges for Civil Society Sectors
 
Chapter03
Chapter03Chapter03
Chapter03
 
Ch4 notes for students
Ch4 notes for studentsCh4 notes for students
Ch4 notes for students
 
3. frequency distribution
3. frequency distribution3. frequency distribution
3. frequency distribution
 
Skewness
SkewnessSkewness
Skewness
 
Data Representations
Data RepresentationsData Representations
Data Representations
 
Stem & leaf plots + histograms
Stem & leaf plots + histogramsStem & leaf plots + histograms
Stem & leaf plots + histograms
 
Finding Interquartile Range from Stem-Leaf Plot 1
Finding Interquartile Range from Stem-Leaf Plot 1Finding Interquartile Range from Stem-Leaf Plot 1
Finding Interquartile Range from Stem-Leaf Plot 1
 
Kurtosis
KurtosisKurtosis
Kurtosis
 
Sql delete, truncate, drop statements
Sql delete, truncate, drop statementsSql delete, truncate, drop statements
Sql delete, truncate, drop statements
 
Stem and leaf plot
Stem and leaf plotStem and leaf plot
Stem and leaf plot
 
Finding Interquartile Range from Stem-Leaf Plot 2
Finding Interquartile Range from Stem-Leaf Plot 2Finding Interquartile Range from Stem-Leaf Plot 2
Finding Interquartile Range from Stem-Leaf Plot 2
 
Shape of distribution copy
Shape of distribution   copyShape of distribution   copy
Shape of distribution copy
 
Skew or kurtosis
Skew or kurtosisSkew or kurtosis
Skew or kurtosis
 

Mais de Passy World

Why Exponents are Important
Why Exponents are ImportantWhy Exponents are Important
Why Exponents are ImportantPassy World
 
Equations with Fractions on Both Sides
Equations with Fractions on Both SidesEquations with Fractions on Both Sides
Equations with Fractions on Both SidesPassy World
 
Equations with Variables on Both Sides
Equations with Variables on Both SidesEquations with Variables on Both Sides
Equations with Variables on Both SidesPassy World
 
Gradient of Straight Lines
Gradient of Straight LinesGradient of Straight Lines
Gradient of Straight LinesPassy World
 
Midpoint Between Two Points
Midpoint Between Two PointsMidpoint Between Two Points
Midpoint Between Two PointsPassy World
 
Back to Back S&L Plots
Back to Back S&L PlotsBack to Back S&L Plots
Back to Back S&L PlotsPassy World
 
Grouped Mean Median Mode
Grouped Mean Median ModeGrouped Mean Median Mode
Grouped Mean Median ModePassy World
 
The Tangent Ratio
The Tangent RatioThe Tangent Ratio
The Tangent RatioPassy World
 
The Cosine Ratio
The Cosine RatioThe Cosine Ratio
The Cosine RatioPassy World
 
Labeling Trigonometry Triangles
Labeling Trigonometry TrianglesLabeling Trigonometry Triangles
Labeling Trigonometry TrianglesPassy World
 
Similar Triangles II
Similar Triangles IISimilar Triangles II
Similar Triangles IIPassy World
 
Similar Triangles
Similar TrianglesSimilar Triangles
Similar TrianglesPassy World
 
Congruent Triangles
Congruent TrianglesCongruent Triangles
Congruent TrianglesPassy World
 
Factorising Common Factors
Factorising Common FactorsFactorising Common Factors
Factorising Common FactorsPassy World
 
Expanding Binomial Brackets
Expanding Binomial BracketsExpanding Binomial Brackets
Expanding Binomial BracketsPassy World
 
Rearranging Formulas
Rearranging FormulasRearranging Formulas
Rearranging FormulasPassy World
 
Significant Figures
Significant FiguresSignificant Figures
Significant FiguresPassy World
 

Mais de Passy World (20)

Why Exponents are Important
Why Exponents are ImportantWhy Exponents are Important
Why Exponents are Important
 
Exponents Rules
Exponents RulesExponents Rules
Exponents Rules
 
Equations with Fractions on Both Sides
Equations with Fractions on Both SidesEquations with Fractions on Both Sides
Equations with Fractions on Both Sides
 
Equations with Variables on Both Sides
Equations with Variables on Both SidesEquations with Variables on Both Sides
Equations with Variables on Both Sides
 
Gradient of Straight Lines
Gradient of Straight LinesGradient of Straight Lines
Gradient of Straight Lines
 
Midpoint Between Two Points
Midpoint Between Two PointsMidpoint Between Two Points
Midpoint Between Two Points
 
Linear Rules
Linear RulesLinear Rules
Linear Rules
 
Back to Back S&L Plots
Back to Back S&L PlotsBack to Back S&L Plots
Back to Back S&L Plots
 
Grouped Mean Median Mode
Grouped Mean Median ModeGrouped Mean Median Mode
Grouped Mean Median Mode
 
The Tangent Ratio
The Tangent RatioThe Tangent Ratio
The Tangent Ratio
 
The Cosine Ratio
The Cosine RatioThe Cosine Ratio
The Cosine Ratio
 
The Sine Ratio
The Sine RatioThe Sine Ratio
The Sine Ratio
 
Labeling Trigonometry Triangles
Labeling Trigonometry TrianglesLabeling Trigonometry Triangles
Labeling Trigonometry Triangles
 
Similar Triangles II
Similar Triangles IISimilar Triangles II
Similar Triangles II
 
Similar Triangles
Similar TrianglesSimilar Triangles
Similar Triangles
 
Congruent Triangles
Congruent TrianglesCongruent Triangles
Congruent Triangles
 
Factorising Common Factors
Factorising Common FactorsFactorising Common Factors
Factorising Common Factors
 
Expanding Binomial Brackets
Expanding Binomial BracketsExpanding Binomial Brackets
Expanding Binomial Brackets
 
Rearranging Formulas
Rearranging FormulasRearranging Formulas
Rearranging Formulas
 
Significant Figures
Significant FiguresSignificant Figures
Significant Figures
 

Último

The basics of sentences session 2pptx copy.pptx
The basics of sentences session 2pptx copy.pptxThe basics of sentences session 2pptx copy.pptx
The basics of sentences session 2pptx copy.pptxheathfieldcps1
 
Kisan Call Centre - To harness potential of ICT in Agriculture by answer farm...
Kisan Call Centre - To harness potential of ICT in Agriculture by answer farm...Kisan Call Centre - To harness potential of ICT in Agriculture by answer farm...
Kisan Call Centre - To harness potential of ICT in Agriculture by answer farm...Krashi Coaching
 
Nutritional Needs Presentation - HLTH 104
Nutritional Needs Presentation - HLTH 104Nutritional Needs Presentation - HLTH 104
Nutritional Needs Presentation - HLTH 104misteraugie
 
Grant Readiness 101 TechSoup and Remy Consulting
Grant Readiness 101 TechSoup and Remy ConsultingGrant Readiness 101 TechSoup and Remy Consulting
Grant Readiness 101 TechSoup and Remy ConsultingTechSoup
 
Paris 2024 Olympic Geographies - an activity
Paris 2024 Olympic Geographies - an activityParis 2024 Olympic Geographies - an activity
Paris 2024 Olympic Geographies - an activityGeoBlogs
 
Presentation by Andreas Schleicher Tackling the School Absenteeism Crisis 30 ...
Presentation by Andreas Schleicher Tackling the School Absenteeism Crisis 30 ...Presentation by Andreas Schleicher Tackling the School Absenteeism Crisis 30 ...
Presentation by Andreas Schleicher Tackling the School Absenteeism Crisis 30 ...EduSkills OECD
 
SOCIAL AND HISTORICAL CONTEXT - LFTVD.pptx
SOCIAL AND HISTORICAL CONTEXT - LFTVD.pptxSOCIAL AND HISTORICAL CONTEXT - LFTVD.pptx
SOCIAL AND HISTORICAL CONTEXT - LFTVD.pptxiammrhaywood
 
POINT- BIOCHEMISTRY SEM 2 ENZYMES UNIT 5.pptx
POINT- BIOCHEMISTRY SEM 2 ENZYMES UNIT 5.pptxPOINT- BIOCHEMISTRY SEM 2 ENZYMES UNIT 5.pptx
POINT- BIOCHEMISTRY SEM 2 ENZYMES UNIT 5.pptxSayali Powar
 
How to Make a Pirate ship Primary Education.pptx
How to Make a Pirate ship Primary Education.pptxHow to Make a Pirate ship Primary Education.pptx
How to Make a Pirate ship Primary Education.pptxmanuelaromero2013
 
Sanyam Choudhary Chemistry practical.pdf
Sanyam Choudhary Chemistry practical.pdfSanyam Choudhary Chemistry practical.pdf
Sanyam Choudhary Chemistry practical.pdfsanyamsingh5019
 
Interactive Powerpoint_How to Master effective communication
Interactive Powerpoint_How to Master effective communicationInteractive Powerpoint_How to Master effective communication
Interactive Powerpoint_How to Master effective communicationnomboosow
 
Web & Social Media Analytics Previous Year Question Paper.pdf
Web & Social Media Analytics Previous Year Question Paper.pdfWeb & Social Media Analytics Previous Year Question Paper.pdf
Web & Social Media Analytics Previous Year Question Paper.pdfJayanti Pande
 
Separation of Lanthanides/ Lanthanides and Actinides
Separation of Lanthanides/ Lanthanides and ActinidesSeparation of Lanthanides/ Lanthanides and Actinides
Separation of Lanthanides/ Lanthanides and ActinidesFatimaKhan178732
 
Accessible design: Minimum effort, maximum impact
Accessible design: Minimum effort, maximum impactAccessible design: Minimum effort, maximum impact
Accessible design: Minimum effort, maximum impactdawncurless
 
Advanced Views - Calendar View in Odoo 17
Advanced Views - Calendar View in Odoo 17Advanced Views - Calendar View in Odoo 17
Advanced Views - Calendar View in Odoo 17Celine George
 
18-04-UA_REPORT_MEDIALITERAСY_INDEX-DM_23-1-final-eng.pdf
18-04-UA_REPORT_MEDIALITERAСY_INDEX-DM_23-1-final-eng.pdf18-04-UA_REPORT_MEDIALITERAСY_INDEX-DM_23-1-final-eng.pdf
18-04-UA_REPORT_MEDIALITERAСY_INDEX-DM_23-1-final-eng.pdfssuser54595a
 
Hybridoma Technology ( Production , Purification , and Application )
Hybridoma Technology  ( Production , Purification , and Application  ) Hybridoma Technology  ( Production , Purification , and Application  )
Hybridoma Technology ( Production , Purification , and Application ) Sakshi Ghasle
 
Privatization and Disinvestment - Meaning, Objectives, Advantages and Disadva...
Privatization and Disinvestment - Meaning, Objectives, Advantages and Disadva...Privatization and Disinvestment - Meaning, Objectives, Advantages and Disadva...
Privatization and Disinvestment - Meaning, Objectives, Advantages and Disadva...RKavithamani
 
The Most Excellent Way | 1 Corinthians 13
The Most Excellent Way | 1 Corinthians 13The Most Excellent Way | 1 Corinthians 13
The Most Excellent Way | 1 Corinthians 13Steve Thomason
 

Último (20)

The basics of sentences session 2pptx copy.pptx
The basics of sentences session 2pptx copy.pptxThe basics of sentences session 2pptx copy.pptx
The basics of sentences session 2pptx copy.pptx
 
Kisan Call Centre - To harness potential of ICT in Agriculture by answer farm...
Kisan Call Centre - To harness potential of ICT in Agriculture by answer farm...Kisan Call Centre - To harness potential of ICT in Agriculture by answer farm...
Kisan Call Centre - To harness potential of ICT in Agriculture by answer farm...
 
Staff of Color (SOC) Retention Efforts DDSD
Staff of Color (SOC) Retention Efforts DDSDStaff of Color (SOC) Retention Efforts DDSD
Staff of Color (SOC) Retention Efforts DDSD
 
Nutritional Needs Presentation - HLTH 104
Nutritional Needs Presentation - HLTH 104Nutritional Needs Presentation - HLTH 104
Nutritional Needs Presentation - HLTH 104
 
Grant Readiness 101 TechSoup and Remy Consulting
Grant Readiness 101 TechSoup and Remy ConsultingGrant Readiness 101 TechSoup and Remy Consulting
Grant Readiness 101 TechSoup and Remy Consulting
 
Paris 2024 Olympic Geographies - an activity
Paris 2024 Olympic Geographies - an activityParis 2024 Olympic Geographies - an activity
Paris 2024 Olympic Geographies - an activity
 
Presentation by Andreas Schleicher Tackling the School Absenteeism Crisis 30 ...
Presentation by Andreas Schleicher Tackling the School Absenteeism Crisis 30 ...Presentation by Andreas Schleicher Tackling the School Absenteeism Crisis 30 ...
Presentation by Andreas Schleicher Tackling the School Absenteeism Crisis 30 ...
 
SOCIAL AND HISTORICAL CONTEXT - LFTVD.pptx
SOCIAL AND HISTORICAL CONTEXT - LFTVD.pptxSOCIAL AND HISTORICAL CONTEXT - LFTVD.pptx
SOCIAL AND HISTORICAL CONTEXT - LFTVD.pptx
 
POINT- BIOCHEMISTRY SEM 2 ENZYMES UNIT 5.pptx
POINT- BIOCHEMISTRY SEM 2 ENZYMES UNIT 5.pptxPOINT- BIOCHEMISTRY SEM 2 ENZYMES UNIT 5.pptx
POINT- BIOCHEMISTRY SEM 2 ENZYMES UNIT 5.pptx
 
How to Make a Pirate ship Primary Education.pptx
How to Make a Pirate ship Primary Education.pptxHow to Make a Pirate ship Primary Education.pptx
How to Make a Pirate ship Primary Education.pptx
 
Sanyam Choudhary Chemistry practical.pdf
Sanyam Choudhary Chemistry practical.pdfSanyam Choudhary Chemistry practical.pdf
Sanyam Choudhary Chemistry practical.pdf
 
Interactive Powerpoint_How to Master effective communication
Interactive Powerpoint_How to Master effective communicationInteractive Powerpoint_How to Master effective communication
Interactive Powerpoint_How to Master effective communication
 
Web & Social Media Analytics Previous Year Question Paper.pdf
Web & Social Media Analytics Previous Year Question Paper.pdfWeb & Social Media Analytics Previous Year Question Paper.pdf
Web & Social Media Analytics Previous Year Question Paper.pdf
 
Separation of Lanthanides/ Lanthanides and Actinides
Separation of Lanthanides/ Lanthanides and ActinidesSeparation of Lanthanides/ Lanthanides and Actinides
Separation of Lanthanides/ Lanthanides and Actinides
 
Accessible design: Minimum effort, maximum impact
Accessible design: Minimum effort, maximum impactAccessible design: Minimum effort, maximum impact
Accessible design: Minimum effort, maximum impact
 
Advanced Views - Calendar View in Odoo 17
Advanced Views - Calendar View in Odoo 17Advanced Views - Calendar View in Odoo 17
Advanced Views - Calendar View in Odoo 17
 
18-04-UA_REPORT_MEDIALITERAСY_INDEX-DM_23-1-final-eng.pdf
18-04-UA_REPORT_MEDIALITERAСY_INDEX-DM_23-1-final-eng.pdf18-04-UA_REPORT_MEDIALITERAСY_INDEX-DM_23-1-final-eng.pdf
18-04-UA_REPORT_MEDIALITERAСY_INDEX-DM_23-1-final-eng.pdf
 
Hybridoma Technology ( Production , Purification , and Application )
Hybridoma Technology  ( Production , Purification , and Application  ) Hybridoma Technology  ( Production , Purification , and Application  )
Hybridoma Technology ( Production , Purification , and Application )
 
Privatization and Disinvestment - Meaning, Objectives, Advantages and Disadva...
Privatization and Disinvestment - Meaning, Objectives, Advantages and Disadva...Privatization and Disinvestment - Meaning, Objectives, Advantages and Disadva...
Privatization and Disinvestment - Meaning, Objectives, Advantages and Disadva...
 
The Most Excellent Way | 1 Corinthians 13
The Most Excellent Way | 1 Corinthians 13The Most Excellent Way | 1 Corinthians 13
The Most Excellent Way | 1 Corinthians 13
 

Symmetry and Skew

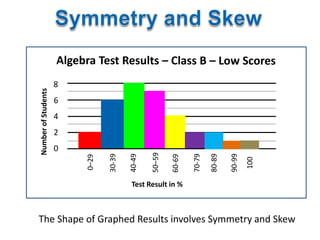
  • 1. 0–29 8 6 4 2 0 Test Result in % The Shape of Graphed Results involves Symmetry and Skew
  • 2. 0–29 8 6 4 2 0 Test Result in % There are a small number of students who have done well, which makes this Graph stretch out horizontally to the right. Going to the Right is Positive, so it has “Positive Skew”
  • 3. 0–29 8 6 4 2 0 Test Result in % The Kangaroo fits onto our graph with its tail going to the RIGHT. Going to the Right is Positive, so it has “Positive Skew”
  • 4. 0–29 8 6 4 2 0 Test Result in % This particular group has lots of Low scores and has not performed well. The Mode will be to the left of the Median, and the Mean to the right. Mode < Median < Mean
  • 5. 0–29 8 6 4 2 0 Test Result in % There are a small number of students who have done poorly, which makes this Graph stretch out horizontally to the left. Going to the Left is Negative, so it has “Negative Skew”
  • 6. 0–29 8 6 4 2 0 Test Result in % The Kangaroo fits onto our graph with its tail going to the LEFT. Going to the Left is Negative, so it has “Negative Skew”
  • 7. 0–29 8 6 4 2 0 Test Result in % This particular class has lots of High scores and has performed very well. The Mode will be to the right of the Median, and the Mean to the left. Mean < Median < Mode
  • 8. 0–29 8 6 4 2 0 Test Result in % This particular class is fairly normal and has both low and high scores. This graph stretches out evenly on both sides of the Mode at 60-69. The Graph is “Symmetrical”
  • 9. 0–29 8 6 4 2 0 Test Result in % Two identical Kangaroos show this graph is a mirror image type shape. The Graph is “Symmetrical”
  • 10. 0–29 8 6 4 2 0 Test Result in % This particular class is fairly normal and has both low and high scores. The Mean, Median, and Mode will all be close together in the middle. Mean ~ Median ~ Mode
  • 11. The Kangaroo fits onto our graph with its tail going to the RIGHT. Going to the Right is Positive, so it has “Positive Skew” Stem Leaf 0 1 1 2 4 7 8 1 2 2 3 5 6 6 8 9 2 1 5 6 7 7 8 8 9 9 9 3 2 4 4 5 7 7 8 4 1 3 5 8 5 2 3 7 6 2 3 4 7 2 6 8 3 9 2 Look at the S&L Plot sideways, and form a rotated 90 degrees view StemLeaf 0112478 122356689 21567788999 32445778 41358 5237 6234 726 83 92
  • 12. The Kangaroo fits onto our graph with its tail going to the LEFT. Going to the Left is Negative, so it has “Negative Skew” Stem Leaf 0 1 1 2 2 1 5 3 2 4 8 4 1 3 5 5 2 3 7 6 2 3 4 5 6 6 7 7 7 2 2 5 5 6 7 7 7 8 8 9 8 1 3 4 4 5 6 6 7 7 7 9 2 3 4 5 6 6 7 8 StemLeaf 01 12 215 3248 4135 5237 623456677 722556777889 81344566777 923456678 Look at the S&L Plot sideways to form a rotated 90 degrees view
  • 13. Stem Leaf 0 1 2 1 2 4 6 2 1 5 6 6 3 2 4 8 8 9 4 1 3 5 6 7 7 8 5 2 3 4 5 6 6 9 9 9 6 2 3 4 5 6 6 7 7 2 2 5 5 6 8 1 3 4 7 9 2 3 5 Look from the side of the S&L Plot and form a rotated 90 degrees view StemLeaf 012 1246 21566 324889 41356778 5234566999 62345667 722556 81347 9235 Two identical Kangaroos show this graph is a mirror image type shape. The S&L Plot is “Symmetrical”
  • 14. SYMMETRIC RIGHT LEFT DATA SKEWED SKEWED 3 7 3 58 3 0 4 36 4 013345569 4 5 5 017 5 2446 5 6 1120 6 17 6 2 7 356789 7 7 17 8 0158 8 2 8 2445 9 43 9 5 9 012235569 10 0 10 0 10 000