
Recomendados
Recomendados
Mais conteúdo relacionado
Mais procurados
Mais procurados (19)
Semelhante a Besier (2003)
Semelhante a Besier (2003) (20)
Mais de analisedecurvas
Mais de analisedecurvas (8)
Último
Último (20)
Besier (2003)
- 1. ARTICLE IN PRESS Journal of Biomechanics 36 (2003) 1159–1168 Repeatability of gait data using a functional hip joint centre and a mean helical knee axis Thor F. Besier, Daina L. Sturnieks, Jacque A. Alderson, David G. Lloyd* School of Human Movement and Exercise Science, University of Western Australia, 35 Stirling Highway, Crawley, WA 6907, Australia Accepted 7 February 2003 Abstract Repeatability of traditional kinematic and kinetic models is affected by the ability to accurately locate anatomical landmarks (ALs) to define joint centres and anatomical coordinate systems. Numerical methods that define joint centres and axes of rotation independent of ALs may also improve the repeatability of kinematic and kinetic data. The purpose of this paper was to compare the repeatability of gait data obtained from two models, one based on ALs (AL model), and the other incorporating a functional method to define hip joint centres and a mean helical axis to define knee joint flexion/extension axes (FUN model). A foot calibration rig was also developed to define the foot segment independent of ALs. The FUN model produced slightly more repeatable hip and knee joint kinematic and kinetic data than the AL model, with the advantage of not having to accurately locate ALs. Repeatability of the models was similar comparing within-tester sessions to between-tester sessions. The FUN model may also produce more repeatable data than the AL model in subject populations where location of ALs is difficult. The foot calibration rig employed in both the AL and FUN model provided an easy alternative to define the foot segment and obtain repeatable data, without accurately locating ALs on the foot. r 2003 Elsevier Science Ltd. All rights reserved. Keywords: Kinematics; Kinetics; Repeatability; Gait analysis 1. Introduction et al., 1999; Stagni et al., 2000). Errors associated with the imprecise location of ALs have been noted as the Efforts have been made to reduce errors associated greatest source of error in motion analysis, compared to with photogrammetric techniques and skin movement instrument error or skin movement artefact (Della artefacts during motion analysis, to accurately deter- Croce et al., 1997). These findings raise concerns mine the position and orientation of body segments. regarding the repeatability of models using ALs to Skin movement artefact has been shown to be reduced define an ACS, which from a clinical perspective, is of by employing a ‘CAST’ technique, whereby three or paramount importance. Methods to reduce any varia- more clusters of markers are placed on each segment to bility in locating ALs and defining the ACS therefore create technical coordinate systems (TCSs) (Cappozzo warrant investigation. et al., 1995). Anatomical landmarks (ALs) are then Numerical methods can be used to determine joint defined relative to the TCSs in a static trial to centres and axes of rotation relative to marker clusters, reconstruct an anatomical coordinate system (ACS) without the need to accurately locate ALs. Techniques during a dynamic trial (Cappozzo et al., 1995; Lucchetti have been previously established to estimate joint et al., 1998). However, imprecise location of ALs can centres for the hip (Cappozzo, 1984; Shea et al., 1997; lead to mislocation of the ACS and subsequent joint Leardini et al., 1999), and the shoulder (Stokdijk et al., centres, which propagates to errors in joint kinematics 2000), by moving the joint through a functional range of and kinetics (Holden and Stanhope, 1998; Della Croce motion, assuming a true ‘ball-and-socket’ articulation. Methods have also been developed to determine *Corresponding author. Tel.: +61-9-380-3919; fax: +61-9-380- ‘optimal’ axes or mean helical axes of rotation for the 1039. knee (Boyd and Ronsky, 1998; Churchill et al., 1998) E-mail address: dlloyd@cyllene.uwa.edu.au (D.G. Lloyd). ! and elbow (Cheze et al., 1998; Stokdijk et al., 1999) 0021-9290/03/$ - see front matter r 2003 Elsevier Science Ltd. All rights reserved. doi:10.1016/S0021-9290(03)00087-3
- 2. ARTICLE IN PRESS 1160 T.F. Besier et al. / Journal of Biomechanics 36 (2003) 1159–1168 throughout a dynamic range of motion. Defining joint Oxford, UK). Gait data were retrieved using custom centres and axes of rotation using these functional software and normalized to 51 points over stride using a methods may improve the repeatability of kinematic and cubic spline within MATLAB (Mathworks, Natick, kinetic data, compared to traditional methods that rely MA). on the accurate location of ALs to define an ACS. During each session, subjects walked at a self-selected The purpose of this paper was to compare within- pace (observed speeds were between 1.2 and 1.5 m/s) tester and between-tester repeatability of gait data using across an instrumented 10 m walkway. A minimum of two different methods of defining a lower limb ACS. six trials with successful force-plate strikes were The first model utilizes a functional hip joint centre captured for both left and right legs. In addition to the (HJC) and a mean helical axis of the knee (FUN model), walking trials, subjects performed a series of static and while the second model uses traditional ALs to define an dynamic calibration trials to locate ALs and estimate ACS (AL model). It was hypothesized that the FUN the location of the HJCs, knee joint centres (KJC) and lower limb model would demonstrate greater repeat- functional flexion/extension axes of each knee. ability of kinematic and kinetic gait data than an AL model for both between-tester and within-tester condi- tions. Furthermore, in an effort to reduce the error associated with locating ALs on the foot (Della Croce 2.3. Marker set and definitions of segment and joint et al., 1997), a new technique is demonstrated to define coordinate systems the orientation of the foot segment for gait analysis. To determine the three-dimensional position and orientation of each lower limb segment, clusters of three 2. Methods retro-reflective markers (20 mm) were firmly adhered to the subject’s pelvis, thighs, shank, and feet (Fig. 1B). A 2.1. Subjects TCS was defined using each thigh, shank, and foot segment cluster such that the ACS and joint centres Ten able-bodied subjects (6 males, 4 females; body could be defined relative to these TCSs. The pelvis, mass 55–89 kg; height 1.64–1.90 m) participated in the femoral, and tibial ACSs were defined the same as those study. Written informed consent was obtained prior to participation, as per requirement of the University of Western Australia ethics committee. Subjects had no current musculoskeletal injury or disease and were free of pain. 2.2. Gait analysis protocol Gait analyses were performed on each subject in the morning and afternoon of the same day. Two examiners performed separate gait analyses in the morning (for between-tester comparisons), and one of these exami- ners performed a repeat analysis in the afternoon, at least 4 h following the first session (for within-tester comparisons). This procedure resulted in three gait analyses for each subject. Five examiners in total were used, three of which performed the test–retest sessions for within-tester comparisons. A six-camera VICON motion analysis system (Oxford Metrics, Oxford, UK) was used in conjunction with two AMTI force-plates (AMTI, Watertown, MA) to collect motion data (50 Hz) and ground reaction force data (2000 Hz), respectively. Marker coordinate data were filtered using a GCVSPL routine (Woltring, 1986), which helped to reduce the error in reconstructing the helical axes parameters (de Lange et al., 1990) and in performing inverse dynamic calculations. The 7-segment Fig. 1. (A) Pointer device used to locate the medial and lateral FUN and AL kinematic/kinetic models were con- epicondyles of the femur. (B) ACSs of the lower limb model. Figure structed using BodyBuilder software (Oxford Metrics, produced using SIMM (Musculographics Inc., Evanston, IL).
- 3. ARTICLE IN PRESS T.F. Besier et al. / Journal of Biomechanics 36 (2003) 1159–1168 1161 used by Kadaba et al. (1989), although a new ACS was method from Spoor and Veldpaus (1980) and Rein- established for the foot. schmidt and van den Bogert (1997). A mean helical axis The pelvis ACS was defined using an origin midway was then calculated for each knee, analogous to the between the antero-superior iliac spines (ASISs), a method presented by Stokdijk et al. (1999) for the elbow positive z-axis along the line of the left ASIS to the joint. The mean helical axis was used to define the right ASIS, an x-axis along a line from the sacrum flexion/extension axis of the knee relative to the thigh marker to the origin (positive being anterior), and a TCS. The KJC in the FUN model was defined relative y-axis orthogonal to the x2z-plane (positive being to the mean helical axis, at a point along the helical axis superior) (Fig. 1B). that intersected a plane that was normal to the Two different methods were used to determine the transepicondylar line, midway between the epicondyles. HJCs. For the AL model, HJCs were defined relative to As such, the location of the ME and LE in the FUN the pelvis ACS and estimated using a regression model were only used to define the medial and lateral equation developed by Shea et al. (1997). For the side of the knee. The femoral ACS in the FUN model FUN model, a functional method similar to that used by was then defined similar to the AL model, except using Piazza et al. (2001) was employed, whereby subjects the FUN KJC and flexion/extension axis. were required to consecutively move the right and left The tibial ACS was determined using the position of thigh through a range of flexion, abduction, adduction, markers placed on the medial malleoli (MM) of the and extension (Piazza et al., 2001). These data were used tibiae and lateral malleoli (LM) of the fibulae, collected in a constrained optimization program written in during a static trial. Each tibial ACS was defined using MATLAB (Optimization Toolbox, Mathworks Inc.; an origin at the AJC (midway between the MM and Natick, MA), where spheres were fit to each thigh LM), a y-axis as the line passing from the AJC to the marker to find a left and right HJC location relative to KJC (positive being superior), a z-axis being along a the pelvis ACS (xp ; yp ; zp ) and sphere radii. An initial plane defined by the flexion/extension axis of the knee, estimation was obtained using the regression equation of and an x-axis orthogonal to the y2z-axes (positive being Shea et al. (1997) and the optimization was constrained anterior) (Fig. 1B). Subsequently, the tibial ACS was to be within a 100 mm cube surrounding this position. different for the AL and FUN models due to the The location of the initial estimate of the HJC respective difference in KJC and knee flexion/extension coordinates was randomly perturbed within the axis definitions. 100 mm cube during six consecutive optimizations to The foot segment was defined the same way for both avoid finding local minima. AL and FUN models. To overcome large errors in In four static trials, the position of the medial and palpating and placing markers on ALs of the foot (Della lateral femoral epicondyles (ME and LE, respectively) of Croce et al., 1997), an alignment rig was developed to each femur were measured. A pointer with five markers define the orientation of the foot segment (Fig. 2). A was used to locate the ME and LE, with marker TCS was defined for the alignment rig using four retro- redundancy used to reduce error in locating the end of reflective markers attached to the rig, such that any foot the pointer (Fig. 1A). The femoral ACS, KJCs, and knee flexion/extension axis were defined differently for the AL and FUN models. In the AL model, the femoral ACS was defined using an origin at the KJC (midway between the ME and LE), a y-axis as the line passing through the KJC to the HJC (positive being superior), a z-axis being along a plane defined by the ME and LE and orthogonal to the y-axis (positive pointing from left to right), and an x-axis orthogonal to the y2z-axes (positive being anterior) (Fig. 1B). For the FUN model, a mean helical axis was used to define the KJC and flexion/extension axis of each knee. To achieve this, subjects stood on one leg and flexed the contra-lateral thigh to enable the shank to freely flex and extend about the knee from full extension to B100 of flexion. This was performed for at least three cycles for each limb. Using the custom MATLAB program, the Fig. 2. Foot calibration rig and rig TCS. Note the goniometer beneath tibia markers were expressed in the femoral TCS and the subjects’ foot to measure foot progression (abduction/adduction) instantaneous helical axes calculated throughout the relative to yRIG. Rear-foot inversion/eversion was also taken whilst the range of motion using a singular value decomposition subject was on the rig using an inclinometer.
- 4. ARTICLE IN PRESS 1162 T.F. Besier et al. / Journal of Biomechanics 36 (2003) 1159–1168 measurements were made with respect to this coordinate mean gait variables of testing sessions 1–3, and 2–3, thus system (Fig. 2). The subject stood on the alignment rig giving an indication of the systematic error within tester in a comfortable stance with their heels against a small and between testers. metal plate at the rear of the rig. The long axis (x) of the Two-factor ANOVA’s (model type: AL or foot segment was assumed to be parallel to the x2z FUN Â examiner: within-tester or between-tester factor) (horizontal) plane of the rig coordinate system (Fig. 2). with repeated measures on subject were then used to It was assumed that the x-axis of the foot was rotated compare the CMD values and systematic error between around the rig y-axis. This rotation was measured using models and examiner conditions (po0:05). Tests were a goniometer fixed to the alignment rig (Fig. 2), which performed independently on data from each limb. was defined by the line bisecting the calcaneus and the midpoint between the 2nd and 3rd metatarsal heads. The foot was then assumed to be rotated in inversion/ 3. Results eversion about the x-axis of the foot, which was a rear- foot angle measured relative to the x À z plane of the rig, 3.1. Joint kinematics perpendicular to the x-axis of the foot. This rear-foot inversion/eversion angle was taken using an inclin- Both AL and FUN models produced highly repea- ometer (Dasco Pro Inc., Rochford, IL). These sequences table sagittal plane kinematic data with r2 0:85 (Table of rotations, in accordance with the ISB standard (Wu 1). Frontal plane kinematics were highly repeatable for and Cavanagh, 1995), were used to define the foot ACS, the hip joint (r2 0:85), moderately repeatable for the from which two virtual markers were then created and knee (r2 between 0.54 and 0.74) and less repeatable for expressed relative to the foot TCS (Fig. 2). In subse- the ankle (r2 0:42). Rotations in the transverse plane quent dynamic trials, the calcaneus-marker and the two were quite repeatable at the knee (r2 0:64) and ankle virtual markers were used to define the foot ACS. (r2 0:53) and less repeatable at the hip (r2 between 0.28 The convention used to describe the kinematics of the and 0.47). hip, knee, and ankle joints followed the ISB standard There were no significant interactions between model (Wu and Cavanagh, 1995). The sequence of rotations type and examiner conditions, except for left knee was: flexion/extension about the z-axis of the proximal internal rotation kinematics of the left leg. This segment; then adduction/abduction about a floating generally suggests that repeatability of the gait data x-axis; followed by internal/external rotation about the was independent of the examiner administering the test y-axis of the distal segment. Joint kinetics were (Tables 1 and 2). expressed in the ACS of the distal segment. The FUN model demonstrated better repeatability in frontal plane knee kinematics than the AL model, with 2.4. Statistics an average r2 of 0.73 compared to 0.57 (Table 1), although this result was only significant for the Coefficients of Multiple Determination (CMD or r2 ; comparison of the right leg (po0:05). Similarly, the Kadaba et al., 1989) were calculated between testing FUN model produced greater repeatability of internal/ sessions 1–3, 1–2, and 2–3 using time normalized external rotation of the knee compared to the AL model kinematic and kinetic curves. The CMD was reported, (mean r2 of 0.74 and 0.67, respectively), but did not as opposed to the Coefficient of Multiple Correlation reach significance for individual limb comparisons (CMC, or r), as an r2 value indirectly refers to the (Table 1). percentage variance accounted for within the data. In Repeatability of ankle joint kinematic and kinetic this fashion, repeatability of each model was measured, data was similar within tester and between testers, for between testers and within tester. both AL and FUN models (Tables 1 and 2), which was The systematic error of the two models was deter- expected as the calibration rig was used to define the mined similar to the ‘static daily offset’ calculated by foot segment for both models. Ankle dorsi/plantar Kadaba et al. (1989) and Growney et al. (1997), which flexion angles were most repeatable with a mean r2 of occurs due to the re-application of markers. This error 0.89, whereas ankle inversion/eversion and abduction/ term was calculated using the following: adduction angles were moderately repeatable, with mean r2 of 0.47 and 0.59, respectively. 1 X pffiffiffiffiffiffiffiffiffiffiffiffiffiffiffiffiffiffiffiffiffiffiffi N ffi systematic error ¼ ðx1n À x2n Þ; N n¼1 3.2. Joint moments where N is the number of datapoints, x1n is the mean of Sagittal plane moment data were highly repeatable for variable x at time point n from testing session 1, x2n is the hip, knee, and ankle, with CMD’s ranging from 0.81 the mean of variable x at time point n from testing to 0.97 (Table 2). Hip and knee joint moments in the session 2. This error term was also calculated using the frontal plane were also very repeatable with r2 values
- 5. ARTICLE IN PRESS T.F. Besier et al. / Journal of Biomechanics 36 (2003) 1159–1168 1163 Table 1 Coefficients of multiple determination (CMD, r2 ) of kinematic data using both anatomical landmark (AL) and functional (FUN) models Joint angle AL (left) FUN (left) AL (right) FUN (right) CMD between testers Hip flexion/extension 0.94470.030 0.95070.027 0.95770.021 0.96270.016 Knee flexion/extension 0.93970.032 0.94570.032 0.96270.021 0.96470.021 Ankle dorsi/plantar flexion 0.85570.046 0.86170.046 0.89570.030 0.90270.027 Hip abduction/adduction 0.84670.078 0.84870.094 0.86270.050 0.88170.038 Knee varus/valgus 0.63570.272 0.60670.252 0.54170.205* 0.74270.166 Ankle abduction/adduction 0.49970.240 0.50570.245 0.48770.259 0.42170.249 Hip internal/external rotn 0.35170.227 0.35470.261 0.37470.228 0.33270.210 Knee internal/external rotn 0.71370.133 0.69970.159 0.68770.164 0.76470.149 Ankle inversion/eversion 0.59270.190 0.53970.197 0.63470.194 0.57770.221 CMD within tester Hip flexion/extension 0.95070.038 0.95670.032 0.96770.014 0.96970.013 Knee flexion/extension 0.92670.046 0.93470.042 0.96170.025 0.96270.026 Ankle dorsi/plantar flexion 0.84870.070 0.86970.057 0.90070.040 0.89870.038 Hip abduction/adduction 0.87170.056 0.85170.077 0.84670.089 0.86870.069 Knee varus/valgus 0.64270.254 0.67970.159 0.58970.156* 0.71470.238 Ankle abduction/adduction 0.49570.277 0.46370.225 0.44370.294 0.48470.238 Hip internal/external rotn 0.38670.160 0.39770.301 0.28070.202 0.46570.230 Knee internal/external rotn 0.68670.138 0.76470.093 0.63770.209 0.72070.212 Ankle inversion/eversion 0.56170.237 0.53170.229 0.66970.171 0.61170.210 Note: Significant differences between AL and FUN model are denoted by *(po0:05). Table 2 Coefficients of Multiple Determination (CMD, r2 ) of joint moment data using both Anatomical Landmark (AL) and Functional (FUN) models Joint moment AL (left) FUN (left) AL (right) FUN (right) CMD between testers Hip flexion/extension 0.89670.036 0.89570.048 0.91870.032 0.91970.027 Knee flexion/extension 0.81070.111 0.81570.068 0.82170.082 0.83770.084 Ankle dorsi/plantar flexion 0.95170.024 0.95170.024 0.96870.010 0.96870.010 Hip abduction/adduction 0.88570.042* 0.90470.044 0.89970.036* 0.93370.020 Knee varus/valgus 0.82670.090 0.80170.125 0.80470.096 0.76970.149 Ankle abduction/adduction 0.36570.236 0.37170.240 0.53470.269 0.53570.269 Hip internal/external rotn 0.62170.131 0.64370.127 0.68370.081 0.71170.084 Knee internal/external rotn 0.74770.097 0.73670.096 0.76370.126 0.74870.135 Ankle inversion/eversion 0.62270.242 0.62470.240 0.70470.193 0.70470.193 CMD within tester Hip flexion/extension 0.88770.039 0.90370.028 0.91670.027 0.92070.022 Knee flexion/extension 0.81070.103 0.83170.062 0.81370.095 0.82370.091 Ankle dorsi/plantar flexion 0.94570.025 0.94670.026 0.96470.013 0.96470.013 Hip abduction/adduction 0.85770.066* 0.91070.032 0.90670.025* 0.93770.013 Knee varus/valgus 0.78770.097 0.80070.120 0.79270.077 0.75070.105 Ankle abduction/adduction 0.32570.213 0.33870.216 0.55870.175 0.55770.177 Hip internal/external rotn 0.62170.131 0.65270.122 0.66670.082 0.70170.074 Knee internal/external rotn 0.72070.090 0.71770.095 0.73170.118 0.71070.128 Ankle inversion/eversion 0.63370.226 0.63970.231 0.70570.261 0.70370.260 Note: Significant differences between AL and FUN models are denoted by *(po0:05). ranging between 0.75 and 0.94. Internal/external rota- The FUN model produced more repeatable hip tion moments at the hip and knee were slightly less moments than the AL model in the frontal plane, both repeatable than ab/adduction moments, with mean r2 of between testers and within tester (FUN r2 ¼ 0:92; AL 0.66 and 0.73 Ankle joint moments had similar r2 ¼ 0:89; po0:05) (Table 2). The FUN model also repeatability to the hip and knee joint for inversion/ produced slightly more repeatable hip moments than the eversion, with a mean r2 of 0.67, but displayed less AL model in the transverse plane (mean r2 of 0.68 and repeatability abduction/adduction moments (mean r2 of 0.65, respectively), although these were not statistically 0.48, Table 2). significant. As expected, ankle joint moments displayed
- 6. ARTICLE IN PRESS 1164 T.F. Besier et al. / Journal of Biomechanics 36 (2003) 1159–1168 similar repeatability between models, within tester and models may explain the low repeatability in non-sagittal between testers. plane data compared to the AL and FUN model Although the curves were repeatable for both the AL presented here. An investigation is currently underway and FUN models, differences in the magnitude of the to directly compare the model employed by Kadaba kinematic and kinetic data collected with both models et al. (1989) and Growney et al. (1997) with the current were observed (Figs. 3 and 4). These differences were models. due to the altered location of the hip and KJCs and axes With regard to the accuracy of frontal and transverse of rotation between models, and mostly affected data in plane rotations using these two models, it is difficult to the frontal and transverse plane. The magnitude of the ascertain whether our results reflect the repeatability of ankle joint moments were not affected by the model segmental rotations, or the repeatability of motion employed (Fig. 4). artefact, for example, due to skin movement from The systematic error due to the re-application of underlying muscle activation or impact loading of the markers was similar for both AL and FUN models, with foot at heel strike. However, the knee varus/valgus an average difference of B3.8 and B0.03 Nm/kg angles from both models compare favourably to that of between testing sessions for joint angle and moment Lafortune et al. (1992), who used high speed motion data, respectively. Systematic error within tester was capture and cortical pins embedded within the femur similar to the error between testers (Figs. 3 and 4). and tibia to measure knee joint rotations (see dashed lines in Fig. 3). Knee internal/external rotation kine- matics were also similar in shape to that of Lafortune 4. Discussion et al. (1992), although a difference in the ACS used by us and Lafortune et al. (1992) may be responsible for the It was hypothesized that the numerical definition of obvious offset (Fig. 3). The difference in the ACSs may joint centres and axes of rotation in the FUN model have also caused our models internal/external and would improve the repeatability of kinematic and varus/valgus rotations during swing to be slightly larger kinetic data, compared to traditional methods that rely than that reported by Lafortune et al. (1992), possibly on the location of ALs to define joint centres and axes of due to cross-talk from knee flexion/extension (Piazza rotation (AL model). This hypothesis was tested using and Cavanagh, 2000). Skin movement may also be within-tester and between-tester conditions. Further- responsible for these differences. Similar effects may be more, in an effort to reduce the error associated with evident in the frontal and transverse plane rotations at locating ALs on the foot (Della Croce et al., 1997), a the hip and ankle joints. new technique to define the orientation of the foot The FUN model produced slightly more repeatable segment was investigated. gait curves than the AL model, in knee joint kinematics Both models presented in this paper produced highly and hip joint moments, thus supporting the hypothesis repeatable frontal and transverse plane kinematic data of this study. However, the differences in repeatability compared to previous studies (Kadaba et al., 1989; between the AL and FUN model were not as Growney et al., 1997). For example, Kadaba et al. predominant as expected. The FUN model was also (1989) and Growney et al. (1997) reported between-day expected to be more repeatable than the AL model in CMD values of B0.40 for knee varus/valgus and B0.24 the between-tester condition, as the FUN model is not for knee internal/external rotation angles. Repeatability as reliant upon accurate location of ALs to define joint of hip internal/external rotation angles measured centres and axes of rotation. However, the AL and FUN between-days by Kadaba et al. (1989) and Growney models produced similar repeatability of gait data et al. (1997) were also low, with average r2 of 0.2 and within tester as they did between testers (r2 and 0.42, respectively. Reasons for such low between-day systematic error), suggesting that both models produce repeatability of non-sagittal plane angles included skin repeatable results, regardless of whether the same movement artefact and marker re-application, coupled examiner performs the test–retest gait analysis. with the effects of ‘downstream’ errors associated with Several factors might explain the similarities in the Euler angle calculations (Growney et al., 1997). The use repeatability of gait data between the AL and FUN of marker clusters in the AL and FUN model appears to model, and the repeatability of each model, within tester improve the repeatability of non-sagittal plane kine- and between testers. Perhaps most importantly, the matic data, which may be partly due to reduced skin examiners performing the gait analyses in this study movement artefact. Furthermore, the AL and FUN were all very experienced in locating lower limb ALs, model do not appear to have the same propensity for such as the ASISs of the pelvis and epicondyles of the error from marker re-application as the model of femur. An interesting analysis would be to compare the Kadaba et al. (1989) and Growney et al. (1997). The gait data from both models collected by an experienced use of mid-segment markers to define joint centres and and a novice examiner. Similar gait data would be axes of rotation for the knee and ankle in previous expected between-examiners using the FUN model,
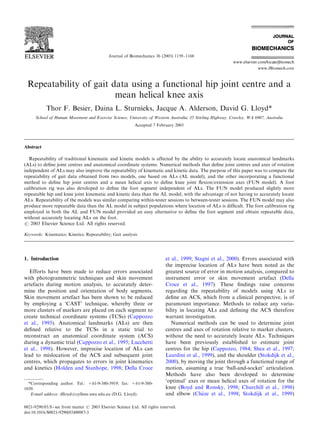
- 7. 50 25 10 Flexion Adduction 3.9˚ 2.1˚ Internal Rotation 7.2˚ 40 20 5 30 15 0 0 20 40 60 80 100 20 10 -5 Hip 10 5 -10 0 0 -15 0 20 40 60 80 100 0 20 40 60 80 100 -10 -5 -20 Extension Abduction External Rotation -20 -10 -25 80 30 30 Flexion Varus 3.7˚ Internal Rotation 3.3˚ 3.5˚ 20 20 60 10 10 40 0 0 Knee 20 0 20 40 60 80 100 0 20 40 60 80 100 -10 -10 0 -20 -20 Joint Angle (deg) 0 20 40 60 80 100 Extension Valgus External Rotation -20 -30 -30 20 20 20 Dorsi Flexion 2.1˚ 3.5˚ Inversion 7.2˚ ARTICLE IN PRESS Adduction 15 15 15 10 10 10 5 5 5 0 0 0 Ankle T.F. Besier et al. / Journal of Biomechanics 36 (2003) 1159–1168 0 20 40 60 80 100 0 20 40 60 80 100 0 20 40 60 80 100 -5 -5 -5 -10 -10 -10 -15 -15 -15 Plantar Flexion Abduction Eversion -20 -20 -20 FUN Heel Strike Toe Off Heel Strike Toe Off Heel Strike Toe Off AL Percentage Stride Lafortune et al. (1992) Fig. 3. Typical joint kinematic data obtained from a single gait analysis session using both AL and Optimized (FUN) joint models. The number on each graph indicates the average systematic error (in degrees) between gait sessions (between testers and within tester) of both models. 1165
- 8. 0.8 0.2 0.2 1166 Flexion Adduction 0.053 0.043 Internal Rotation 0.027 0.6 0.1 0.15 0.4 0 0.1 0 20 40 60 80 100 0.2 -0.1 0.05 0 -0.2 0 Hip 0 20 40 60 80 100 0 20 40 60 80 100 -0.2 -0.3 -0.05 -0.4 -0.4 -0.1 -0.6 -0.5 -0.15 Extension Abduction External Rotation -0.8 -0.6 -0.2 0.4 0.1 0.06 Flexion 0.04 Varus 0.033 Internal Rotation 0.01 0.3 0.05 0.04 0.2 0 0.02 0 20 40 60 80 100 0.1 -0.05 0 0 20 40 60 80 100 0 -0.1 -0.02 Knee 0 20 40 60 80 100 -0.1 -0.15 -0.04 -0.2 -0.2 -0.06 -0.3 -0.25 -0.08 Extension Valgus External Rotation -0.4 -0.3 -0.1 0.2 0.05 0.06 ARTICLE IN PRESS Dorsi Flexion 0.029 Adduction 0.013 Inversion 0.015 Internal Joint Moment (Nm/kg) 0 0.04 0.04 0 20 40 60 80 100 0.02 -0.2 0.03 0 -0.4 T.F. Besier et al. / Journal of Biomechanics 36 (2003) 1159–1168 0.02 0 20 40 60 80 100 Ankle -0.02 -0.6 0.01 -0.04 -0.8 0 -0.06 Plantar Flexion 0 20 40 60 80 100 Eversion -1 -0.01 Abduction -0.08 Heel Strike Toe Off Heel Strike Toe Off Heel Strike Toe Off FUN AL Percentage Stride Fig. 4. Typical joint moment data obtained from a single gait analysis session using both AL and Optimized (FUN) joint models. The number on each graph indicates the average systematic error (in Nm/kg) between gait sessions (between testers and within tester) of both models.
- 9. ARTICLE IN PRESS T.F. Besier et al. / Journal of Biomechanics 36 (2003) 1159–1168 1167 whereas incorrect location of ALs might lead to to describe motion of one segment relative to another, significant differences in the gait data between-exam- care should be taken when using it to describe iners using the AL model. Furthermore, the subjects in pathological joint motion. Abnormal knee kinematics, this study were young and healthy, with minimal body for example, may not be easily identified from time fat, which would improve the ability to locate ALs, histories of knee joint angles using a mean helical axis, particularly on the pelvis. In subject populations where as the orientation of the helical axis may change relative palpation of pelvis ALs becomes difficult, the FUN to the anatomy. model would be expected to produce more repeatable In summary, both models produced highly repeatable gait data than the AL model between testing sessions, as lower limb gait data compared to previous models it does not rely on the accurate location of pelvis (Kadaba et al., 1989; Growney et al., 1997). The FUN markers to define the HJCs. The FUN model might also model produced slightly more repeatable kinematic and produce more repeatable knee joint kinematics and kinetic data than the AL model, with the advantage of kinetics than the AL model in subjects who have bony not having to accurately locate bony landmarks. deformities of the knee joint, where location of the Improved repeatability of the FUN model compared epicondyles of the femur might prove difficult. to the AL model might be more pronounced with Della Croce et al. (1997) suggested that the largest examiners who are less experienced, in overweight error in locating ALs of the lower limb occur at the foot, subject populations, where location of bony landmarks which might have a negative effect on the repeatability becomes more difficult, or with subjects who have large of ankle kinematic and kinetic data. Using ALs to define bony deformities at the knee. These issues require the foot segment, Growney et al. (1997) reported an further investigation. The foot calibration rig provides average CMD of 0.41 for ankle inversion/eversion an easy alternative to define the foot segment, without angles and 0.23 for ankle abduction/adduction angles. accurately locating ALs of the foot, producing repeat- Hence, the foot calibration rig was developed to define able results. the foot segment using clinical measures of rear-foot inversion/eversion, and foot abduction/adduction, rather than relying on the accurate location of ALs. Acknowledgements Using the calibration rig to define the foot segment resulted in much higher r2 values than those reported We would like to acknowledge the financial support previously (Growney et al., 1997) for ankle inversion/ of the Australian Football League (AFL) and the eversion and abduction/adduction angles and moments. Australian National Health and Medical Research Although the repeatability of the waveform data and Council (NHMRC, ID# 991134). systematic error were quite similar between AL and FUN models, differences in the magnitude of the joint angle and moment data (offsets) were still observed References (Figs. 3 and 4). These were due to the different locations of the hip and KJCs in each model, and the different Boyd, S.K., Ronsky, J.L., 1998. Instantaneous moment arm determi- flexion/extension axes defined for the knee joint. The nation of the cat knee. Journal of Biomechanics 31, 279–283. Cappozzo, A., 1984. Gait analysis methodology. Human Movement question must then be asked, which model provides the Science 3, 27–54. most clinically representative data? Previous investiga- Cappozzo, A., Catani, F., Della Croce, U., Leardini, A., 1995. Position tions have shown the functional method of locating and orientation in space of bones during movement: anatomical HJCs to be superior to definitions based on regression frame definition and determination. Clinical Biomechanics 10, equations or models of ‘best-fit’ (Leardini et al., 1999). 171–178. Therefore, the FUN model is likely to provide more Ch ze, L., Fregly, B.J., Dimnet, J., 1998. Determination of joint e functional axes from noisy marker data using the finite helical axis. accurate HJCs compared to the AL model. It is more Human Movement Science 17, 1–15. difficult to ascertain the differences between the knee Churchill, D.L., Incavo, S.J., Johnson, C.C., Beynnon, B.D., 1998. flexion/extension axes defined by the transepicondylar The transepicondylar axis approximates the optimal flexion axis axis or a mean helical axis. Churchill et al. (1998) found of the knee. Clinical Orthopaedics and Related Research 356, no difference between an ‘optimal’ knee flexion/exten- 111–118. de Lange, A., Huiskes, R., Kauer, J.M.G., 1990. Effects of data sion axis and the transepicondylar axis, which would smoothing on the reconstruction of helical axis parameters in suggest that either model of defining the knee axis would human joint kinematics. Journal of Biomechanical Engineering produce similar kinematic and kinetic data. However, 112, 107–113. the definition of the transepicondylar axis requires the Della Croce, U., Cappozzo, A., Kerrigan, D.C., Lucchetti, L., 1997. Bone position and orientation errors: pelvis and lower limb accurate location of the epicondyles of the femur, which anatomical landmark identification reliability. Gait Posture 5, may be problematic given inexperienced examiners or 156–157. knees with bony deformities. Although the helical axis Della Croce, U., Cappozzo, A., Kerrigan, D.C., 1999. Pelvis and provides an accurate and convenient frame of reference lower limb anatomical landmark calibration precision and its
- 10. ARTICLE IN PRESS 1168 T.F. Besier et al. / Journal of Biomechanics 36 (2003) 1159–1168 propagation to bone geometry and joint angles. Medical motion and varied implementation. Journal of Biomechanics 34, Biological Engineering Computing 37, 155–161. 967–973. Growney, E., Meglan, D., Johnson, M., Cahalan, T., An, K., 1997. Reinschmidt, C., van den Bogert, T., 1997. KineMat: a MATLAB Repeated measures of adult normal walking using a video tracking Toolbox for Three-Dimensional Kinematic Analyses. Human system. Gait Posture 6, 147–162. Performance Laboratory, Calgary. Holden, J.P., Stanhope, S.J., 1998. The effect of variation in knee Shea, K.M., Lenhoff, M.W., Otis, J.C., Backus, S.I., 1997. Validation center location estimates on net knee joint moments. Gait of a method for location of the hip joint center. Gait Posture 5, Posture 7, 1–6. 157–158. Kadaba, M.P., Ramakrishnan, H.K., Wootten, M.E., Gainey, J., Spoor, C.W., Veldpaus, F.E., 1980. Rigid body motion calculated Gorton, G., Cochran, G.V., 1989. Repeatability of kinematic, from spatial coordinates of markers. Journal of Biomechanics 13, kinetic, and electromyographic data in normal adult gait. Journal 391–393. of Orthopaedic Research 7, 849–860. Stagni, R., Leardini, A., Cappozzo, A., Grazia, B.M., Cappello, A., Lafortune, M.A., Cavanagh, P.R., Sommer, H.J., Kalenak, A., 1992. 2000. Effects of hip joint centre mislocation on gait analysis results. Three-dimensional kinematics of the human knee during walking. Journal of Biomechanics 33, 1479–1487. Journal of Biomechanics 25, 347–357. Stokdijk, M., Meskers, C.G., Veeger, H.E., de Boer, Y.A., Leardini, A., Cappozzo, A., Catani, F., Toksvig-Larsen, S., Petitto, A., Rozing, P.M., 1999. Determination of the optimal elbow axis for Sforza, V., Cassanelli, G., Giannini, S., 1999. Validation of a evaluation of placement of prostheses. Clinical Biomechanics 14, functional method for the estimation of hip joint centre location. 177–184. Journal of Biomechanics 32, 99–103. Stokdijk, M., Nagels, J., Rozing, P.M., 2000. The glenohumeral Lucchetti, L., Cappozzo, A., Cappello, A., Della Croce, U., 1998. Skin joint rotation centre in vivo. Journal of Biomechanics 33, movement artefact assessment and compensation in the estimation 1629–1636. of knee-joint kinematics. Journal of Biomechanics 31, 977–984. Woltring, H.J., 1986. A Fortran package for generalized, cross- Piazza, S.J., Cavanagh, P.R., 2000. Measurement of the screw-home validatory spline smoothing and differentiation. Advanced En- motion of the knee is sensitive to errors in axis alignment. Journal gineering Software 8, 104–113. of Biomechanics 33, 1029–1034. Wu, G., Cavanagh, P.R., 1995. ISB recommendations for standardiza- Piazza, S.J., Okita, N., Cavanagh, P.R., 2001. Accuracy of the tion in the reporting of kinematic data. Journal of Biomechanics functional method of hip joint center location: effects of limited 28, 1257–1261.