SlideShare uma empresa Scribd logo
1 de 26
Baixar para ler offline
VINODH MADHAVAN & HENRY (HANK) PRUDEN

IFTA JOURNAL

IMPLICATIONS FOR RISK MANAGEMENT AND REGULATION: A STUDY OF
LONG-TERM DEPENDENCE IN CREDIT DEFAULT SWAP (CDS) INDICES
MARKET
Vinodh Madhavan, D.B.A.
Malcolm S.M Watts III Research Fellow, Technical Securities Analysts Association of San Francisco

Henry (Hank) Pruden, Ph.D.
President, Technical Security Analysts Association of San Francisco
Russell T. Sharpe Professor of Business, Golden Gate University, San Francisco.

"There is nothing either good or bad, but thinking makes it so"
William Shakespeare
Hamlet, Prince of Denmark
Credit Default Swaps, as the name indicates, are credit instruments used by banks, non- banking
financial institutions, hedge funds and investors, so as to shift risk from one party to another
(Mengle, 2007). These instruments are rife with controversy and opposing arguments with regard to
pertinent regulatory standards aimed at ensuring requisite checks and balances in the system. The
authors of this study do not wish to take sides in such arguments. Rather, the authors wish to shed
light upon the nature and degree of market risk inherent in CDS instruments, and hence help
regulators to calculate the level of regulatory reserves that ought to be mandated to avert extreme
disasters or meltdowns in the future. In other words, the authors wish to ascertain how high a dam
of dollar reserves ought to be constructed to avoid the equivalent of a 100 year flood. If the
Page 1 of 26
VINODH MADHAVAN & HENRY (HANK) PRUDEN

IFTA JOURNAL

underlying behavioral patterns of the CDS markets mimic a coin toss, then successful change in
spread levels are independent of one another. Consequently, the level of regulatory reserves can be
much less, as opposed to a scenario wherein the underlying behavioral dynamics of CDS markets are
characterized by fat-tailed distribution and long-term dependence. Long memory, or long-term
dependence, describes the correlation structure of a series at long lags. If a series exhibits long-term
dependence, it reflects persistent temporal dependence even between distant observations
(Barkoulas & Baum, 1996). Presence of high long-term dependence calls for draconian regulation.
The empirical issue being dealt-with in this study is akin to questions encountered in hydrology. In
hydrology, the key question is “How high a dam should we build?” The celebrated answer to the
question in the world of hydrology is associated with an Englishman named Harold Edwin Hurst
(Hurst, 1951), who undertook path-breaking studies of the river Nile in the 20th century for the
purpose of informing the British Government of how high a dam should they build at Aswan, Egypt
to control the floods during extremely wet years and at the same time create reservoirs of water for
irrigation during years of drought. Hurst discovered that the true behavior of river Nile exhibited a
power law, as opposed to a simple coin toss.
Traditional models in hydrology assumed precipitation to be random and Gaussian in nature.
Gaussian distribution implies that the precipitation levels follow the normal probability distribution,
with successive years‟ precipitations either mutually independent or with a short memory.
Independence implies that a large precipitation level in one year has no aftereffect on the following
years, while “short memory” process implies that after-effects die within few years. Gaussian
models, underestimated the durations of the longest drought or the intensity of floods in a shorttime. Long periods of drought can be extremely long, while the extreme levels of precipitation can
be so extreme that they change the average precipitation level of the whole time period within which
the extreme precipitation event falls (Mandelbrot & Wallis, 1968).

Page 2 of 26
VINODH MADHAVAN & HENRY (HANK) PRUDEN

IFTA JOURNAL

Mandelbrot and his co-authors (Mandelbrot, 1972; Mandelbrot & Wallis, 1969; Wallis & Matalas,
1970) refined the concepts and techniques created by Hurst, and applied them to financial markets.
In doing so, Mandelbrot, his followers, and critics discovered behavior in financial markets that
ranged from near-Gaussian phenomena to extremely one-sided fat-tailed distributions. Mandelbrot‟s
refinement of Hurst‟s original methodological contribution is referred to as the “Classical R/S
method” in the literature. In honor of Hurst, Mandelbrot labeled the long-term dependence
coefficient of any time series as H. Employment of Classical R/S method, also known as rescaled
range estimation technique, on a Gaussian distribution would yield an H value of 0.50. H value of
0.50 < H < 1 reflects positive long-term dependence in the time series, while 0 < H < 0.50 implies
anti-persistence phenomenon in the time series. Positive long-term dependence implies that a larger
price-point/spread level is likely to be followed by large price-point/spread level, while antipersistence behavior implies that larger price-point/spread level is bound to be followed by a small
price-point/spread level.
The authors‟ arguments pertaining to the proper level of regulatory reserves needed to guard against
extreme hazards in CDS markets are based on the following table, that lists the different securities
and their respective H values based on available empirical data (Mandelbrot & Hudson, 2004, p.
192)
Table 1: Classical R/S Analysis of Individual Stocks
S&P 500
IBM
Xerox
Apple
Coca-Cola
Anheuser-Busch
McDonald's
Niagara Mohawk

Page 3 of 26

H value
0.78
0.72
0.73
0.75
0.70
0.64
0.65
0.69
VINODH MADHAVAN & HENRY (HANK) PRUDEN

IFTA JOURNAL

Texas State Utilities
0.54
Consolidated Edison
0.68
Source: Peters, 1991, p. 88
As seen later in this study, the findings revealed H values of 0.56 and 0.58 pertaining to American
and European CDS indices datasets respectively. Put differently, despite the non-Gaussian nature of
CDS indices, long-term dependence in CDS indices are closer to the relatively sedate behavior of
utility stocks, like Texas State utilities as seen in the above table. Further, the H values pertaining to
CDS indices are far below the H levels pertaining to hi-tech stocks such as Apple and IBM.
To arrive at the foregoing conclusion, the authors wish to take the readers through their study of
empirical data collected by Dr. Madhavan on American (CDX.NA.IG) and European
(iTraxx.Europe) CDS Indices (Madhavan, 2009). These dissertation datasets were then subjected to
Classical R/S analysis to ascertain their H values using methodology employed by Mulligan
(Mulligan, 2000).
To sum up, this paper is aimed at analyzing the long-term dependence in Investment grade Credit
Default Swap (CDS) indices of US and Europe. For this exercise, the authors have chosen the two
most liquid CDS indices, namely CDX.NA.IG of North America and iTraxx.Europe of Europe.
Both CDX.NA.IG and iTraxx.Europe trade in spreads. Buying and selling the indices is similar to
buying and selling portfolios of loans or bonds. CDX.NA.IG and iTraxx.Europe comprise of 125
equally-weighted reference entities each. Each entity in the index is referenced to an underlying
bond/obligation. As a result, the buyer of CDS index gains exposure to the 125 underlying
obligations. Therefore, the buyer of CDS index, who takes on credit risk of the 125 reference
obligations, is the protection seller. On the other hand, the seller of CDS index who offloads his/her
credit risk exposure to underlying reference obligations is the protection buyer. Simply put, by

Page 4 of 26
VINODH MADHAVAN & HENRY (HANK) PRUDEN

IFTA JOURNAL

selling the index the protection buyer passes on the exposure to another party and by buying the
index, the protection seller takes on credit risk from counterparty. When an index is rolled out, the
Mark-To-Market (MTM) value of CDS index and the coupon that needs to be paid by the
protection buyer to the protection seller on a quarterly basis is one and the same. However, the
MTM spread value changes in accordance with market‟s evolving assessment of the default risk of
reference entities. Market‟s fear of a potential default would be reflected by a sudden surge in the
MTM spread values of CDS index. On the other hand, market‟s acknowledgement of the healthy
state of reference entities would be reflected by a fall in MTM spread values. Price is inversely
related to spread. An increase in spreads reduces the price of CDS index. As a result, upfront
payment is exchanged between the counterparties at the initiation and close of the trade in
accordance with evolving changes in index spreads (and price).
Both CDX and iTraxx indices roll every six months. In other words, a new series is created every six
months. The first series of CDX.NA.IG came into effect on 21st October ‟03, while the first series
of iTraxx Europe came into effect on 21st June ‟04. Although, the old series continue trading,
liquidity is concentrated on the most recent series at any point of time. Accordingly, this study takes
into account data pertaining to only the most recent CDX.NA.IG series starting from 3 rd April ‟04
to 6th April ‟09 and the most recent iTraxx.Europe series starting from 21st June 2004 and 6th April
„09. Also, both CDX.NA.IG and iTraxx.Europe indices are available in various maturities such as 3,
5, 7 and 10 years. For this study, the authors consider daily spread data pertaining to 10 year maturity
only. With regard to pricing mechanism, licensed dealers determine the spread for each index and
maturity. This is done through a dealer call in Europe (iTraxx). In North America (CDX), the
licensed dealers send Markit, the company that owns and administers these indices, an average
spread value. The median of the average spread values received by Markit becomes the fixed spread
of the index. This study takes into account the mid-value of the daily closing bid and ask spread
Page 5 of 26
VINODH MADHAVAN & HENRY (HANK) PRUDEN

IFTA JOURNAL

levels of iTraxx.Europe and CDX.NA.IG
Taking cognizance of the non-normality of the underlying datasets pertaining to North America and
Europe, the authors employ Classical R/S analysis (Mandelbrot, 1972; Mandelbrot & Wallis, 1969;
Wallis & Matalas, 1970) to not only understand the underlying dynamics of the two indices, but also
to draw-upon pertinent regulatory implications. Section 1 will provide a brief overview of relevant
literature. Section 2 details the methodology. The authors present the findings pertaining to Classical
R/S method in section 3. In section 4, the authors draw regulatory implications based on study‟s
findings. Annexure 1 offers a snapshot of the mathematical underpinnings behind the Classical R/S
analysis. Annexure 2 offers information pertaining to datasets utilized and the operationalizations
employed. Annexure 3 constitutes the mathematical underpinnings behind modified rescaled range
estimation technique (Lo, 1991). And, annexure 4 contains the test outcomes obtained when both
the American and European datasets were subjected to Lo‟s modified rescaled range estimation
technique.

Section 1: Relevant Literature
Periods of acute and unprecedented turbulence in markets enhance researchers‟ threshold for
seeking alternative explanations – explanations that run contrary to inferences based on wellestablished Gaussian models. Such excursions into unchartered territories reflect not only the
evolving realization of the complexity of the financial markets, but are also an acknowledgement of
the limitations of Gaussian models – models whose underlying mathematical and statistical
assumptions fail to truly reflect real-world characteristics of asset prices. Such non-conventional
research efforts paved way to studies that tested for less-frequent long-term dependence as opposed

Page 6 of 26
VINODH MADHAVAN & HENRY (HANK) PRUDEN

IFTA JOURNAL

to highly-frequent short-term dependence amidst asset prices. A time series characterized by longterm dependence coupled with non-periodic cycles is termed as a fractal (Mandelbrot, 1977)
Prior studies have explored long-term dependence characteristics amidst a variety of assets including
but not limited to (1) stock prices (Aydogan & Booth, 1988; Greene & Fielitz, 1977; Lo, 1991); (2)
stock, bond and relative stock bond returns (Peters, 1989; Ambrose, Ancel, & Griffiths, 1993); (3)
foreign stock returns (Cheung, Lai, & Lai, 1994); (4) exchange rates (Booth, Kaen, & Koveos, 1982a;
Mulligan, 2000; Chueng, 1992); (5) commodity and stock index futures (Helms, Kaen & Rosenman,
1984; Milonas, Koveos, & Booth, 1985); (6) gold prices (Booth, Kaen, & Koveos, 1982b); and (7)
Euro-dollar & T-bill futures (Lee & Mathur, 1992).
Despite the foregoing studies, not much is known about the presence of long-term dependence (if
any) in CDS indices. These credit default swap instruments have been increasingly in the news since
August 2007 because of their role in the recent credit crisis that originated in United States, which
then paved way for a synchronized global recession. It is notable that immense CDS exposures of
certain market players nearly pushed the financial markets towards systemic collapse. In addition, at
a broader level, a lot of unpleasant events have taken place in the credit markets that include but not
limited to insolvency of a prime-broker, a run on money-market funds, immense injection of
liquidity, concurrent interest rate cuts, and unprecedented amount of government subsidies for
financial and non financial firms owing to economic and political reasons.
Domestic and international regulatory efforts aimed at creating appropriate oversight that would
prevent recurrence of recent disasters, are currently in the making. It is the authors‟ belief that a
major component of an effective overarching regulatory framework would be an appropriate
globally-synchronized regulatory mechanism that helps regulators capture and consequently act
upon financial market participants‟ evolving appetite for CDS and CDS-based products. It is

Page 7 of 26
VINODH MADHAVAN & HENRY (HANK) PRUDEN

IFTA JOURNAL

therefore desirable to shed light upon the long-term dependence and potential risks inherent in the
CDS indices market. This calls for regulators to gain adequate understanding of the underlying
dynamics of the CDS markets. And it would be much easier to gain this requisite understanding on a
section of CDS markets that is most liquid and transparent, namely Investment Grade (IG) Credit
Indices of US (CDX.NA.IG) and Europe (iTraxx.Europe). And this study, aimed at understanding
the underlying long-term dependence (if any) in CDS indices market, is a step in this direction.

Section 2: Methodology
To learn more about the American and European datasets considered for this study, please refer
annexure 2.
The classical rescaled range estimation technique was employed on iTraxxC and CDXC values to
test for long-term dependence. Annexure 1 offers the mathematical underpinnings behind Hurst‟s
formula and Mandelbrot‟s Classical R/S method. As part of Mandelbrot‟s rescaled range estimation
technique, the original iTraxxC and CDXC samples need to be partitioned into different subsamples of varying lengths k. In this regard, the authors adhered to the methodology followed by
Mulligan in his paper on fractal analysis of foreign exchange markets (Mulligan, 2000). The authors
considered a minimum sub-sample size of 5 days for this study. The authors then partitioned the
original dataset into many subsamples of varying sizes ranging from a minimum of k = 5 to a
maximum value of k that would allow the original dataset to be partitioned into at least two equal
subsamples (k = N/2 = 625).
To better illustrate this methodology, let‟s consider k =6. In this case, the authors partitioned the
dataset into 208 sub-samples (1250/6 ~ 208); each subsample constitutes sequential data pertaining
to percentage change in daily spreads (iTraxxC, CDX) for 6 consecutive days. Then for each subPage 8 of 26
VINODH MADHAVAN & HENRY (HANK) PRUDEN

IFTA JOURNAL

sample, the range R and the standard deviation S was calculated. Then R/S values for each of the
208 sub-samples were calculated. Finally an average R/S for all 208 equally-sized, equally-spaced
subsamples was calculated. The outcome was labeled as R/S measure for k=6. This methodology
was followed for each value of k ranging from k =5 to k=625. Then the different R/S values were
plotted against their respective k values in the logarithmic space.

Section 3: Findings
The descriptive statistics pertaining to iTraxxC and CDXC are shown below.
Table 2.1: Case Processing Summary

iTraxxC
CDXC

Cases
Missing
N
Percent
84
6.7%
223
17.8%

Valid
N
Percent
1166
93.3%
1027
82.2%

Total
N
Percent
1250 100.0%
1250 100.0%

Table 2.2: Descriptive Statistics: iTraxxC &. CDXC

Mean
95%
Lower
Confidence Bound
Interval for Upper
Mean
Bound
5% Trimmed Mean
Median
Variance
Std. Deviation
Minimum
Maximum
Range
Interquartile Range

iTraxxC
CDXC
Std.
Std.
Statistic Error Statistic Error
0.0013 0.0009 0.0009 0.0008
-0.0004

-0.0007

0.0031

0.0025

0.0008
-0.0006
0.0009
0.0305
-0.1802
0.1919
0.3722
0.0209

0.0006
0.0000
0.0007
0.0263
-0.2102
0.1984
0.4085
0.0159

Page 9 of 26
VINODH MADHAVAN & HENRY (HANK) PRUDEN
Skewness
Kurtosis

0.6487
7.1959

0.0716
0.1432

IFTA JOURNAL
0.2172
13.0316

0.0763
0.1525

Table 2.3: Tests of Normality: iTraxxC &. CDXC
Kolmogorov-Smirnova
Shapiro-Wilk
Statistic
df
Sig.
Statistic
Df
Sig.
iTraxxC
.137
1166
.000
.878
1166
.000
CDXC
.144
1027
.000
.810
1027
.000
a. Lilliefors Significance Correction
No imputation methodology was employed by the authors to fill-in the missing values. Put simply,
missing values were treated as missing. It is notable that the findings pertaining to Kurtosis,
Skewness, Kolmogorov-Smirnov and Shapiro-Wilk tests reflect presence of non-normality in both
the iTraxxC and CDXC datasets.
Having viewed the descriptive statistics pertaining to both the datasets, the authors then subjected
the datasets to Classical rescaled range estimation technique. This resulted in estimation of R/S
values for varying sub-sample sizes (k) ranging from 5 to 625. The following are the log R/S values
vs. log k scatter-plots pertaining to both iTraxxC and CDXC datasets.

Figure 5

Figure 6
Page 10 of 26
VINODH MADHAVAN & HENRY (HANK) PRUDEN

IFTA JOURNAL

The authors then regressed the different log R/S values against log k values so as to estimate the
Hurst-Coefficient H. The following are the regression outcomes pertaining to iTraxxC and CDXC.

iTraxxC Regression Procedure
Table 3.1: Regression Statistics
Multiple R
R Square
Adjusted R Square
Standard Error
Observations

0.9903
0.9807
0.9807
0.0320
621.0000

Table 3.2: ANOVA
Regression
Residual
Total

df
1.0000
619.0000
620.0000

SS
32.1278
0.6322
32.7600

MS
F
32.1278 31456.0213
0.0010

Significance F
0.0000

Table 3.3: Regression coefficients
Coefficients
Intercept
logn

-0.0058
0.58

Standard
t Stat
Error
0.0078
-0.7418
0.0033 177.3585

P-value
0.4585
0.0000

Lower
95%
-0.0212
0.5712

CDXC Regression Procedure
Table 4.1: Regression Statistics
Multiple R
R Square
Adjusted R Square
Standard Error
Observations

Page 11 of 26

0.9885
0.9771
0.9771
0.0336
621.0000

Upper
95%
0.0096
0.5840

Lower
95.0%
-0.0212
0.5712

Upper
95.0%
0.0096
0.5840
VINODH MADHAVAN & HENRY (HANK) PRUDEN

IFTA JOURNAL

Table 4.2: ANOVA
Regression
Residual
Total

df
1.0000
619.0000
620.0000

SS
29.8613
0.6991
30.5604

MS
F
29.8613 26441.2664
0.0011

Significance F
0.0000

Table 4.3: Regression Coefficients
Coefficients
Intercept
logn

-0.0453
0.56

Standard
t Stat
Error
0.0083
-5.4909
0.0034 162.6077

P-value
0.0000
0.0000

Lower
95%
-0.0615
0.5501

Upper
Lower
95%
95.0%
-0.0291 -0.0615
0.5636 0.5501

Upper
95.0%
-0.0291
0.5636

As evidenced in tables 3.3 and 4.3, the slope of the regression lines reflect prevalence of
positive long-term dependence in both iTraxxC (H: 0.58) and CDXC (H: 0.56) datasets.
In the following section, the authors‟ draw implication pertaining to regulation and risk
management, based on H values obtained by employing Classical rescaled range estimation
technique.

Section 4: Regulatory Implications for this study
As evidenced in section 3, the H values for iTraxxC and CDXC are 0.58 and 0.56 respectively. It is
notable that both iTraxxC and CDXC are non-normal in nature. Despite their non-normality, their
long-term dependence co-efficient is more in line with less-risky traditional companies.
Table 5: Classical R/S Analysis of Individual Stocks
H value
0.78
0.72
0.73

S&P 500
IBM
Xerox

Page 12 of 26
VINODH MADHAVAN & HENRY (HANK) PRUDEN

IFTA JOURNAL

Apple
0.75
Coca-Cola
0.70
Anheuser-Busch
0.64
McDonald's
0.65
Niagara Mohawk
0.69
Texas State Utilities
0.54
Consolidated Edison
0.68
Source: Peters, 1991, p. 88
As seen above, the H values of iTraxxC and CDXC at 0.58 and 0.56 are far below H values
pertaining to high-tech stocks like Apple and IBM; and the extent of long-term dependence in
iTraxxC and CDXC is similar to what was witnessed in Texas State Utilities.
Consequently, the authors believe that regulators should realize that not all CDS markets are toxic in
nature. This is not an attempt by the authors to profess need for no regulation. Having witnessed
the near collapse of financial systems in 2007-2008, the authors understand and duly appreciate the
need for financial regulation pertaining to CDS instruments, as part of the broader financial
overhaul. Having said so, it is of utmost importance that regulators exercise moderation and
prudence, when it comes to formulating regulations pertaining to different CDS instruments. For
instance, since not all CDS instruments are equally toxic, it would be wrong to paint all CDS
instruments with the same brush. In fact, Investment-grade CDS indices such as and limited to
CDX.NA.IG and iTraxx.Europe appear to be less-riskier in comparison to high-tech stocks. Hence
it would be imprudent to treat these CDS indices on equal terms to synthetic Collateralized Debt
Obligations (CDOs) that created considerable amount of havoc in the market place.
The study‟s findings reflects the need for regulators to acknowledge prevalence of certain benign
CDS markets within the overall CDS landscape that is currently labeled as highly toxic for a variety
of reasons. Regulatory discussions and consequent actions that disregard this revelation, would
translate into a one-size-fits-all approach that caters more towards contemporary populist angst

Page 13 of 26
VINODH MADHAVAN & HENRY (HANK) PRUDEN

IFTA JOURNAL

against broader CDS markets, as opposed to rightly-targeted regulatory actions that acknowledge
and appropriately account for different risk patterns behind different CDS markets.
Future research aimed at identifying the nature of risk patterns amidst different segments of the
broader CDS market is the need-of-the-hour. Also, according to Lo (Lo, 1991), Classical R/S
method does not accommodate for short-range dependence. Consequently, long-term dependence
may not be truly long-term in nature. It may be a statistical manifestation of inherent short-term
dependence in the time series. The authors subjected both iTraxxC and CDXC to Lo‟s modified
rescaled range estimation technique (Lo, 1991), which appropriately accounts for short-term
dependence, non-normal innovations, and conditional heteroscedasticity. Annexure 3 offers the
mathematical underpinnings behind Lo‟s modified rescaled range estimation technique, while
annexure 4 constitutes the test outcomes obtained by the authors when they subjected iTraxxC and
CDXC to Lo‟s method. The results pertaining to modified rescaled range estimation technique
reveal prevalence of short-term dependence. This revelation offers huge potential for future research
in CDS markets, from a technical analysts‟ perspective.

Page 14 of 26
VINODH MADHAVAN & HENRY (HANK) PRUDEN

IFTA JOURNAL

ANNEXURE 1 – HURST’S FORMULA AND CLASSICAL R/S METHOD
Hurst‟s pioneering contribution in Hydrology was centered on determining the reservoir storage
required for a given stream, to guarantee a given draft. According to Hurst, if a long-time record of
annual discharges from the stream is available, then the storage required to yield average flow each
year is obtained by computing the cumulative sums of the departures of annual totals from the mean
annual total discharge. The range from the maximum to the minimum of such cumulative totals is
taken as the required storage R.
Consequently R indicates how big the reservoir ought to be to avoid floods or drought. R could be
calculated by employing factors such as and limited to a) σ which reflects the standard deviation of
annual discharges from one year to the next, b) N which indicates the number of years involved in
the study, and c) the power-law exponent that drives the whole equation.
Hurst‟s formula is given as follows.

Removing the logs, the equations is shown as follows

Mandelbrot refined the above Hurst formula and in the process introduced a Hurst exponent
labeled as H (Mandelbrot & Wallis, 1969). Mandelbrot‟s rescaled range statistic is widely used to test
long-term dependence in a time series. Contrary to conventional statistical tests, Mandelbrot‟s
Classical R/S method does not make any assumptions with regard to the organization of the original
data. The R/S formula simply measures whether, over varying periods of time, the amount by which

Page 15 of 26
VINODH MADHAVAN & HENRY (HANK) PRUDEN

IFTA JOURNAL

the data vary from maximum to minimum is greater or smaller than what a researcher would expect
if each data point were independent of the prior one. If the outcome is different, this implies that
the sequence of data is critical.
Mandelbrot‟s classical R/S method requires division of the time series into a number of subseries of
varying length k. Then, log[R(k)/S(k)] values are plotted against log k values. Following such a
scatter plot, a least squares regression is employed so as to fit an optimum line through different log
R/S vs. log k scatter plots. The slope of the regression line yields H.
To better illustrate Mandelbrot‟s approach to R/S estimation, let us assume a return r denoting a
profit or loss based on an asset price movement over different time periods such as a day, two days,
three days, and so on up to the length of the full-time series (denoted as n). Then the average return
(denoted by

for the entire time-period n is calculated. Then, for each shorter time period (k), the

difference between the return in that time period and the average return pertaining to whole time
series is calculated. A running total of all such differences reflect the cumulative deviation of shorter
time-period returns vis-à-vis the average return of the total time series. Then the maximum and
minimum of such accumulated deviations is found out. Subtraction of one from the other offers the
range from peak to trough in accumulated deviations. This constitutes the numerator of the R/S
estimation formula. The denominator is a conventional measure of the standard deviation of the
time series. The R/S estimation equation is shown below.

for 1≤k≤n.

Page 16 of 26
VINODH MADHAVAN & HENRY (HANK) PRUDEN

IFTA JOURNAL

ANNEXURE 2: DATA
Both the CDX and iTraxx datasets contain 1250 observations pertaining to mid-value of daily
closing bid and ask spreads between 21st June 2004 and 3rd April 2009. Figures A2.1 to A2.4 are the
line and area plots pertaining to daily closing mid values of iTraxx.Europe and CDX.NA.IG.

Figure A2.1

Figure A2.2

Figure A2.3

Figure A2.4

Page 17 of 26
VINODH MADHAVAN & HENRY (HANK) PRUDEN

IFTA JOURNAL

It has to be noted that prior studies on long term dependence such as (Mulligan, 2000)
operationalize asset returns as

where

is the logarithmic return of an asset at time t, and

of an asset at time t, while

is the

price of the asset at time t-1. Then classical rescaled range estimation technique is employed on
sequential logarithmic returns to test for long-term dependence.
Unlike traditional assets, it is notable that this study deals with closing spreads expressed in basis
points (100 bsp = 1%). Accordingly, the authors aim to test for long-term dependence with regard
to percentage change in daily closing spreads, which in-turn is operationalized as follows.

Where

is the mid-value of closing bid and ask spreads at time t;

bid and ask spreads at time t-1, and

is the mid value of closing

is the percentage change in spreads from time t-1 to t. When

expressed in terms of the indices being considered for this study, the above relationship translates as
follows.

Where

is the mid-value of closing bid and ask spreads of iTraxx at time t;

the mid value of closing bid and ask spreads of iTraxx at time t-1;

Page 18 of 26

is the percentage

is
VINODH MADHAVAN & HENRY (HANK) PRUDEN
change in iTraxx mid-value spreads at time t with respect to time t-1;
closing bid and ask spreads of CDX at time t;
spreads of CDX at time t-1; and

IFTA JOURNAL
is the mid value of

is the mid value of closing bid and ask

is the percentage change in CDX mid-value spreads at time

t with respect to time t-1. Figures A2.5 and A2.6 are area plots pertaining to iTraxxC and CDXC
respectively.

Figure A2.5

Figure A2.6

Page 19 of 26
VINODH MADHAVAN & HENRY (HANK) PRUDEN

IFTA JOURNAL

ANNEXURE 3 – MODIFIED RESCALED RANGE ESTIMATION TECHNIQUE
According to Lo (Lo, 1991), Mandelbrot‟s rescaled range estimation technique and its subsequent
refinements were not designed to distinguish between short-range and long-range dependence.
Consequently, any empirical investigation of long-term dependence in asset prices must first account
for the presence of higher frequency autocorrelation. Also, the distribution of its test-statistic is not
well-defined in the case of Classical R/S method. Further, classical R/S estimates are vulnerable to
potential heterogeneity in underlying data. Consequently, tests for long-term dependence should
account for conditional heteroscedasticity. To deal with these concerns, Lo proposed a modified
R/S technique.
Lo‟s modified R/S estimation procedure accommodates short-term dependence, non-normal
innovations, and conditional heteroscedasticity, wherein the test examines the null hypothesis of
short-term dependence process against presence of long- term dependence. Modified R/S statistic
denoted as QT is calculated as follows.
= R/

(q)

Where
And ST2 is heteroscedasticity and autocorrelation-consistent variance estimator.

Where the weighing function

, and

x* is the mean of the time series.

Page 20 of 26
VINODH MADHAVAN & HENRY (HANK) PRUDEN

IFTA JOURNAL

The truncated lag q is calculated in accordance with Andrew‟s study (Andrews, 1991) as shown
below

Where δ is the first-order autocorrelation coefficient.
The denominator of the modified R/S estimator normalizes the range measure by sample variance
and weighted sum of sample autocovariances for q>0. The modified R/S test is based on R/S
values computed for the entire time series, while the classical R/S test estimates Hurst coefficient by
regressing R/S values of different subseries on their corresponding length.
Contrary to findings pertaining to prior studies that employed classical R/S estimation procedure,
Lo (Lo, 1991) demonstrates that there is little evidence of long term dependence in US stock
returns, once short-term dependence and conditional-heteroscedasticity are accounted for in the
calculations.

Page 21 of 26
VINODH MADHAVAN & HENRY (HANK) PRUDEN

IFTA JOURNAL

ANNEXURE 4: TEST OUTCOMES PERTAINING TO MODIFIED RESCALED
RANGE ESTIMATION TECHNIQUE

Unlike Mandelbrot‟s rescaled range estimation technique, Lo‟s modified range estimation technique
warrants analysis of the entire dataset as opposed to subsamples of varying sizes. Since Lo‟s
technique accommodates for auto-covariance while calculating the standard deviation of the
underlying dataset, the authors estimated the first-order auto-correlation coefficient (δ) of both
iTraxxC and CDXC datasets. The authors then utilized the first-order autocorrelation coefficients to
calculate the truncated lag q for both iTraxxC and CDXC. The authors then utilized the q values
obtained to calculate heteroscedasticity and autocorrelation-consistent standard deviation of the
dataset. It has to be noted that the numerator (range) in both Classical Rescaled Range estimation
and modified rescaled range estimation techniques remain the same. Finally, the authors calculated
Lo‟s critical value as shown below

To test whether the long-term dependence as evidenced above is truly long-term in nature, or is it a
statistical manifestation of underlying short-term dependence in the datasets, the authors subjected
the entire iTraxxC and CDXC datasets to Lo‟s modified rescaled range estimation technique.
Before providing the findings pertaining to Lo‟s technique, it would be appropriate to provide the
first-order auto-correlation coefficients and truncated q values obtained for iTraxxC and CDXC
datasets.

Page 22 of 26
VINODH MADHAVAN & HENRY (HANK) PRUDEN

IFTA JOURNAL

Table A4.1: First-order autocorrelation coefficient & Truncated lags

iTraxxC
CDXC

δ
.1901
.0675

q
12
11

The following are the critical values that were obtained following Lo‟s analysis
Table A4.2: Modified rescaled range technique: Critical Values
iTraxxC
CDXC

q
12
11

V
1.2686
1.1303

The null-hypothesis in case of Lo‟s analysis is the absence of long-term dependence in time series.
Further, the critical values (V) at 10% and 5% significance level, as tabulated by Lo (Lo, 1991), are
1.620 and 1.747 respectively. A higher value of V that exceeds critical values would offer sufficient
grounds to reject the null hypothesis. As seen above, V statistic pertaining to both iTraxxC and
CDXC fall well below the critical values. This reflects that the long-term dependence amidst
iTraxxC and CDXC datasets as indicated by rescaled range estimation technique is actually a
statistical manifestation of short-term dependence. Further, the long-term dependence vanishes
once the estimation technique takes makes appropriate adjustments for short-term dependence and
conditional heteroscedasticity.

Page 23 of 26
VINODH MADHAVAN & HENRY (HANK) PRUDEN

IFTA JOURNAL

References
1. Ambrose, B. W., Ancel, E. W., & Griffiths, M. D. (1993). Fractal Structure in the Capital
Markets Revisited. Financial Analysts Journal, 49, 73-77.
2. Andrews, D. W. (1991). Heteroskedasticity and Autocorrelation Consistent Covariance
Matrix Estimation. Econometrica, 59(3), 817-858.
3. Aydogan , K., & Booth, G. G. (1988). Are There Long Cycles in Common Stock Returns?
Southern Economic Journal, 55(1), 141-149.
4. Barkoulas, J. T. & Baum, C.F. (1996). Long-term dependence in stock returns. Economic
Letters, 53(3), 253-259.
5. Booth, G. G., Kaen, F. R., & Koveos, P. E. (1982a). R/S analysis of foreign exchange rates
under two international monetary regimes. Journal of Monetary Economics, 10(3), 407-415.
6. Booth, G.G., Kaen, F.R. and Koveos, P.E. (1982b). Persistent Dependence in Gold Prices.
Journal of Financial Research, 5(1), 85-93.
7. Cheung, Y., Lai, K. S., & Lai, M. (1994). Are There Long Cycles in Foreign Stock returns?.
Journal of International Financial Markets, Institutions and Money, 3(1), 33-47.
8. Chueng, Y. (1992). Long Memory in Foreign Exchange Rates. Journal of Business and Economic
Statistics, 11(3), 93-101.
9. Greene, M. T. & Fielitz, B.D. (1977). Long-Term Dependence in Common Stock Returns.
Journal of Financial Economics, 4(3), 339-349.
10. Helms, B. P., Kaen, F.R. & Rosenman, R.E.(1984). Memory in Commodity Futures
Contracts. Journal of Futures Markets, 4(4), 559-567.

Page 24 of 26
VINODH MADHAVAN & HENRY (HANK) PRUDEN

IFTA JOURNAL

11. Hurst, H. E. (1951). Long-Term Storage Capacity of Reservoirs. Transactions of the American
Society of Civil Engineers, 116, 770-799.
12. Lee, C.I. & Mathur, I. (1992). Analysis of Intertemporal Dependence in Intra-Day
Eurodollar and Treasury Bill Futures Returns. Journal of Multinational Finance Management, 3(1
& 2), 111-133.
13. Lo, A.W. (1991). Long-Term Memory in Stock Market Prices. Econometrica, 59(5), 1279 1313.
14. Madhavan, V. (2009). How inter-related are American and European Credit Default Swap Indices
Market: A Search for transatlantic kinship (doctoral dissertation). Available from ProQuest
Dissertations & Theses Database. (UMI No. 3388645)
15. Mandelbrot, B.B. (1977). The Fractal Geometry of Nature. New York: Freeman.
16. Mandelbrot, B.B. (1972). Statistical methodology for Nonperiodic Cycles: From the
Covariance to R/S Analysis. Annals of Economic and Social Measurement, 1(3), 259-290.
17. Mandelbrot, B.B. & Wallis, J.R. (1968). Noah, Joseph, and Operational Hydrology. Water
Resources Research, 4(5), 909-918.
18. Mandelbrot, B.B. & Wallis, J.R. (1969). Robustness of Rescaled Range R/S in the
Measurement of Noncyclic Long-Run Statistical Dependence. Water Resources Research, 5(5),
967-988.
19. Mandelbrot, B.B. & Hudson, R.L. (2004). The (mis)behavior of Markets: A Fractal view of
Financial Turbulence. New York, NY: Basic Books.
20. Mengle, D. (2007). Credit derivatives: An Overview. Economic Review – Federal Reserve Bank of
Atlanta, 91(4), 1-24.
21. Mulligan, R. F. (2000). A Fractal Analysis of Foreign Exchange Markets. International Advances
in Economic Research, 6(1), 33-49.

Page 25 of 26
VINODH MADHAVAN & HENRY (HANK) PRUDEN

IFTA JOURNAL

22. Milonas, N.T., Koveos, P.E. & Booth, G.G. (1985). Memory in Commodity Futures
Contracts: A Comment. Journal of Futures Markets, 5(1), 113-114.
23. Peters, E.E. (1989). Fractal Structure in the Capital Markets. Financial Analysts Journal, 45(4),
32-37.
24. Peters, E.E. (1991). Chaos and Order in the Capital markets: A New View of Cycles, Prices, and
Market Volatility. New York, NY: John Wiley & Sons, Inc.
25. Wallis, J. R. & Matalas, N.C. (1970). Small Sample Properties of H and K-Estimators of the
Hurst Coefficient h. Water Resources Research, 6(6), 1583-1594.

Page 26 of 26

Mais conteúdo relacionado

Destaque

Как я представляю использование информационных технологий в социальной работе.
Как я представляю использование информационных технологий в социальной работе.Как я представляю использование информационных технологий в социальной работе.
Как я представляю использование информационных технологий в социальной работе.alenochka94-94
 
AVES® Software
AVES® SoftwareAVES® Software
AVES® Softwareraduboriga
 
Lyric breakdown
Lyric breakdownLyric breakdown
Lyric breakdowndusty96
 
Συμμετοχή στον 4ο Πανελλήνιο Μαθητικό Διαγωνισμό Ταινιών Μικρού Μήκους
Συμμετοχή στον 4ο Πανελλήνιο Μαθητικό Διαγωνισμό Ταινιών Μικρού ΜήκουςΣυμμετοχή στον 4ο Πανελλήνιο Μαθητικό Διαγωνισμό Ταινιών Μικρού Μήκους
Συμμετοχή στον 4ο Πανελλήνιο Μαθητικό Διαγωνισμό Ταινιών Μικρού ΜήκουςMaria Grigoraki
 
Scala Performance Tuning Tips
Scala Performance Tuning TipsScala Performance Tuning Tips
Scala Performance Tuning TipsKota Mizushima
 
Bilecka
BileckaBilecka
Bileckatujh88
 
المعايير التصميمية لذوي الاجتياجات الخاصة
المعايير التصميمية لذوي الاجتياجات الخاصةالمعايير التصميمية لذوي الاجتياجات الخاصة
المعايير التصميمية لذوي الاجتياجات الخاصةLara Abumansour
 
Inteligencia humana y artificial
Inteligencia humana y artificialInteligencia humana y artificial
Inteligencia humana y artificialDänii Römërö
 
Alternative mentoring styles
Alternative mentoring stylesAlternative mentoring styles
Alternative mentoring stylesLoïc Hervier
 

Destaque (15)

Как я представляю использование информационных технологий в социальной работе.
Как я представляю использование информационных технологий в социальной работе.Как я представляю использование информационных технологий в социальной работе.
Как я представляю использование информационных технологий в социальной работе.
 
AVES® Software
AVES® SoftwareAVES® Software
AVES® Software
 
457 an 11_dezembro_2013.ok
457 an 11_dezembro_2013.ok457 an 11_dezembro_2013.ok
457 an 11_dezembro_2013.ok
 
Lyric breakdown
Lyric breakdownLyric breakdown
Lyric breakdown
 
Economía Internacional Sesión V
Economía Internacional Sesión VEconomía Internacional Sesión V
Economía Internacional Sesión V
 
Συμμετοχή στον 4ο Πανελλήνιο Μαθητικό Διαγωνισμό Ταινιών Μικρού Μήκους
Συμμετοχή στον 4ο Πανελλήνιο Μαθητικό Διαγωνισμό Ταινιών Μικρού ΜήκουςΣυμμετοχή στον 4ο Πανελλήνιο Μαθητικό Διαγωνισμό Ταινιών Μικρού Μήκους
Συμμετοχή στον 4ο Πανελλήνιο Μαθητικό Διαγωνισμό Ταινιών Μικρού Μήκους
 
2013 ufsc rt_grad_class
2013 ufsc rt_grad_class2013 ufsc rt_grad_class
2013 ufsc rt_grad_class
 
Scala Performance Tuning Tips
Scala Performance Tuning TipsScala Performance Tuning Tips
Scala Performance Tuning Tips
 
Bilecka
BileckaBilecka
Bilecka
 
المعايير التصميمية لذوي الاجتياجات الخاصة
المعايير التصميمية لذوي الاجتياجات الخاصةالمعايير التصميمية لذوي الاجتياجات الخاصة
المعايير التصميمية لذوي الاجتياجات الخاصة
 
1 15-decisiones
1 15-decisiones1 15-decisiones
1 15-decisiones
 
A-Level Result
A-Level ResultA-Level Result
A-Level Result
 
Inteligencia humana y artificial
Inteligencia humana y artificialInteligencia humana y artificial
Inteligencia humana y artificial
 
Alternative mentoring styles
Alternative mentoring stylesAlternative mentoring styles
Alternative mentoring styles
 
Economía Internacional Sesión III
Economía Internacional Sesión IIIEconomía Internacional Sesión III
Economía Internacional Sesión III
 

Semelhante a IMPLICATIONS FOR RISK MANAGEMENT AND REGULATION: A STUDY OF LONG-TERM DEPENDENCE IN CREDIT DEFAULT SWAP (CDS) INDICES

CashflowFluiDynamics.icv_dino
CashflowFluiDynamics.icv_dinoCashflowFluiDynamics.icv_dino
CashflowFluiDynamics.icv_dinoDino, llc
 
Cashflow fluiddynamics 1
Cashflow fluiddynamics 1Cashflow fluiddynamics 1
Cashflow fluiddynamics 1Dino, llc
 
1964 sharpe capital asset prices a theory of market equilibrium under condi...
1964 sharpe   capital asset prices a theory of market equilibrium under condi...1964 sharpe   capital asset prices a theory of market equilibrium under condi...
1964 sharpe capital asset prices a theory of market equilibrium under condi...Sarayut Wanasin
 
Measuring and allocating portfolio risk capital in the real world
Measuring and allocating portfolio risk capital in the real worldMeasuring and allocating portfolio risk capital in the real world
Measuring and allocating portfolio risk capital in the real worldAlexander Decker
 
Does Liquidity Masquerade As Size Final
Does Liquidity Masquerade As Size FinalDoes Liquidity Masquerade As Size Final
Does Liquidity Masquerade As Size FinalAshok_Abbott
 
10 chapter 2
10 chapter 210 chapter 2
10 chapter 2sakpriya
 
Forum On News Analytics
Forum On News AnalyticsForum On News Analytics
Forum On News Analyticsmam3xs
 
An analysis of credit risk with risky collateral a methodology for haircut de...
An analysis of credit risk with risky collateral a methodology for haircut de...An analysis of credit risk with risky collateral a methodology for haircut de...
An analysis of credit risk with risky collateral a methodology for haircut de...hasare
 
Msc Project - Hedging vs Speculating with derivative instruments
Msc Project - Hedging vs Speculating with derivative instrumentsMsc Project - Hedging vs Speculating with derivative instruments
Msc Project - Hedging vs Speculating with derivative instrumentsPanos Charalampopoulos
 
Split Market Structure
Split Market StructureSplit Market Structure
Split Market StructureJames Kurt Dew
 
Xue paper-01-13-12
Xue paper-01-13-12Xue paper-01-13-12
Xue paper-01-13-12Yuhong Xue
 
Derivative in financial market
Derivative in financial marketDerivative in financial market
Derivative in financial marketAbhishek Kundu
 
Tadeáš Krejčí - 22 - Hedge Funds
Tadeáš Krejčí - 22 - Hedge FundsTadeáš Krejčí - 22 - Hedge Funds
Tadeáš Krejčí - 22 - Hedge FundsTeddy Krejci
 
Graduating Early Essay In 2021 Essay, Essay Writin
Graduating Early Essay In 2021 Essay, Essay WritinGraduating Early Essay In 2021 Essay, Essay Writin
Graduating Early Essay In 2021 Essay, Essay WritinKimberly Haynes
 
MODELING THE AUTOREGRESSIVE CAPITAL ASSET PRICING MODEL FOR TOP 10 SELECTED...
  MODELING THE AUTOREGRESSIVE CAPITAL ASSET PRICING MODEL FOR TOP 10 SELECTED...  MODELING THE AUTOREGRESSIVE CAPITAL ASSET PRICING MODEL FOR TOP 10 SELECTED...
MODELING THE AUTOREGRESSIVE CAPITAL ASSET PRICING MODEL FOR TOP 10 SELECTED...IAEME Publication
 

Semelhante a IMPLICATIONS FOR RISK MANAGEMENT AND REGULATION: A STUDY OF LONG-TERM DEPENDENCE IN CREDIT DEFAULT SWAP (CDS) INDICES (20)

CashflowFluiDynamics.icv_dino
CashflowFluiDynamics.icv_dinoCashflowFluiDynamics.icv_dino
CashflowFluiDynamics.icv_dino
 
Cashflow fluiddynamics 1
Cashflow fluiddynamics 1Cashflow fluiddynamics 1
Cashflow fluiddynamics 1
 
1964 sharpe capital asset prices a theory of market equilibrium under condi...
1964 sharpe   capital asset prices a theory of market equilibrium under condi...1964 sharpe   capital asset prices a theory of market equilibrium under condi...
1964 sharpe capital asset prices a theory of market equilibrium under condi...
 
Measuring and allocating portfolio risk capital in the real world
Measuring and allocating portfolio risk capital in the real worldMeasuring and allocating portfolio risk capital in the real world
Measuring and allocating portfolio risk capital in the real world
 
Does Liquidity Masquerade As Size Final
Does Liquidity Masquerade As Size FinalDoes Liquidity Masquerade As Size Final
Does Liquidity Masquerade As Size Final
 
10 chapter 2
10 chapter 210 chapter 2
10 chapter 2
 
Forum On News Analytics
Forum On News AnalyticsForum On News Analytics
Forum On News Analytics
 
An analysis of credit risk with risky collateral a methodology for haircut de...
An analysis of credit risk with risky collateral a methodology for haircut de...An analysis of credit risk with risky collateral a methodology for haircut de...
An analysis of credit risk with risky collateral a methodology for haircut de...
 
Sub1536
Sub1536Sub1536
Sub1536
 
Tcf2007 dk rdg
Tcf2007 dk rdgTcf2007 dk rdg
Tcf2007 dk rdg
 
Tcf2007 dk rdg
Tcf2007 dk rdgTcf2007 dk rdg
Tcf2007 dk rdg
 
Msc Project - Hedging vs Speculating with derivative instruments
Msc Project - Hedging vs Speculating with derivative instrumentsMsc Project - Hedging vs Speculating with derivative instruments
Msc Project - Hedging vs Speculating with derivative instruments
 
Split Market Structure
Split Market StructureSplit Market Structure
Split Market Structure
 
Xue paper-01-13-12
Xue paper-01-13-12Xue paper-01-13-12
Xue paper-01-13-12
 
Derivative in financial market
Derivative in financial marketDerivative in financial market
Derivative in financial market
 
Tadeáš Krejčí - 22 - Hedge Funds
Tadeáš Krejčí - 22 - Hedge FundsTadeáš Krejčí - 22 - Hedge Funds
Tadeáš Krejčí - 22 - Hedge Funds
 
Graduating Early Essay In 2021 Essay, Essay Writin
Graduating Early Essay In 2021 Essay, Essay WritinGraduating Early Essay In 2021 Essay, Essay Writin
Graduating Early Essay In 2021 Essay, Essay Writin
 
Interdependency Between Indian and US Market Indices: A Granger Causality App...
Interdependency Between Indian and US Market Indices: A Granger Causality App...Interdependency Between Indian and US Market Indices: A Granger Causality App...
Interdependency Between Indian and US Market Indices: A Granger Causality App...
 
Modeling the Volatility and Forecasting the Stock Price of the German Stock I...
Modeling the Volatility and Forecasting the Stock Price of the German Stock I...Modeling the Volatility and Forecasting the Stock Price of the German Stock I...
Modeling the Volatility and Forecasting the Stock Price of the German Stock I...
 
MODELING THE AUTOREGRESSIVE CAPITAL ASSET PRICING MODEL FOR TOP 10 SELECTED...
  MODELING THE AUTOREGRESSIVE CAPITAL ASSET PRICING MODEL FOR TOP 10 SELECTED...  MODELING THE AUTOREGRESSIVE CAPITAL ASSET PRICING MODEL FOR TOP 10 SELECTED...
MODELING THE AUTOREGRESSIVE CAPITAL ASSET PRICING MODEL FOR TOP 10 SELECTED...
 

Último

Indore Real Estate Market Trends Report.pdf
Indore Real Estate Market Trends Report.pdfIndore Real Estate Market Trends Report.pdf
Indore Real Estate Market Trends Report.pdfSaviRakhecha1
 
TEST BANK For Corporate Finance, 13th Edition By Stephen Ross, Randolph Weste...
TEST BANK For Corporate Finance, 13th Edition By Stephen Ross, Randolph Weste...TEST BANK For Corporate Finance, 13th Edition By Stephen Ross, Randolph Weste...
TEST BANK For Corporate Finance, 13th Edition By Stephen Ross, Randolph Weste...ssifa0344
 
WhatsApp 📞 Call : 9892124323 ✅Call Girls In Chembur ( Mumbai ) secure service
WhatsApp 📞 Call : 9892124323  ✅Call Girls In Chembur ( Mumbai ) secure serviceWhatsApp 📞 Call : 9892124323  ✅Call Girls In Chembur ( Mumbai ) secure service
WhatsApp 📞 Call : 9892124323 ✅Call Girls In Chembur ( Mumbai ) secure servicePooja Nehwal
 
Gurley shaw Theory of Monetary Economics.
Gurley shaw Theory of Monetary Economics.Gurley shaw Theory of Monetary Economics.
Gurley shaw Theory of Monetary Economics.Vinodha Devi
 
VIP Call Girl in Mira Road 💧 9920725232 ( Call Me ) Get A New Crush Everyday ...
VIP Call Girl in Mira Road 💧 9920725232 ( Call Me ) Get A New Crush Everyday ...VIP Call Girl in Mira Road 💧 9920725232 ( Call Me ) Get A New Crush Everyday ...
VIP Call Girl in Mira Road 💧 9920725232 ( Call Me ) Get A New Crush Everyday ...dipikadinghjn ( Why You Choose Us? ) Escorts
 
VIP Independent Call Girls in Andheri 🌹 9920725232 ( Call Me ) Mumbai Escorts...
VIP Independent Call Girls in Andheri 🌹 9920725232 ( Call Me ) Mumbai Escorts...VIP Independent Call Girls in Andheri 🌹 9920725232 ( Call Me ) Mumbai Escorts...
VIP Independent Call Girls in Andheri 🌹 9920725232 ( Call Me ) Mumbai Escorts...dipikadinghjn ( Why You Choose Us? ) Escorts
 
02_Fabio Colombo_Accenture_MeetupDora&Cybersecurity.pptx
02_Fabio Colombo_Accenture_MeetupDora&Cybersecurity.pptx02_Fabio Colombo_Accenture_MeetupDora&Cybersecurity.pptx
02_Fabio Colombo_Accenture_MeetupDora&Cybersecurity.pptxFinTech Belgium
 
Call Girls Service Nagpur Maya Call 7001035870 Meet With Nagpur Escorts
Call Girls Service Nagpur Maya Call 7001035870 Meet With Nagpur EscortsCall Girls Service Nagpur Maya Call 7001035870 Meet With Nagpur Escorts
Call Girls Service Nagpur Maya Call 7001035870 Meet With Nagpur Escortsranjana rawat
 
Dharavi Russian callg Girls, { 09892124323 } || Call Girl In Mumbai ...
Dharavi Russian callg Girls, { 09892124323 } || Call Girl In Mumbai ...Dharavi Russian callg Girls, { 09892124323 } || Call Girl In Mumbai ...
Dharavi Russian callg Girls, { 09892124323 } || Call Girl In Mumbai ...Pooja Nehwal
 
The Economic History of the U.S. Lecture 26.pdf
The Economic History of the U.S. Lecture 26.pdfThe Economic History of the U.S. Lecture 26.pdf
The Economic History of the U.S. Lecture 26.pdfGale Pooley
 
Call US 📞 9892124323 ✅ Kurla Call Girls In Kurla ( Mumbai ) secure service
Call US 📞 9892124323 ✅ Kurla Call Girls In Kurla ( Mumbai ) secure serviceCall US 📞 9892124323 ✅ Kurla Call Girls In Kurla ( Mumbai ) secure service
Call US 📞 9892124323 ✅ Kurla Call Girls In Kurla ( Mumbai ) secure servicePooja Nehwal
 
20240429 Calibre April 2024 Investor Presentation.pdf
20240429 Calibre April 2024 Investor Presentation.pdf20240429 Calibre April 2024 Investor Presentation.pdf
20240429 Calibre April 2024 Investor Presentation.pdfAdnet Communications
 
The Economic History of the U.S. Lecture 18.pdf
The Economic History of the U.S. Lecture 18.pdfThe Economic History of the U.S. Lecture 18.pdf
The Economic History of the U.S. Lecture 18.pdfGale Pooley
 
Booking open Available Pune Call Girls Shivane 6297143586 Call Hot Indian Gi...
Booking open Available Pune Call Girls Shivane  6297143586 Call Hot Indian Gi...Booking open Available Pune Call Girls Shivane  6297143586 Call Hot Indian Gi...
Booking open Available Pune Call Girls Shivane 6297143586 Call Hot Indian Gi...Call Girls in Nagpur High Profile
 
The Economic History of the U.S. Lecture 17.pdf
The Economic History of the U.S. Lecture 17.pdfThe Economic History of the U.S. Lecture 17.pdf
The Economic History of the U.S. Lecture 17.pdfGale Pooley
 
VIP Call Girl Service Andheri West ⚡ 9920725232 What It Takes To Be The Best ...
VIP Call Girl Service Andheri West ⚡ 9920725232 What It Takes To Be The Best ...VIP Call Girl Service Andheri West ⚡ 9920725232 What It Takes To Be The Best ...
VIP Call Girl Service Andheri West ⚡ 9920725232 What It Takes To Be The Best ...dipikadinghjn ( Why You Choose Us? ) Escorts
 
CALL ON ➥8923113531 🔝Call Girls Gomti Nagar Lucknow best sexual service
CALL ON ➥8923113531 🔝Call Girls Gomti Nagar Lucknow best sexual serviceCALL ON ➥8923113531 🔝Call Girls Gomti Nagar Lucknow best sexual service
CALL ON ➥8923113531 🔝Call Girls Gomti Nagar Lucknow best sexual serviceanilsa9823
 

Último (20)

Indore Real Estate Market Trends Report.pdf
Indore Real Estate Market Trends Report.pdfIndore Real Estate Market Trends Report.pdf
Indore Real Estate Market Trends Report.pdf
 
(INDIRA) Call Girl Mumbai Call Now 8250077686 Mumbai Escorts 24x7
(INDIRA) Call Girl Mumbai Call Now 8250077686 Mumbai Escorts 24x7(INDIRA) Call Girl Mumbai Call Now 8250077686 Mumbai Escorts 24x7
(INDIRA) Call Girl Mumbai Call Now 8250077686 Mumbai Escorts 24x7
 
Veritas Interim Report 1 January–31 March 2024
Veritas Interim Report 1 January–31 March 2024Veritas Interim Report 1 January–31 March 2024
Veritas Interim Report 1 January–31 March 2024
 
TEST BANK For Corporate Finance, 13th Edition By Stephen Ross, Randolph Weste...
TEST BANK For Corporate Finance, 13th Edition By Stephen Ross, Randolph Weste...TEST BANK For Corporate Finance, 13th Edition By Stephen Ross, Randolph Weste...
TEST BANK For Corporate Finance, 13th Edition By Stephen Ross, Randolph Weste...
 
WhatsApp 📞 Call : 9892124323 ✅Call Girls In Chembur ( Mumbai ) secure service
WhatsApp 📞 Call : 9892124323  ✅Call Girls In Chembur ( Mumbai ) secure serviceWhatsApp 📞 Call : 9892124323  ✅Call Girls In Chembur ( Mumbai ) secure service
WhatsApp 📞 Call : 9892124323 ✅Call Girls In Chembur ( Mumbai ) secure service
 
Gurley shaw Theory of Monetary Economics.
Gurley shaw Theory of Monetary Economics.Gurley shaw Theory of Monetary Economics.
Gurley shaw Theory of Monetary Economics.
 
(Vedika) Low Rate Call Girls in Pune Call Now 8250077686 Pune Escorts 24x7
(Vedika) Low Rate Call Girls in Pune Call Now 8250077686 Pune Escorts 24x7(Vedika) Low Rate Call Girls in Pune Call Now 8250077686 Pune Escorts 24x7
(Vedika) Low Rate Call Girls in Pune Call Now 8250077686 Pune Escorts 24x7
 
VIP Call Girl in Mira Road 💧 9920725232 ( Call Me ) Get A New Crush Everyday ...
VIP Call Girl in Mira Road 💧 9920725232 ( Call Me ) Get A New Crush Everyday ...VIP Call Girl in Mira Road 💧 9920725232 ( Call Me ) Get A New Crush Everyday ...
VIP Call Girl in Mira Road 💧 9920725232 ( Call Me ) Get A New Crush Everyday ...
 
VIP Independent Call Girls in Andheri 🌹 9920725232 ( Call Me ) Mumbai Escorts...
VIP Independent Call Girls in Andheri 🌹 9920725232 ( Call Me ) Mumbai Escorts...VIP Independent Call Girls in Andheri 🌹 9920725232 ( Call Me ) Mumbai Escorts...
VIP Independent Call Girls in Andheri 🌹 9920725232 ( Call Me ) Mumbai Escorts...
 
02_Fabio Colombo_Accenture_MeetupDora&Cybersecurity.pptx
02_Fabio Colombo_Accenture_MeetupDora&Cybersecurity.pptx02_Fabio Colombo_Accenture_MeetupDora&Cybersecurity.pptx
02_Fabio Colombo_Accenture_MeetupDora&Cybersecurity.pptx
 
Call Girls Service Nagpur Maya Call 7001035870 Meet With Nagpur Escorts
Call Girls Service Nagpur Maya Call 7001035870 Meet With Nagpur EscortsCall Girls Service Nagpur Maya Call 7001035870 Meet With Nagpur Escorts
Call Girls Service Nagpur Maya Call 7001035870 Meet With Nagpur Escorts
 
Dharavi Russian callg Girls, { 09892124323 } || Call Girl In Mumbai ...
Dharavi Russian callg Girls, { 09892124323 } || Call Girl In Mumbai ...Dharavi Russian callg Girls, { 09892124323 } || Call Girl In Mumbai ...
Dharavi Russian callg Girls, { 09892124323 } || Call Girl In Mumbai ...
 
The Economic History of the U.S. Lecture 26.pdf
The Economic History of the U.S. Lecture 26.pdfThe Economic History of the U.S. Lecture 26.pdf
The Economic History of the U.S. Lecture 26.pdf
 
Call US 📞 9892124323 ✅ Kurla Call Girls In Kurla ( Mumbai ) secure service
Call US 📞 9892124323 ✅ Kurla Call Girls In Kurla ( Mumbai ) secure serviceCall US 📞 9892124323 ✅ Kurla Call Girls In Kurla ( Mumbai ) secure service
Call US 📞 9892124323 ✅ Kurla Call Girls In Kurla ( Mumbai ) secure service
 
20240429 Calibre April 2024 Investor Presentation.pdf
20240429 Calibre April 2024 Investor Presentation.pdf20240429 Calibre April 2024 Investor Presentation.pdf
20240429 Calibre April 2024 Investor Presentation.pdf
 
The Economic History of the U.S. Lecture 18.pdf
The Economic History of the U.S. Lecture 18.pdfThe Economic History of the U.S. Lecture 18.pdf
The Economic History of the U.S. Lecture 18.pdf
 
Booking open Available Pune Call Girls Shivane 6297143586 Call Hot Indian Gi...
Booking open Available Pune Call Girls Shivane  6297143586 Call Hot Indian Gi...Booking open Available Pune Call Girls Shivane  6297143586 Call Hot Indian Gi...
Booking open Available Pune Call Girls Shivane 6297143586 Call Hot Indian Gi...
 
The Economic History of the U.S. Lecture 17.pdf
The Economic History of the U.S. Lecture 17.pdfThe Economic History of the U.S. Lecture 17.pdf
The Economic History of the U.S. Lecture 17.pdf
 
VIP Call Girl Service Andheri West ⚡ 9920725232 What It Takes To Be The Best ...
VIP Call Girl Service Andheri West ⚡ 9920725232 What It Takes To Be The Best ...VIP Call Girl Service Andheri West ⚡ 9920725232 What It Takes To Be The Best ...
VIP Call Girl Service Andheri West ⚡ 9920725232 What It Takes To Be The Best ...
 
CALL ON ➥8923113531 🔝Call Girls Gomti Nagar Lucknow best sexual service
CALL ON ➥8923113531 🔝Call Girls Gomti Nagar Lucknow best sexual serviceCALL ON ➥8923113531 🔝Call Girls Gomti Nagar Lucknow best sexual service
CALL ON ➥8923113531 🔝Call Girls Gomti Nagar Lucknow best sexual service
 

IMPLICATIONS FOR RISK MANAGEMENT AND REGULATION: A STUDY OF LONG-TERM DEPENDENCE IN CREDIT DEFAULT SWAP (CDS) INDICES

  • 1. VINODH MADHAVAN & HENRY (HANK) PRUDEN IFTA JOURNAL IMPLICATIONS FOR RISK MANAGEMENT AND REGULATION: A STUDY OF LONG-TERM DEPENDENCE IN CREDIT DEFAULT SWAP (CDS) INDICES MARKET Vinodh Madhavan, D.B.A. Malcolm S.M Watts III Research Fellow, Technical Securities Analysts Association of San Francisco Henry (Hank) Pruden, Ph.D. President, Technical Security Analysts Association of San Francisco Russell T. Sharpe Professor of Business, Golden Gate University, San Francisco. "There is nothing either good or bad, but thinking makes it so" William Shakespeare Hamlet, Prince of Denmark Credit Default Swaps, as the name indicates, are credit instruments used by banks, non- banking financial institutions, hedge funds and investors, so as to shift risk from one party to another (Mengle, 2007). These instruments are rife with controversy and opposing arguments with regard to pertinent regulatory standards aimed at ensuring requisite checks and balances in the system. The authors of this study do not wish to take sides in such arguments. Rather, the authors wish to shed light upon the nature and degree of market risk inherent in CDS instruments, and hence help regulators to calculate the level of regulatory reserves that ought to be mandated to avert extreme disasters or meltdowns in the future. In other words, the authors wish to ascertain how high a dam of dollar reserves ought to be constructed to avoid the equivalent of a 100 year flood. If the Page 1 of 26
  • 2. VINODH MADHAVAN & HENRY (HANK) PRUDEN IFTA JOURNAL underlying behavioral patterns of the CDS markets mimic a coin toss, then successful change in spread levels are independent of one another. Consequently, the level of regulatory reserves can be much less, as opposed to a scenario wherein the underlying behavioral dynamics of CDS markets are characterized by fat-tailed distribution and long-term dependence. Long memory, or long-term dependence, describes the correlation structure of a series at long lags. If a series exhibits long-term dependence, it reflects persistent temporal dependence even between distant observations (Barkoulas & Baum, 1996). Presence of high long-term dependence calls for draconian regulation. The empirical issue being dealt-with in this study is akin to questions encountered in hydrology. In hydrology, the key question is “How high a dam should we build?” The celebrated answer to the question in the world of hydrology is associated with an Englishman named Harold Edwin Hurst (Hurst, 1951), who undertook path-breaking studies of the river Nile in the 20th century for the purpose of informing the British Government of how high a dam should they build at Aswan, Egypt to control the floods during extremely wet years and at the same time create reservoirs of water for irrigation during years of drought. Hurst discovered that the true behavior of river Nile exhibited a power law, as opposed to a simple coin toss. Traditional models in hydrology assumed precipitation to be random and Gaussian in nature. Gaussian distribution implies that the precipitation levels follow the normal probability distribution, with successive years‟ precipitations either mutually independent or with a short memory. Independence implies that a large precipitation level in one year has no aftereffect on the following years, while “short memory” process implies that after-effects die within few years. Gaussian models, underestimated the durations of the longest drought or the intensity of floods in a shorttime. Long periods of drought can be extremely long, while the extreme levels of precipitation can be so extreme that they change the average precipitation level of the whole time period within which the extreme precipitation event falls (Mandelbrot & Wallis, 1968). Page 2 of 26
  • 3. VINODH MADHAVAN & HENRY (HANK) PRUDEN IFTA JOURNAL Mandelbrot and his co-authors (Mandelbrot, 1972; Mandelbrot & Wallis, 1969; Wallis & Matalas, 1970) refined the concepts and techniques created by Hurst, and applied them to financial markets. In doing so, Mandelbrot, his followers, and critics discovered behavior in financial markets that ranged from near-Gaussian phenomena to extremely one-sided fat-tailed distributions. Mandelbrot‟s refinement of Hurst‟s original methodological contribution is referred to as the “Classical R/S method” in the literature. In honor of Hurst, Mandelbrot labeled the long-term dependence coefficient of any time series as H. Employment of Classical R/S method, also known as rescaled range estimation technique, on a Gaussian distribution would yield an H value of 0.50. H value of 0.50 < H < 1 reflects positive long-term dependence in the time series, while 0 < H < 0.50 implies anti-persistence phenomenon in the time series. Positive long-term dependence implies that a larger price-point/spread level is likely to be followed by large price-point/spread level, while antipersistence behavior implies that larger price-point/spread level is bound to be followed by a small price-point/spread level. The authors‟ arguments pertaining to the proper level of regulatory reserves needed to guard against extreme hazards in CDS markets are based on the following table, that lists the different securities and their respective H values based on available empirical data (Mandelbrot & Hudson, 2004, p. 192) Table 1: Classical R/S Analysis of Individual Stocks S&P 500 IBM Xerox Apple Coca-Cola Anheuser-Busch McDonald's Niagara Mohawk Page 3 of 26 H value 0.78 0.72 0.73 0.75 0.70 0.64 0.65 0.69
  • 4. VINODH MADHAVAN & HENRY (HANK) PRUDEN IFTA JOURNAL Texas State Utilities 0.54 Consolidated Edison 0.68 Source: Peters, 1991, p. 88 As seen later in this study, the findings revealed H values of 0.56 and 0.58 pertaining to American and European CDS indices datasets respectively. Put differently, despite the non-Gaussian nature of CDS indices, long-term dependence in CDS indices are closer to the relatively sedate behavior of utility stocks, like Texas State utilities as seen in the above table. Further, the H values pertaining to CDS indices are far below the H levels pertaining to hi-tech stocks such as Apple and IBM. To arrive at the foregoing conclusion, the authors wish to take the readers through their study of empirical data collected by Dr. Madhavan on American (CDX.NA.IG) and European (iTraxx.Europe) CDS Indices (Madhavan, 2009). These dissertation datasets were then subjected to Classical R/S analysis to ascertain their H values using methodology employed by Mulligan (Mulligan, 2000). To sum up, this paper is aimed at analyzing the long-term dependence in Investment grade Credit Default Swap (CDS) indices of US and Europe. For this exercise, the authors have chosen the two most liquid CDS indices, namely CDX.NA.IG of North America and iTraxx.Europe of Europe. Both CDX.NA.IG and iTraxx.Europe trade in spreads. Buying and selling the indices is similar to buying and selling portfolios of loans or bonds. CDX.NA.IG and iTraxx.Europe comprise of 125 equally-weighted reference entities each. Each entity in the index is referenced to an underlying bond/obligation. As a result, the buyer of CDS index gains exposure to the 125 underlying obligations. Therefore, the buyer of CDS index, who takes on credit risk of the 125 reference obligations, is the protection seller. On the other hand, the seller of CDS index who offloads his/her credit risk exposure to underlying reference obligations is the protection buyer. Simply put, by Page 4 of 26
  • 5. VINODH MADHAVAN & HENRY (HANK) PRUDEN IFTA JOURNAL selling the index the protection buyer passes on the exposure to another party and by buying the index, the protection seller takes on credit risk from counterparty. When an index is rolled out, the Mark-To-Market (MTM) value of CDS index and the coupon that needs to be paid by the protection buyer to the protection seller on a quarterly basis is one and the same. However, the MTM spread value changes in accordance with market‟s evolving assessment of the default risk of reference entities. Market‟s fear of a potential default would be reflected by a sudden surge in the MTM spread values of CDS index. On the other hand, market‟s acknowledgement of the healthy state of reference entities would be reflected by a fall in MTM spread values. Price is inversely related to spread. An increase in spreads reduces the price of CDS index. As a result, upfront payment is exchanged between the counterparties at the initiation and close of the trade in accordance with evolving changes in index spreads (and price). Both CDX and iTraxx indices roll every six months. In other words, a new series is created every six months. The first series of CDX.NA.IG came into effect on 21st October ‟03, while the first series of iTraxx Europe came into effect on 21st June ‟04. Although, the old series continue trading, liquidity is concentrated on the most recent series at any point of time. Accordingly, this study takes into account data pertaining to only the most recent CDX.NA.IG series starting from 3 rd April ‟04 to 6th April ‟09 and the most recent iTraxx.Europe series starting from 21st June 2004 and 6th April „09. Also, both CDX.NA.IG and iTraxx.Europe indices are available in various maturities such as 3, 5, 7 and 10 years. For this study, the authors consider daily spread data pertaining to 10 year maturity only. With regard to pricing mechanism, licensed dealers determine the spread for each index and maturity. This is done through a dealer call in Europe (iTraxx). In North America (CDX), the licensed dealers send Markit, the company that owns and administers these indices, an average spread value. The median of the average spread values received by Markit becomes the fixed spread of the index. This study takes into account the mid-value of the daily closing bid and ask spread Page 5 of 26
  • 6. VINODH MADHAVAN & HENRY (HANK) PRUDEN IFTA JOURNAL levels of iTraxx.Europe and CDX.NA.IG Taking cognizance of the non-normality of the underlying datasets pertaining to North America and Europe, the authors employ Classical R/S analysis (Mandelbrot, 1972; Mandelbrot & Wallis, 1969; Wallis & Matalas, 1970) to not only understand the underlying dynamics of the two indices, but also to draw-upon pertinent regulatory implications. Section 1 will provide a brief overview of relevant literature. Section 2 details the methodology. The authors present the findings pertaining to Classical R/S method in section 3. In section 4, the authors draw regulatory implications based on study‟s findings. Annexure 1 offers a snapshot of the mathematical underpinnings behind the Classical R/S analysis. Annexure 2 offers information pertaining to datasets utilized and the operationalizations employed. Annexure 3 constitutes the mathematical underpinnings behind modified rescaled range estimation technique (Lo, 1991). And, annexure 4 contains the test outcomes obtained when both the American and European datasets were subjected to Lo‟s modified rescaled range estimation technique. Section 1: Relevant Literature Periods of acute and unprecedented turbulence in markets enhance researchers‟ threshold for seeking alternative explanations – explanations that run contrary to inferences based on wellestablished Gaussian models. Such excursions into unchartered territories reflect not only the evolving realization of the complexity of the financial markets, but are also an acknowledgement of the limitations of Gaussian models – models whose underlying mathematical and statistical assumptions fail to truly reflect real-world characteristics of asset prices. Such non-conventional research efforts paved way to studies that tested for less-frequent long-term dependence as opposed Page 6 of 26
  • 7. VINODH MADHAVAN & HENRY (HANK) PRUDEN IFTA JOURNAL to highly-frequent short-term dependence amidst asset prices. A time series characterized by longterm dependence coupled with non-periodic cycles is termed as a fractal (Mandelbrot, 1977) Prior studies have explored long-term dependence characteristics amidst a variety of assets including but not limited to (1) stock prices (Aydogan & Booth, 1988; Greene & Fielitz, 1977; Lo, 1991); (2) stock, bond and relative stock bond returns (Peters, 1989; Ambrose, Ancel, & Griffiths, 1993); (3) foreign stock returns (Cheung, Lai, & Lai, 1994); (4) exchange rates (Booth, Kaen, & Koveos, 1982a; Mulligan, 2000; Chueng, 1992); (5) commodity and stock index futures (Helms, Kaen & Rosenman, 1984; Milonas, Koveos, & Booth, 1985); (6) gold prices (Booth, Kaen, & Koveos, 1982b); and (7) Euro-dollar & T-bill futures (Lee & Mathur, 1992). Despite the foregoing studies, not much is known about the presence of long-term dependence (if any) in CDS indices. These credit default swap instruments have been increasingly in the news since August 2007 because of their role in the recent credit crisis that originated in United States, which then paved way for a synchronized global recession. It is notable that immense CDS exposures of certain market players nearly pushed the financial markets towards systemic collapse. In addition, at a broader level, a lot of unpleasant events have taken place in the credit markets that include but not limited to insolvency of a prime-broker, a run on money-market funds, immense injection of liquidity, concurrent interest rate cuts, and unprecedented amount of government subsidies for financial and non financial firms owing to economic and political reasons. Domestic and international regulatory efforts aimed at creating appropriate oversight that would prevent recurrence of recent disasters, are currently in the making. It is the authors‟ belief that a major component of an effective overarching regulatory framework would be an appropriate globally-synchronized regulatory mechanism that helps regulators capture and consequently act upon financial market participants‟ evolving appetite for CDS and CDS-based products. It is Page 7 of 26
  • 8. VINODH MADHAVAN & HENRY (HANK) PRUDEN IFTA JOURNAL therefore desirable to shed light upon the long-term dependence and potential risks inherent in the CDS indices market. This calls for regulators to gain adequate understanding of the underlying dynamics of the CDS markets. And it would be much easier to gain this requisite understanding on a section of CDS markets that is most liquid and transparent, namely Investment Grade (IG) Credit Indices of US (CDX.NA.IG) and Europe (iTraxx.Europe). And this study, aimed at understanding the underlying long-term dependence (if any) in CDS indices market, is a step in this direction. Section 2: Methodology To learn more about the American and European datasets considered for this study, please refer annexure 2. The classical rescaled range estimation technique was employed on iTraxxC and CDXC values to test for long-term dependence. Annexure 1 offers the mathematical underpinnings behind Hurst‟s formula and Mandelbrot‟s Classical R/S method. As part of Mandelbrot‟s rescaled range estimation technique, the original iTraxxC and CDXC samples need to be partitioned into different subsamples of varying lengths k. In this regard, the authors adhered to the methodology followed by Mulligan in his paper on fractal analysis of foreign exchange markets (Mulligan, 2000). The authors considered a minimum sub-sample size of 5 days for this study. The authors then partitioned the original dataset into many subsamples of varying sizes ranging from a minimum of k = 5 to a maximum value of k that would allow the original dataset to be partitioned into at least two equal subsamples (k = N/2 = 625). To better illustrate this methodology, let‟s consider k =6. In this case, the authors partitioned the dataset into 208 sub-samples (1250/6 ~ 208); each subsample constitutes sequential data pertaining to percentage change in daily spreads (iTraxxC, CDX) for 6 consecutive days. Then for each subPage 8 of 26
  • 9. VINODH MADHAVAN & HENRY (HANK) PRUDEN IFTA JOURNAL sample, the range R and the standard deviation S was calculated. Then R/S values for each of the 208 sub-samples were calculated. Finally an average R/S for all 208 equally-sized, equally-spaced subsamples was calculated. The outcome was labeled as R/S measure for k=6. This methodology was followed for each value of k ranging from k =5 to k=625. Then the different R/S values were plotted against their respective k values in the logarithmic space. Section 3: Findings The descriptive statistics pertaining to iTraxxC and CDXC are shown below. Table 2.1: Case Processing Summary iTraxxC CDXC Cases Missing N Percent 84 6.7% 223 17.8% Valid N Percent 1166 93.3% 1027 82.2% Total N Percent 1250 100.0% 1250 100.0% Table 2.2: Descriptive Statistics: iTraxxC &. CDXC Mean 95% Lower Confidence Bound Interval for Upper Mean Bound 5% Trimmed Mean Median Variance Std. Deviation Minimum Maximum Range Interquartile Range iTraxxC CDXC Std. Std. Statistic Error Statistic Error 0.0013 0.0009 0.0009 0.0008 -0.0004 -0.0007 0.0031 0.0025 0.0008 -0.0006 0.0009 0.0305 -0.1802 0.1919 0.3722 0.0209 0.0006 0.0000 0.0007 0.0263 -0.2102 0.1984 0.4085 0.0159 Page 9 of 26
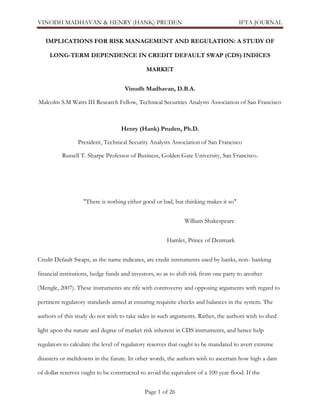
  • 10. VINODH MADHAVAN & HENRY (HANK) PRUDEN Skewness Kurtosis 0.6487 7.1959 0.0716 0.1432 IFTA JOURNAL 0.2172 13.0316 0.0763 0.1525 Table 2.3: Tests of Normality: iTraxxC &. CDXC Kolmogorov-Smirnova Shapiro-Wilk Statistic df Sig. Statistic Df Sig. iTraxxC .137 1166 .000 .878 1166 .000 CDXC .144 1027 .000 .810 1027 .000 a. Lilliefors Significance Correction No imputation methodology was employed by the authors to fill-in the missing values. Put simply, missing values were treated as missing. It is notable that the findings pertaining to Kurtosis, Skewness, Kolmogorov-Smirnov and Shapiro-Wilk tests reflect presence of non-normality in both the iTraxxC and CDXC datasets. Having viewed the descriptive statistics pertaining to both the datasets, the authors then subjected the datasets to Classical rescaled range estimation technique. This resulted in estimation of R/S values for varying sub-sample sizes (k) ranging from 5 to 625. The following are the log R/S values vs. log k scatter-plots pertaining to both iTraxxC and CDXC datasets. Figure 5 Figure 6 Page 10 of 26
  • 11. VINODH MADHAVAN & HENRY (HANK) PRUDEN IFTA JOURNAL The authors then regressed the different log R/S values against log k values so as to estimate the Hurst-Coefficient H. The following are the regression outcomes pertaining to iTraxxC and CDXC. iTraxxC Regression Procedure Table 3.1: Regression Statistics Multiple R R Square Adjusted R Square Standard Error Observations 0.9903 0.9807 0.9807 0.0320 621.0000 Table 3.2: ANOVA Regression Residual Total df 1.0000 619.0000 620.0000 SS 32.1278 0.6322 32.7600 MS F 32.1278 31456.0213 0.0010 Significance F 0.0000 Table 3.3: Regression coefficients Coefficients Intercept logn -0.0058 0.58 Standard t Stat Error 0.0078 -0.7418 0.0033 177.3585 P-value 0.4585 0.0000 Lower 95% -0.0212 0.5712 CDXC Regression Procedure Table 4.1: Regression Statistics Multiple R R Square Adjusted R Square Standard Error Observations Page 11 of 26 0.9885 0.9771 0.9771 0.0336 621.0000 Upper 95% 0.0096 0.5840 Lower 95.0% -0.0212 0.5712 Upper 95.0% 0.0096 0.5840
  • 12. VINODH MADHAVAN & HENRY (HANK) PRUDEN IFTA JOURNAL Table 4.2: ANOVA Regression Residual Total df 1.0000 619.0000 620.0000 SS 29.8613 0.6991 30.5604 MS F 29.8613 26441.2664 0.0011 Significance F 0.0000 Table 4.3: Regression Coefficients Coefficients Intercept logn -0.0453 0.56 Standard t Stat Error 0.0083 -5.4909 0.0034 162.6077 P-value 0.0000 0.0000 Lower 95% -0.0615 0.5501 Upper Lower 95% 95.0% -0.0291 -0.0615 0.5636 0.5501 Upper 95.0% -0.0291 0.5636 As evidenced in tables 3.3 and 4.3, the slope of the regression lines reflect prevalence of positive long-term dependence in both iTraxxC (H: 0.58) and CDXC (H: 0.56) datasets. In the following section, the authors‟ draw implication pertaining to regulation and risk management, based on H values obtained by employing Classical rescaled range estimation technique. Section 4: Regulatory Implications for this study As evidenced in section 3, the H values for iTraxxC and CDXC are 0.58 and 0.56 respectively. It is notable that both iTraxxC and CDXC are non-normal in nature. Despite their non-normality, their long-term dependence co-efficient is more in line with less-risky traditional companies. Table 5: Classical R/S Analysis of Individual Stocks H value 0.78 0.72 0.73 S&P 500 IBM Xerox Page 12 of 26
  • 13. VINODH MADHAVAN & HENRY (HANK) PRUDEN IFTA JOURNAL Apple 0.75 Coca-Cola 0.70 Anheuser-Busch 0.64 McDonald's 0.65 Niagara Mohawk 0.69 Texas State Utilities 0.54 Consolidated Edison 0.68 Source: Peters, 1991, p. 88 As seen above, the H values of iTraxxC and CDXC at 0.58 and 0.56 are far below H values pertaining to high-tech stocks like Apple and IBM; and the extent of long-term dependence in iTraxxC and CDXC is similar to what was witnessed in Texas State Utilities. Consequently, the authors believe that regulators should realize that not all CDS markets are toxic in nature. This is not an attempt by the authors to profess need for no regulation. Having witnessed the near collapse of financial systems in 2007-2008, the authors understand and duly appreciate the need for financial regulation pertaining to CDS instruments, as part of the broader financial overhaul. Having said so, it is of utmost importance that regulators exercise moderation and prudence, when it comes to formulating regulations pertaining to different CDS instruments. For instance, since not all CDS instruments are equally toxic, it would be wrong to paint all CDS instruments with the same brush. In fact, Investment-grade CDS indices such as and limited to CDX.NA.IG and iTraxx.Europe appear to be less-riskier in comparison to high-tech stocks. Hence it would be imprudent to treat these CDS indices on equal terms to synthetic Collateralized Debt Obligations (CDOs) that created considerable amount of havoc in the market place. The study‟s findings reflects the need for regulators to acknowledge prevalence of certain benign CDS markets within the overall CDS landscape that is currently labeled as highly toxic for a variety of reasons. Regulatory discussions and consequent actions that disregard this revelation, would translate into a one-size-fits-all approach that caters more towards contemporary populist angst Page 13 of 26
  • 14. VINODH MADHAVAN & HENRY (HANK) PRUDEN IFTA JOURNAL against broader CDS markets, as opposed to rightly-targeted regulatory actions that acknowledge and appropriately account for different risk patterns behind different CDS markets. Future research aimed at identifying the nature of risk patterns amidst different segments of the broader CDS market is the need-of-the-hour. Also, according to Lo (Lo, 1991), Classical R/S method does not accommodate for short-range dependence. Consequently, long-term dependence may not be truly long-term in nature. It may be a statistical manifestation of inherent short-term dependence in the time series. The authors subjected both iTraxxC and CDXC to Lo‟s modified rescaled range estimation technique (Lo, 1991), which appropriately accounts for short-term dependence, non-normal innovations, and conditional heteroscedasticity. Annexure 3 offers the mathematical underpinnings behind Lo‟s modified rescaled range estimation technique, while annexure 4 constitutes the test outcomes obtained by the authors when they subjected iTraxxC and CDXC to Lo‟s method. The results pertaining to modified rescaled range estimation technique reveal prevalence of short-term dependence. This revelation offers huge potential for future research in CDS markets, from a technical analysts‟ perspective. Page 14 of 26
  • 15. VINODH MADHAVAN & HENRY (HANK) PRUDEN IFTA JOURNAL ANNEXURE 1 – HURST’S FORMULA AND CLASSICAL R/S METHOD Hurst‟s pioneering contribution in Hydrology was centered on determining the reservoir storage required for a given stream, to guarantee a given draft. According to Hurst, if a long-time record of annual discharges from the stream is available, then the storage required to yield average flow each year is obtained by computing the cumulative sums of the departures of annual totals from the mean annual total discharge. The range from the maximum to the minimum of such cumulative totals is taken as the required storage R. Consequently R indicates how big the reservoir ought to be to avoid floods or drought. R could be calculated by employing factors such as and limited to a) σ which reflects the standard deviation of annual discharges from one year to the next, b) N which indicates the number of years involved in the study, and c) the power-law exponent that drives the whole equation. Hurst‟s formula is given as follows. Removing the logs, the equations is shown as follows Mandelbrot refined the above Hurst formula and in the process introduced a Hurst exponent labeled as H (Mandelbrot & Wallis, 1969). Mandelbrot‟s rescaled range statistic is widely used to test long-term dependence in a time series. Contrary to conventional statistical tests, Mandelbrot‟s Classical R/S method does not make any assumptions with regard to the organization of the original data. The R/S formula simply measures whether, over varying periods of time, the amount by which Page 15 of 26
  • 16. VINODH MADHAVAN & HENRY (HANK) PRUDEN IFTA JOURNAL the data vary from maximum to minimum is greater or smaller than what a researcher would expect if each data point were independent of the prior one. If the outcome is different, this implies that the sequence of data is critical. Mandelbrot‟s classical R/S method requires division of the time series into a number of subseries of varying length k. Then, log[R(k)/S(k)] values are plotted against log k values. Following such a scatter plot, a least squares regression is employed so as to fit an optimum line through different log R/S vs. log k scatter plots. The slope of the regression line yields H. To better illustrate Mandelbrot‟s approach to R/S estimation, let us assume a return r denoting a profit or loss based on an asset price movement over different time periods such as a day, two days, three days, and so on up to the length of the full-time series (denoted as n). Then the average return (denoted by for the entire time-period n is calculated. Then, for each shorter time period (k), the difference between the return in that time period and the average return pertaining to whole time series is calculated. A running total of all such differences reflect the cumulative deviation of shorter time-period returns vis-à-vis the average return of the total time series. Then the maximum and minimum of such accumulated deviations is found out. Subtraction of one from the other offers the range from peak to trough in accumulated deviations. This constitutes the numerator of the R/S estimation formula. The denominator is a conventional measure of the standard deviation of the time series. The R/S estimation equation is shown below. for 1≤k≤n. Page 16 of 26
  • 17. VINODH MADHAVAN & HENRY (HANK) PRUDEN IFTA JOURNAL ANNEXURE 2: DATA Both the CDX and iTraxx datasets contain 1250 observations pertaining to mid-value of daily closing bid and ask spreads between 21st June 2004 and 3rd April 2009. Figures A2.1 to A2.4 are the line and area plots pertaining to daily closing mid values of iTraxx.Europe and CDX.NA.IG. Figure A2.1 Figure A2.2 Figure A2.3 Figure A2.4 Page 17 of 26
  • 18. VINODH MADHAVAN & HENRY (HANK) PRUDEN IFTA JOURNAL It has to be noted that prior studies on long term dependence such as (Mulligan, 2000) operationalize asset returns as where is the logarithmic return of an asset at time t, and of an asset at time t, while is the price of the asset at time t-1. Then classical rescaled range estimation technique is employed on sequential logarithmic returns to test for long-term dependence. Unlike traditional assets, it is notable that this study deals with closing spreads expressed in basis points (100 bsp = 1%). Accordingly, the authors aim to test for long-term dependence with regard to percentage change in daily closing spreads, which in-turn is operationalized as follows. Where is the mid-value of closing bid and ask spreads at time t; bid and ask spreads at time t-1, and is the mid value of closing is the percentage change in spreads from time t-1 to t. When expressed in terms of the indices being considered for this study, the above relationship translates as follows. Where is the mid-value of closing bid and ask spreads of iTraxx at time t; the mid value of closing bid and ask spreads of iTraxx at time t-1; Page 18 of 26 is the percentage is
  • 19. VINODH MADHAVAN & HENRY (HANK) PRUDEN change in iTraxx mid-value spreads at time t with respect to time t-1; closing bid and ask spreads of CDX at time t; spreads of CDX at time t-1; and IFTA JOURNAL is the mid value of is the mid value of closing bid and ask is the percentage change in CDX mid-value spreads at time t with respect to time t-1. Figures A2.5 and A2.6 are area plots pertaining to iTraxxC and CDXC respectively. Figure A2.5 Figure A2.6 Page 19 of 26
  • 20. VINODH MADHAVAN & HENRY (HANK) PRUDEN IFTA JOURNAL ANNEXURE 3 – MODIFIED RESCALED RANGE ESTIMATION TECHNIQUE According to Lo (Lo, 1991), Mandelbrot‟s rescaled range estimation technique and its subsequent refinements were not designed to distinguish between short-range and long-range dependence. Consequently, any empirical investigation of long-term dependence in asset prices must first account for the presence of higher frequency autocorrelation. Also, the distribution of its test-statistic is not well-defined in the case of Classical R/S method. Further, classical R/S estimates are vulnerable to potential heterogeneity in underlying data. Consequently, tests for long-term dependence should account for conditional heteroscedasticity. To deal with these concerns, Lo proposed a modified R/S technique. Lo‟s modified R/S estimation procedure accommodates short-term dependence, non-normal innovations, and conditional heteroscedasticity, wherein the test examines the null hypothesis of short-term dependence process against presence of long- term dependence. Modified R/S statistic denoted as QT is calculated as follows. = R/ (q) Where And ST2 is heteroscedasticity and autocorrelation-consistent variance estimator. Where the weighing function , and x* is the mean of the time series. Page 20 of 26
  • 21. VINODH MADHAVAN & HENRY (HANK) PRUDEN IFTA JOURNAL The truncated lag q is calculated in accordance with Andrew‟s study (Andrews, 1991) as shown below Where δ is the first-order autocorrelation coefficient. The denominator of the modified R/S estimator normalizes the range measure by sample variance and weighted sum of sample autocovariances for q>0. The modified R/S test is based on R/S values computed for the entire time series, while the classical R/S test estimates Hurst coefficient by regressing R/S values of different subseries on their corresponding length. Contrary to findings pertaining to prior studies that employed classical R/S estimation procedure, Lo (Lo, 1991) demonstrates that there is little evidence of long term dependence in US stock returns, once short-term dependence and conditional-heteroscedasticity are accounted for in the calculations. Page 21 of 26
  • 22. VINODH MADHAVAN & HENRY (HANK) PRUDEN IFTA JOURNAL ANNEXURE 4: TEST OUTCOMES PERTAINING TO MODIFIED RESCALED RANGE ESTIMATION TECHNIQUE Unlike Mandelbrot‟s rescaled range estimation technique, Lo‟s modified range estimation technique warrants analysis of the entire dataset as opposed to subsamples of varying sizes. Since Lo‟s technique accommodates for auto-covariance while calculating the standard deviation of the underlying dataset, the authors estimated the first-order auto-correlation coefficient (δ) of both iTraxxC and CDXC datasets. The authors then utilized the first-order autocorrelation coefficients to calculate the truncated lag q for both iTraxxC and CDXC. The authors then utilized the q values obtained to calculate heteroscedasticity and autocorrelation-consistent standard deviation of the dataset. It has to be noted that the numerator (range) in both Classical Rescaled Range estimation and modified rescaled range estimation techniques remain the same. Finally, the authors calculated Lo‟s critical value as shown below To test whether the long-term dependence as evidenced above is truly long-term in nature, or is it a statistical manifestation of underlying short-term dependence in the datasets, the authors subjected the entire iTraxxC and CDXC datasets to Lo‟s modified rescaled range estimation technique. Before providing the findings pertaining to Lo‟s technique, it would be appropriate to provide the first-order auto-correlation coefficients and truncated q values obtained for iTraxxC and CDXC datasets. Page 22 of 26
  • 23. VINODH MADHAVAN & HENRY (HANK) PRUDEN IFTA JOURNAL Table A4.1: First-order autocorrelation coefficient & Truncated lags iTraxxC CDXC δ .1901 .0675 q 12 11 The following are the critical values that were obtained following Lo‟s analysis Table A4.2: Modified rescaled range technique: Critical Values iTraxxC CDXC q 12 11 V 1.2686 1.1303 The null-hypothesis in case of Lo‟s analysis is the absence of long-term dependence in time series. Further, the critical values (V) at 10% and 5% significance level, as tabulated by Lo (Lo, 1991), are 1.620 and 1.747 respectively. A higher value of V that exceeds critical values would offer sufficient grounds to reject the null hypothesis. As seen above, V statistic pertaining to both iTraxxC and CDXC fall well below the critical values. This reflects that the long-term dependence amidst iTraxxC and CDXC datasets as indicated by rescaled range estimation technique is actually a statistical manifestation of short-term dependence. Further, the long-term dependence vanishes once the estimation technique takes makes appropriate adjustments for short-term dependence and conditional heteroscedasticity. Page 23 of 26
  • 24. VINODH MADHAVAN & HENRY (HANK) PRUDEN IFTA JOURNAL References 1. Ambrose, B. W., Ancel, E. W., & Griffiths, M. D. (1993). Fractal Structure in the Capital Markets Revisited. Financial Analysts Journal, 49, 73-77. 2. Andrews, D. W. (1991). Heteroskedasticity and Autocorrelation Consistent Covariance Matrix Estimation. Econometrica, 59(3), 817-858. 3. Aydogan , K., & Booth, G. G. (1988). Are There Long Cycles in Common Stock Returns? Southern Economic Journal, 55(1), 141-149. 4. Barkoulas, J. T. & Baum, C.F. (1996). Long-term dependence in stock returns. Economic Letters, 53(3), 253-259. 5. Booth, G. G., Kaen, F. R., & Koveos, P. E. (1982a). R/S analysis of foreign exchange rates under two international monetary regimes. Journal of Monetary Economics, 10(3), 407-415. 6. Booth, G.G., Kaen, F.R. and Koveos, P.E. (1982b). Persistent Dependence in Gold Prices. Journal of Financial Research, 5(1), 85-93. 7. Cheung, Y., Lai, K. S., & Lai, M. (1994). Are There Long Cycles in Foreign Stock returns?. Journal of International Financial Markets, Institutions and Money, 3(1), 33-47. 8. Chueng, Y. (1992). Long Memory in Foreign Exchange Rates. Journal of Business and Economic Statistics, 11(3), 93-101. 9. Greene, M. T. & Fielitz, B.D. (1977). Long-Term Dependence in Common Stock Returns. Journal of Financial Economics, 4(3), 339-349. 10. Helms, B. P., Kaen, F.R. & Rosenman, R.E.(1984). Memory in Commodity Futures Contracts. Journal of Futures Markets, 4(4), 559-567. Page 24 of 26
  • 25. VINODH MADHAVAN & HENRY (HANK) PRUDEN IFTA JOURNAL 11. Hurst, H. E. (1951). Long-Term Storage Capacity of Reservoirs. Transactions of the American Society of Civil Engineers, 116, 770-799. 12. Lee, C.I. & Mathur, I. (1992). Analysis of Intertemporal Dependence in Intra-Day Eurodollar and Treasury Bill Futures Returns. Journal of Multinational Finance Management, 3(1 & 2), 111-133. 13. Lo, A.W. (1991). Long-Term Memory in Stock Market Prices. Econometrica, 59(5), 1279 1313. 14. Madhavan, V. (2009). How inter-related are American and European Credit Default Swap Indices Market: A Search for transatlantic kinship (doctoral dissertation). Available from ProQuest Dissertations & Theses Database. (UMI No. 3388645) 15. Mandelbrot, B.B. (1977). The Fractal Geometry of Nature. New York: Freeman. 16. Mandelbrot, B.B. (1972). Statistical methodology for Nonperiodic Cycles: From the Covariance to R/S Analysis. Annals of Economic and Social Measurement, 1(3), 259-290. 17. Mandelbrot, B.B. & Wallis, J.R. (1968). Noah, Joseph, and Operational Hydrology. Water Resources Research, 4(5), 909-918. 18. Mandelbrot, B.B. & Wallis, J.R. (1969). Robustness of Rescaled Range R/S in the Measurement of Noncyclic Long-Run Statistical Dependence. Water Resources Research, 5(5), 967-988. 19. Mandelbrot, B.B. & Hudson, R.L. (2004). The (mis)behavior of Markets: A Fractal view of Financial Turbulence. New York, NY: Basic Books. 20. Mengle, D. (2007). Credit derivatives: An Overview. Economic Review – Federal Reserve Bank of Atlanta, 91(4), 1-24. 21. Mulligan, R. F. (2000). A Fractal Analysis of Foreign Exchange Markets. International Advances in Economic Research, 6(1), 33-49. Page 25 of 26
  • 26. VINODH MADHAVAN & HENRY (HANK) PRUDEN IFTA JOURNAL 22. Milonas, N.T., Koveos, P.E. & Booth, G.G. (1985). Memory in Commodity Futures Contracts: A Comment. Journal of Futures Markets, 5(1), 113-114. 23. Peters, E.E. (1989). Fractal Structure in the Capital Markets. Financial Analysts Journal, 45(4), 32-37. 24. Peters, E.E. (1991). Chaos and Order in the Capital markets: A New View of Cycles, Prices, and Market Volatility. New York, NY: John Wiley & Sons, Inc. 25. Wallis, J. R. & Matalas, N.C. (1970). Small Sample Properties of H and K-Estimators of the Hurst Coefficient h. Water Resources Research, 6(6), 1583-1594. Page 26 of 26