
Recomendados
Recomendados
Mais conteúdo relacionado
Mais procurados
Mais procurados (18)
Destaque
Destaque (15)
Semelhante a Downtown Calgary Office Insight Report - Q4 2015
Semelhante a Downtown Calgary Office Insight Report - Q4 2015 (20)
Último
Último (20)
Downtown Calgary Office Insight Report - Q4 2015
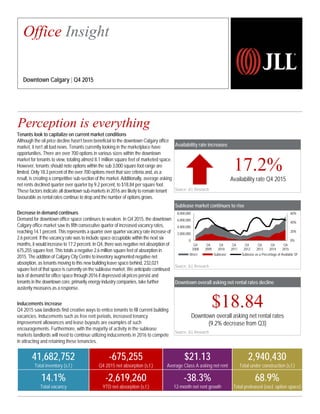
- 1. Availability rate increases Source: JLL Research Sublease market continues to rise Source: JLL Research Downtown overall asking net rental rates decline Downtown overall asking net rental rates (9.2% decrease from Q3) Source: JLL Research Tenants look to capitalize on current market conditions Although the oil price decline hasn’t been beneficial to the downtown Calgary office market, it isn’t all bad news. Tenants currently looking in the marketplace have opportunities. There are over 700 options in various sizes within the downtown market for tenants to view, totaling almost 8.1 million square feet of marketed space. However, tenants should note options within the sub 3,000 square foot range are limited. Only 18.3 percent of the over 700 options meet that size criteria and, as a result, is creating a competitive sub-section of the market. Additionally, average asking net rents declined quarter over quarter by 9.2 percent, to $18.84 per square foot. These factors indicate all downtown sub-markets in 2016 are likely to remain tenant favourable as rental rates continue to drop and the number of options grows. Decrease in demand continues Demand for downtown office space continues to weaken. In Q4 2015, the downtown Calgary office market saw its fifth consecutive quarter of increased vacancy rates, reaching 14.1 percent. This represents a quarter over quarter vacancy rate increase of 2.6 percent. If the vacancy rate was to include space occupiable within the next six months, it would increase to 17.2 percent. In Q4, there was negative net absorption of 675,255 square feet. This totals a negative 2.6 million square feet of absorption in 2015. The addition of Calgary City Centre to inventory augmented negative net absorption, as tenants moving to this new building leave space behind, 232,021 square feet of that space is currently on the sublease market. We anticipate continued lack of demand for office space through 2016 if depressed oil prices persist and tenants in the downtown core, primarily energy industry companies, take further austerity measures as a response. Inducements increase Q4 2015 saw landlords find creative ways to entice tenants to fill current building vacancies. Inducements such as free rent periods, increased tenancy improvement allowances and lease buyouts are examples of such encouragements. Furthermore, with the majority of activity in the sublease markets landlords will need to continue utilizing inducements in 2016 to compete in attracting and retaining these tenancies. Perception is everything Availability rate Q4 2015 Office Insight Downtown Calgary | Q4 2015 41,682,752 Total inventory (s.f.) -675,255 Q4 2015 net absorption (s.f.) $21.13 Average Class A asking net rent 2,940,430 Total under construction (s.f.) 14.1% Total vacancy -2,619,260 YTD net absorption (s.f.) -38.3% 12-month net rent growth 68.9% Total preleased (excl. option space) 0% 20% 40% 60% 0 2,000,000 4,000,000 6,000,000 8,000,000 Q4 2008 Q4 2009 Q4 2010 Q4 2011 Q4 2012 Q4 2013 Q4 2014 Q4 2015 Direct Sublease Sublease as a Percentage of Available SF
- 2. Current conditions – submarket Historical total available sublease space (s.f.) Source: JLL Research Source: JLL Research Total net absorption (s.f.) Source: JLL Research Total vacancy rate (%) Source: JLL Research Average Class A asking net rent ($ p.s.f.) Source: JLL Research 511,834 430,809 120,671 -926,629 1,782,007 2,577,705 2,053,340 -609,595 -117,667 -2,619,260-3,000,000 -2,000,000 -1,000,000 0 1,000,000 2,000,000 3,000,000 2006 2007 2008 2009 2010 2011 2012 2013 2014 2015 Landlordleverage Tenantleverage Peaking market Falling market Bottoming market Rising market 416,683 298,198 1,327,678 1,298,384 3,242,601 0 1,000,000 2,000,000 3,000,000 4,000,000 2011 2012 2013 2014 2015 ©2016 Jones Lang LaSalle IP, Inc. All rights reserved.For more information, contact: Trent Peterson | Trent.Peterson@am.jll.com Calgary, Downtown 3.0% 1.6% 3.6% 6.9% 11.0% 4.3% 3.6% 4.5% 6.6% 11.5% 14.1% 0.0% 5.0% 10.0% 15.0% 2006 2007 2008 2009 2010 2011 2012 2013 2014 2015 2015 * $52.95 $55.44 $54.36 $24.78 $25.55 $37.17 $42.10 $40.01 $34.27 $21.13 $15.00 $20.00 $25.00 $30.00 $35.00 $40.00 $45.00 $50.00 $55.00 $60.00 2006 2007 2008 2009 2010 2011 2012 2013 2014 2015 *Rate indicates only current vacancies. If vacancies were to include availabilities within the next 6 months, then vacancy would spike to 17.2%