![DATA ANALYSIS PROJECT - COMPUTATIONAL MODELING 2
The model predicted the stock forecast value for specific
duration of time along with confidence intervals to determine
the maximum VAR (Value at Risk) while calculating the
anticipated return versus the maximum loss possible.
D. Risk Analysis Model
We can determine the Value at Risk using the Monte Carlo
method. Using the Monte Carlo for running multiple trials
with random market conditions, we can evaluate portfolio
losses for each random trial. Next we aggregate all these
simulations to determine the risky in the stock. Let’s start
with a brief explanation of what we’re going to do.
Geometric Brownian motion (GBM) method was used,
which is technically known as Markov process. This implies
that the stock price follows a random walk and is consistent
with the weak form of the efficient market hypothesis (EMH):
past price information is already incorporated and the next
price movement is ”conditionally independent” of past price
movements. This means that the past information on the price
of a stock is independent of where the stock price will be
in the future, basically meaning, you can’t perfectly predict
the future solely based on the previous price of a stock. The
equation for geometric Brownian motion is given by the
following equation:
∆S
S = µ∆t + σ
√
∆t
We see that the change in the stock price is the current
stock price multiplied by two terms. The first term is known
as ”drift”, which is the average daily return multiplied by the
change of time. The second term is known as ”shock”, for
each time period the stock will ”drift” and then experience a
”shock” which will randomly push the stock price up or down.
By simulating this series of steps of drift and shock thousands
of times, we can begin to do a simulation of where we might
expect the stock price to be.
III. RESULTS AND DISCUSSION
The results of our model are as listed below: Figure 2
indicates the fluctuation in Apple Stock prices for multiple
iterations with respect to the number of days. Choosing the
best model that minimizes error, we have calculated the
predicted value. Table 1 list the predicted vs actual values
for Nokia stock index to get the estimate of the accuracy of
our model.
IV. CONCLUSION
The paper presents extensive method of building ARIMA
model and implementing Monte Carlo method for stock price
risk analysis & prediction. The results found with ARIMA
model demonstrated the potential of ARIMA models to predict
stock prices accurately on short term basis. This project
implementation could guide investors to make profitable in-
vestment decisions. With the results attained, ARIMA models
can compete well with other new forecasting techniques in
short-term prediction.
Fig. 2. Monte Carlo price Analysis of Google Stock index
TABLE I
RESULTS OF NOKIA STOCK INDEX
REFERENCES
[1] Y. Bengio. Practical recommendations for gradient-based training of deep
architectures. In Neural Networks: Tricks of the Trade, pages 437478.
Springer, 2012.
[2] Y. Bengio and F. Gingras. Recurrent neural networks for missing or
asynchronous data. Advances in neural information processing systems,
pages 395401, 1996.
[3] J. Bergstra, O. Breuleux, F. Bastien, P. Lamblin, R. Pascanu, G. Des-
jardins, J. Turian, D. Warde-Farley, and Y. Bengio. Theano: A cpu and
gpu math compiler in python. In Proc. 9th Python in Science Conf, pages
17, 2010.
[4] S. K.Mitra, Optimal Combination of Trading Rules Using Neural Net-
works, International Business Research, vol. 2, no. 1, pp. 86-99, 2009.](data:image/gif;base64,R0lGODlhAQABAIAAAAAAAP///yH5BAEAAAAALAAAAAABAAEAAAIBRAA7)
Recomendados
Recomendados
Mais conteúdo relacionado
Mais procurados
Mais procurados (20)
Semelhante a Stock market analysis
Semelhante a Stock market analysis (20)
Último
Último (20)
Stock market analysis
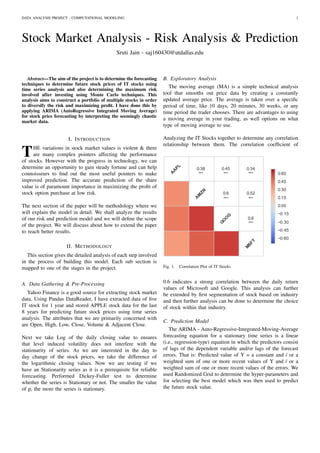
- 1. DATA ANALYSIS PROJECT - COMPUTATIONAL MODELING 1 Stock Market Analysis - Risk Analysis & Prediction Sruti Jain - saj160430@utdallas.edu Abstract—The aim of the project is to determine the forecasting techniques to determine future stock prices of IT stocks using time series analysis and also determining the maximum risk involved after investing using Monte Carlo techniques. This analysis aims to construct a portfolio of multiple stocks in order to diversify the risk and maximizing profit. I have done this by applying ARIMA (AutoRegressive Integrated Moving Average) for stock price forecasting by interpreting the seemingly chaotic market data. I. INTRODUCTION THE variations in stock market values is violent & there are many complex pointers affecting the performance of stocks. However with the progress in technology, we can determine an opportunity to gain steady fortune and can help connoisseurs to find out the most useful pointers to make improved prediction. The accurate prediction of the share value is of paramount importance in maximizing the profit of stock option purchase at low risk. The next section of the paper will be methodology where we will explain the model in detail. We shall analyze the results of our risk and prediction model and we will define the scope of the project. We will discuss about how to extend the paper to reach better results. II. METHODOLOGY This section gives the detailed analysis of each step involved in the process of building this model. Each sub section is mapped to one of the stages in the project. A. Data Gathering & Pre-Processing Yahoo Finance is a good source for extracting stock market data. Using Pandas DataReader, I have extracted data of five IT stock for 1 year and stored APPLE stock data for the last 8 years for predicting future stock prices using time series analysis. The attributes that we are primarily concerned with are Open, High, Low, Close, Volume & Adjacent Close. Next we take Log of the daily closing value to ensures that level induced volatility does not interfere with the stationarity of series. As we are interested in the day to day change of the stock prices, we take the difference of the logarithmic closing values. Now we are testing if we have an Stationarity series as it is a prerequisite for reliable forecasting. Performed Dickey-Fuller test to determine whether the series is Stationary or not. The smaller the value of p, the more the series is stationary. B. Exploratory Analysis The moving average (MA) is a simple technical analysis tool that smooths out price data by creating a constantly updated average price. The average is taken over a specific period of time, like 10 days, 20 minutes, 30 weeks, or any time period the trader chooses. There are advantages to using a moving average in your trading, as well options on what type of moving average to use. Analyzing the IT Stocks together to determine any correlation relationship between them. The correlation coefficient of Fig. 1. Correlation Plot of IT Stocks 0.6 indicates a strong correlation between the daily return values of Microsoft and Google. This analysis can further be extended by first segmentation of stock based on industry and then further analysis can be done to determine the choice of stock within that industry. C. Prediction Model The ARIMA - Auto-Regressive-Integrated-Moving-Average forecasting equation for a stationary time series is a linear (i.e., regression-type) equation in which the predictors consist of lags of the dependent variable and/or lags of the forecast errors. That is: Predicted value of Y = a constant and / or a weighted sum of one or more recent values of Y and / or a weighted sum of one or more recent values of the errors. We used Randomized Grid to determine the hyper-parameters and for selecting the best model which was then used to predict the future stock value.
- 2. DATA ANALYSIS PROJECT - COMPUTATIONAL MODELING 2 The model predicted the stock forecast value for specific duration of time along with confidence intervals to determine the maximum VAR (Value at Risk) while calculating the anticipated return versus the maximum loss possible. D. Risk Analysis Model We can determine the Value at Risk using the Monte Carlo method. Using the Monte Carlo for running multiple trials with random market conditions, we can evaluate portfolio losses for each random trial. Next we aggregate all these simulations to determine the risky in the stock. Let’s start with a brief explanation of what we’re going to do. Geometric Brownian motion (GBM) method was used, which is technically known as Markov process. This implies that the stock price follows a random walk and is consistent with the weak form of the efficient market hypothesis (EMH): past price information is already incorporated and the next price movement is ”conditionally independent” of past price movements. This means that the past information on the price of a stock is independent of where the stock price will be in the future, basically meaning, you can’t perfectly predict the future solely based on the previous price of a stock. The equation for geometric Brownian motion is given by the following equation: ∆S S = µ∆t + σ √ ∆t We see that the change in the stock price is the current stock price multiplied by two terms. The first term is known as ”drift”, which is the average daily return multiplied by the change of time. The second term is known as ”shock”, for each time period the stock will ”drift” and then experience a ”shock” which will randomly push the stock price up or down. By simulating this series of steps of drift and shock thousands of times, we can begin to do a simulation of where we might expect the stock price to be. III. RESULTS AND DISCUSSION The results of our model are as listed below: Figure 2 indicates the fluctuation in Apple Stock prices for multiple iterations with respect to the number of days. Choosing the best model that minimizes error, we have calculated the predicted value. Table 1 list the predicted vs actual values for Nokia stock index to get the estimate of the accuracy of our model. IV. CONCLUSION The paper presents extensive method of building ARIMA model and implementing Monte Carlo method for stock price risk analysis & prediction. The results found with ARIMA model demonstrated the potential of ARIMA models to predict stock prices accurately on short term basis. This project implementation could guide investors to make profitable in- vestment decisions. With the results attained, ARIMA models can compete well with other new forecasting techniques in short-term prediction. Fig. 2. Monte Carlo price Analysis of Google Stock index TABLE I RESULTS OF NOKIA STOCK INDEX REFERENCES [1] Y. Bengio. Practical recommendations for gradient-based training of deep architectures. In Neural Networks: Tricks of the Trade, pages 437478. Springer, 2012. [2] Y. Bengio and F. Gingras. Recurrent neural networks for missing or asynchronous data. Advances in neural information processing systems, pages 395401, 1996. [3] J. Bergstra, O. Breuleux, F. Bastien, P. Lamblin, R. Pascanu, G. Des- jardins, J. Turian, D. Warde-Farley, and Y. Bengio. Theano: A cpu and gpu math compiler in python. In Proc. 9th Python in Science Conf, pages 17, 2010. [4] S. K.Mitra, Optimal Combination of Trading Rules Using Neural Net- works, International Business Research, vol. 2, no. 1, pp. 86-99, 2009.