Global Capital Goods Industry

The global outlook series on the Capital Goods Industry provides a collection of statistical anecdotes, market briefs, and concise summaries of research findings. Illustrated with 29 fact-rich market data tables, the report offers a rudimentary overview of the industry and highlights latest trends and demand drivers. Regional markets briefly abstracted and covered include United States, Europe, (France, Germany, UK, and Russia) Asia-Pacific (China, India, Australia, New Zealand, and Taiwan) South Africa, Argentina, and Brazil. The report offers a compilation of recent mergers, acquisitions, and strategic corporate developments. Also included is an indexed, easy-to-refer, fact-finder directory listing the addresses, and contact details of 1170 companies worldwide.

Recomendados
Mais conteúdo relacionado
Destaque
Destaque (12)
Mais de ReportLinker.com
Mais de ReportLinker.com (20)
Global Capital Goods Industry
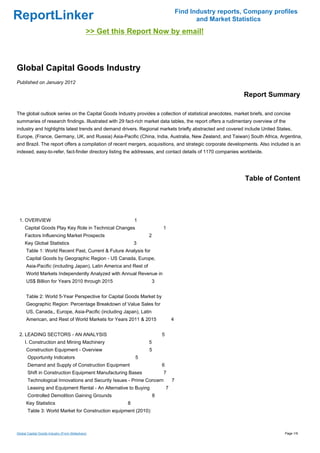
- 1. Find Industry reports, Company profiles ReportLinker and Market Statistics >> Get this Report Now by email! Global Capital Goods Industry Published on January 2012 Report Summary The global outlook series on the Capital Goods Industry provides a collection of statistical anecdotes, market briefs, and concise summaries of research findings. Illustrated with 29 fact-rich market data tables, the report offers a rudimentary overview of the industry and highlights latest trends and demand drivers. Regional markets briefly abstracted and covered include United States, Europe, (France, Germany, UK, and Russia) Asia-Pacific (China, India, Australia, New Zealand, and Taiwan) South Africa, Argentina, and Brazil. The report offers a compilation of recent mergers, acquisitions, and strategic corporate developments. Also included is an indexed, easy-to-refer, fact-finder directory listing the addresses, and contact details of 1170 companies worldwide. Table of Content 1. OVERVIEW 1 Capital Goods Play Key Role in Technical Changes 1 Factors Influencing Market Prospects 2 Key Global Statistics 3 Table 1: World Recent Past, Current & Future Analysis for Capital Goods by Geographic Region - US Canada, Europe, Asia-Pacific (including Japan), Latin America and Rest of World Markets Independently Analyzed with Annual Revenue in US$ Billion for Years 2010 through 2015 3 Table 2: World 5-Year Perspective for Capital Goods Market by Geographic Region: Percentage Breakdown of Value Sales for US, Canada,, Europe, Asia-Pacific (including Japan), Latin American, and Rest of World Markets for Years 2011 & 2015 4 2. LEADING SECTORS - AN ANALYSIS 5 I. Construction and Mining Machinery 5 Construction Equipment - Overview 5 Opportunity Indicators 5 Demand and Supply of Construction Equipment 6 Shift in Construction Equipment Manufacturing Bases 7 Technological Innovations and Security Issues - Prime Concern 7 Leasing and Equipment Rental - An Alternative to Buying 7 Controlled Demolition Gaining Grounds 8 Key Statistics 8 Table 3: World Market for Construction equipment (2010): Global Capital Goods Industry (From Slideshare) Page 1/9
- 2. Find Industry reports, Company profiles ReportLinker and Market Statistics >> Get this Report Now by email! Percentage Share Breakdown by Geographic Region - US, Canada, Japan, China, Europe and Rest of World Markets Independently Analyzed with Annual Sales Figures in units for Years 2007 through 2015 8 Review of the Mining Equipment Market 8 Regional Perspective 8 Infrastructure Development, Maintenance and Mining Activity Impact Demand 9 Market Growing for Earthmoving and Mining Equipment 9 Table 4: Global Specialized Mining Machinery and Equipment Market (2011): Percentage Share Breakdown of Revenue by Region - Asia-Pacific, North America, Western Europe, and Others 9 Manufacturers Switch to Aluminum Bronze and Other Alloys for Developing Kingpin Bushings for Dump Trucks 10 Competitive Scenario 10 Table 5: Leading Construction Equipment Firms (2010): Percentage Market Share Breakdown by Leading Players 10 II. Agricultural Implements and Machinery 10 Market Structure and Overview 10 Development and Progress 11 Economics of Agricultural Machinery 11 Global Agricultural Implements and Machinery Market Bounces Back After Recession 11 Table 6: Global Farm Equipment Industry (2010): Percentage Share Breakdown of Dollar Sales by Components 12 Table 7: Leading Agricultural Machinery Manufacturers (2009): Percentage Market Share Breakdown by Leading Players 12 III. Plastic Processing Machinery 13 Globalization - Transforming Plastic Industry Operations 13 IV. Food Processing Machinery and Equipment 13 Food Processing - A Sector in Transition 13 A Highly Fragmented Industry 14 Demand Drivers 14 Primary Markets Worldwide: A Regional Perspective 14 V. Packaging Machinery 14 Market Overview 14 Factors Influencing Packaging Machinery Market 15 Food Processing - A Major End-Use Customer for Packaging Machinery 15 Competitive Scenario 16 Technological Sophistication Transforming the Fragmented Market to a Mature Oligopoly 16 Market Trends 16 Economic Growth Fuels Demand for Packaging Machinery 16 Bottling Machinery Shows Stable Growth Patterns 17 Pharmaceuticals Drive Blister Packaging Growth 17 Global Capital Goods Industry (From Slideshare) Page 2/9
- 3. Find Industry reports, Company profiles ReportLinker and Market Statistics >> Get this Report Now by email! Longer Shelf-Life Packages: Fueling Demand for Vacuum Packaging Machinery 17 Packaging Machinery Gets Global: The Automation Panacea 17 Towards Shorter Innovation Cycles 17 VI. Printing Machinery 18 Overview 18 Table 8: Global Printing Equipment Market (2011): Percentage Share Breakdown by Segments - Sheetfed, Digital, Flexo, Heatset, Coldset, and others 18 Developing Nations to Provide Greener Pastures for Printing Machinery 18 Color Printing Gains Ground 18 VII. Welding Machinery 19 Introduction & Overview 19 Table 9: Global Welding Market (2008 and 2013): Breakdown of Value Sales in US Millions 19 Table 10: Global Cutting and Welding Equipment Market (2010): Percentage Share Breakdown by Segments - Filler Materials, Welding Equipment, Gas Equipment, Arc Accessories, and Plasma Cutting 20 Catching up with Times 20 Plastic Welding Sidelines Metal Welding 20 Boom in Demand for Ultrasonic Welding 20 Automation of Welding Equipment Growing Popular 21 Technological Trends 21 User Friendly Equipment: Order of the Day 21 Laser Welding Growing Above Other Techniques 21 Innovations Lead the Industry 21 3. RECENT INDUSTRY ACTIVITY 22 4. PRODUCT INNOVATIONS/ INTRODUCTIONS 41 A REGIONAL MARKET PERSPECTIVE 55 1. UNITED STATES 55 Plastic Processing Machinery Market 55 Overview & Analysis 55 Table 11: US Market for Plastics Processing Machinery (2010): Percentage Share Breakdown of Annual Dollar Sales by Product Segment 55 Injection Molding Machinery 55 Table 12: Injection Molding Machinery Market in the United States (2010) - Percentage Share Breakdown of Value Sales by End-Use Sector 56 Agricultural Implements and Machinery 56 Global Capital Goods Industry (From Slideshare) Page 3/9
- 4. Find Industry reports, Company profiles ReportLinker and Market Statistics >> Get this Report Now by email! Overview 56 Table 13: US Market for Agricultural Implements and Machinery (2010): Percentage Share Breakdown of Annual Dollar Sales by Product Segment 56 Competitive Scenario 57 Construction and Mining Machinery/ Equipment 57 Snapshots 57 Competitive Landscape and Market Share Analysis 57 Food Processing Machinery & Equipment 57 An Introduction 57 Promising Growth Forecast in the US Food Processing Machinery Sector 58 Welding Machinery 58 Table 14: US Market for Welding Machinery (2010): Percentage Share Breakdown of Annual Dollar Sales by Product Segment 59 2. EUROPE 60 Characteristics of Capital Goods Industry in EU 60 Consequences on the Product Life Cycle 60 Capital Goods Industry, a Cyclical Industry 60 Table 15: European Recent Past, Current & Future Analysis for Capital Goods by Geographic Region - France, Germany, Italy, UK, Spain, Russia, Rest of Europe Markets Independently Analyzed with Annual Sales Figures in US$ Billion for Years 2010 through 2015 61 Table 16: European 5-Year Perspective for Capital Goods Market by Geographic Region: Percentage Breakdown of Value Sales for France, Germany, Italy, UK, Spain, Russia, Rest of Europe Markets for Years 2011 & 2015 62 Agricultural Equipment Sector - An Overview 63 Table 17: European Market for Agricultural Implements and Machinery (2010): Percentage Share Breakdown of Annual Dollar Sales by Product Segment 63 Competitive Scenario 63 Construction and Mining Equipment 63 Food Processing Machinery and Equipment 63 Table 18: European Market for Food Processing Machinery and Equipment (2010): Percentage Share Breakdown of Annual Dollar Sales by Product Group 64 2a. FRANCE 65 Plastic Processing Machinery Sector 65 Table 19: French Market for Plastics Processing Machinery 2010): Percentage Share Breakdown of Annual Dollar Sales by Product Segment 65 Agricultural Implements and Machinery 65 Agricultural Machinery Market Grows 66 Global Capital Goods Industry (From Slideshare) Page 4/9
- 5. Find Industry reports, Company profiles ReportLinker and Market Statistics >> Get this Report Now by email! 2b. GERMANY 67 Printing Machinery & Supplies Sector 67 Overview 67 Competitive Scenario 67 Agricultural Implements and Machinery Sector - An Overview 67 Table 20: German Market for Agricultural Implements and Machinery (2010): Percentage Share Breakdown of Annual Dollar Sales by Product Segment 68 Plastic Processing Machinery 68 Table 21: German Market for Plastics Processing Machinery (2010): Percentage Share Breakdown of Annual Dollar Sales by Product Segment 68 2c. UNITED KINGDOM 69 Agricultural Machinery and Implements 69 Overview 69 Leading Players 69 Plastic Processing Machinery Sector 69 Introduction 69 Threatened by Low-Cost Imports 70 Market Analysis 70 Table 22: UK Market for Plastics Processing Machinery (2010): Percentage Share Breakdown of Annual Dollar Sales by Product Segment 70 Welding Machinery Sector 70 Table 23: UK Market for Welding Machinery (2010): Percentage Share Breakdown of Annual Dollar Sales by Product Segment 70 Food Processing Machinery and Equipment 71 Table 24: UK Market for Food Processing Machinery and Equipment (2010): Percentage Share Breakdown of Annual Dollar Sales by Product Segment 71 2d. RUSSIA 71 Russian Welding Equipment Market to Receive Impetus from Oil and Gas Exploration 71 3. ASIA-PACIFIC 72 Plastic Processing Machinery Sector 72 Table 25: Asia-Pacific Market for Plastics Processing Machinery (2010): Percentage Share Breakdown of Annual Dollar Sales by Product Segment 72 Agricultural Machinery 72 Food Processing Machinery and Equipment 73 Table 26: Asia-Pacific Market for Food Processing Machinery and Equipment (2010): Percentage Share Breakdown of Annual Dollar Sales by Product Segment 73 3a. CHINA 74 Global Capital Goods Industry (From Slideshare) Page 5/9
- 6. Find Industry reports, Company profiles ReportLinker and Market Statistics >> Get this Report Now by email! Capital Goods Market - An Overview 74 Capital Goods' Sales in China 74 Plastic Processing Machinery Sector 74 Undergoing Metamorphosis 74 Table 27: Chinese Market for Plastics Processing Machinery (2010): Percentage Share Breakdown of Annual Dollar Sales by Product Segment 75 Competition Gears Up among Multinationals 75 Agricultural Machinery and Equipment 76 Market Structure 76 Overview 77 Table 28: Farm Equipment Demand in China (2011): Percentage Market Share Breakdown by Product Segment 78 Welding Machinery Sector - An Overview 78 Construction Equipment Market 78 Foreign Players Redesigning the Roadmap 78 Industry Structure 79 3b. INDIA 80 Overview 80 Indian Capital Goods Sector: Competitive Analysis 80 Challenges 80 Raw Materials Not on Par with International Standards 81 Indian Capital Goods Market Lags Behind Technologically Advanced Nations 81 'Made in India' Brand Image Haunts Capital Goods Manufacturers 81 Poor Infrastructure Adds to the Woes of Capital Goods Manufacturers 82 Clusterization Offers Solace to Certain Capital Goods Segments 82 Construction Equipment - A Review 82 Welding Equipment Market - A Review 83 Construction, Shipbuilding, and Energy to Spur Indian Welding Equipment Market 83 Table 29: Indian Construction Equipment Market (2011): Percentage Market Share Breakdown by Equipment 84 Hurdles Faced by India's Welding Sector 84 3c. AUSTRALIA 85 Non-Traditional Markets Drive Growth in Commercial Food Processing Machinery Market 85 3d. NEW ZEALAND 86 3e. TAIWAN 87 Post Recession Recovery Drives Packaging Equipment Market Growth 87 Pharmaceutical Industry - Key Market for Packaging Equipment in Taiwan 87 Global Capital Goods Industry (From Slideshare) Page 6/9
- 7. Find Industry reports, Company profiles ReportLinker and Market Statistics >> Get this Report Now by email! 3f. SOUTH AFRICA 88 4. LATIN AMERICA 88 4a. ARGENTINA 88 Mining Industry Overview 88 4b. BRAZIL 89 Agricultural Machinery and Implements Sector - An Overview 89 Construction Machinery and Equipment Market 89 Production Trends 89 GLOBAL DIRECTORY Global Capital Goods Industry (From Slideshare) Page 7/9
- 8. Find Industry reports, Company profiles ReportLinker and Market Statistics >> Get this Report Now by email! Fax Order Form To place an order via fax simply print this form, fill in the information below and fax the completed form to: Europe, Middle East and Africa : + 33 4 37 37 15 56 Asia, Oceania and America : + 1 (805) 617 17 93 If you have any questions please visit http://www.reportlinker.com/notify/contact Order Information Please verify that the product information is correct and select the format(s) you require. Global Capital Goods Industry Product Formats Please select the product formats and the quantity you require. 1 User License--USD 2 950.00 Quantity: _____ Contact Information Please enter all the information below in BLOCK CAPITALS Title: Mr Mrs Dr Miss Ms Prof First Name: _____________________________ Last Name: __________________________________ Email Address: __________________________________________________________________________ Job Title: __________________________________________________________________________ Organization: __________________________________________________________________________ Address: __________________________________________________________________________ City: __________________________________________________________________________ Postal / Zip Code: __________________________________________________________________________ Country: __________________________________________________________________________ Phone Number: __________________________________________________________________________ Fax Number: __________________________________________________________________________ Global Capital Goods Industry (From Slideshare) Page 8/9
- 9. Find Industry reports, Company profiles ReportLinker and Market Statistics >> Get this Report Now by email! Payment Information Please indicate the payment method, you would like to use by selecting the appropriate box. Payment by credit card Card Number: ______________________________________________ Expiry Date __________ / _________ CVV Number _____________________ Card Type (ex: Visa, Amex…) _________________________________ Payment by wire transfer Crédit Mutuel RIB : 10278 07314 00020257701 89 BIC : CMCIFR2A IBAN : FR76 1027 8073 1400 0202 5770 189 Payment by check UBIQUICK SAS 16 rue Grenette – 69002 LYON, FRANCE Customer signature: Please note that by ordering from Reportlinker you are agreeing to our Terms and Conditions at http://www.reportlinker.com/index/terms Please fax this form to: Europe, Middle East and Africa : + 33 4 37 37 15 56 Asia, Oceania and America : + 1 (805) 617 17 93 Global Capital Goods Industry (From Slideshare) Page 9/9