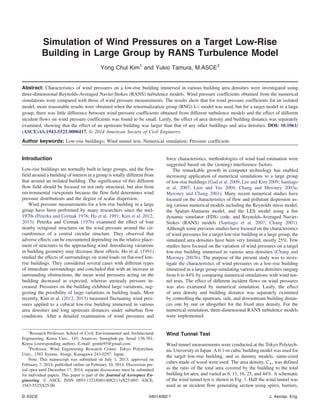
SlideShare uma empresa Scribd logo
1 de 14
Baixar para ler offline
Simulation of Wind Pressures on a Target Low-Rise
Building in Large Group by RANS Turbulence Model
Yong Chul Kim1
and Yukio Tamura, M.ASCE2
Abstract: Characteristics of wind pressures on a low-rise building immersed in various building area densities were investigated using
three-dimensional Reynolds-Averaged Navier-Stokes (RANS) turbulence models. Wind pressure coefficients obtained from the numerical
simulations were compared with those of wind pressure measurements. The results show that for wind pressure coefficients for an isolated
model, more reasonable results were obtained when the renormalization group (RNG) k-ε model was used, but for a target model in a large
group, there was little difference between wind pressure coefficients obtained from different turbulence models and the effect of different
incident flows on wind pressure coefficients was found to be small. Lastly, the effect of area density and building distance was separately
examined, showing that the effect of an upstream building was larger than that of any other buildings and area densities. DOI: 10.1061/
(ASCE)AS.1943-5525.0000417. © 2014 American Society of Civil Engineers.
Author keywords: Low-rise buildings; Wind tunnel test; Numerical simulation; Pressure coefficient.
Introduction
Low-rise buildings are normally built in large groups, and the flow
field around a building of interest in a group is totally different from
that around an isolated building. The significance of this different
flow field should be focused on not only structural, but also from
environmental viewpoints because the flow field determines wind
pressure distributions and the degree of scalar dispersion.
Wind pressure measurements for a low-rise building in a large
group have been performed by many researchers since the mid-
1970s (Peterka and Cermak 1976; Ho et al. 1991; Kim et al. 2012,
2013). Peterka and Cermak (1976) examined the effect of four
nearby octagonal structures on the wind pressure around the cir-
cumference of a central circular structure. They observed that
adverse effects can be encountered depending on the relative place-
ment of structures in the approaching wind. Introducing variations
in building geometry may decrease these effects. Ho et al. (1991)
studied the effects of surroundings on wind loads on flat-roof low-
rise buildings. They considered several cases with different types
of immediate surroundings and concluded that with an increase in
surrounding obstructions, the mean wind pressures acting on the
building decreased as expected, whereas unsteady pressure in-
creased. Pressures on the building exhibited large variations, sug-
gesting the possibility of large variations in building loads. Most
recently, Kim et al. (2012, 2013) measured fluctuating wind pres-
sures applied to a cubical low-rise building immersed in various
area densities and long upstream distances under suburban flow
conditions. After a detailed examination of wind pressures and
force characteristics, methodologies of wind load estimation were
suggested based on the (zoning) interference factors.
The remarkable growth in computer technology has enabled
increasing application of numerical simulations to a large group
of low-rise buildings (Gad et al. 2009; Lee and Kim 2009; Santiago
et al. 2007; Lien and Yee 2004; Chang and Meroney 2003a;
Meroney and Chang 2001). Many recent numerical studies have
focused on the characteristics of flow and pollutant dispersion us-
ing various numerical models including the Reynolds stress model,
the Spalart-Alamaras model, and the LES model using a fire
dynamic simulator (FDS) code, and Reynolds-Averaged Navier-
Stokes (RANS) models (Santiago et al. 2007; Chang 2001).
Although some previous studies have focused on the characteristics
of wind pressures for a target low-rise building in a large group, the
simulated area densities have been very limited, mostly 25%. Few
studies have focused on the variation of wind pressures on a target
low-rise building immersed in various area densities (Chang and
Meroney 2003b). The purpose of the present study was to inves-
tigate the characteristics of wind pressures on a low-rise building
immersed in a large group simulating various area densities ranging
from 6 to 44% by comparing numerical simulations with wind tun-
nel tests. The effect of different incident flows on wind pressures
was also examined by numerical simulation. Lastly, the effect
of area density and building distance was separately examined
by controlling the upstream, side, and downstream building distan-
ces one by one or altogether for the fixed area density. For the
numerical simulation, three-dimensional RANS turbulence models
were implemented.
Wind Tunnel Test
Wind tunnel measurements were conducted at the Tokyo Polytech-
nic University in Japan. A 0.1-m cubic building model was used for
the target low-rise building, and as dummy models, same-sized
cubes made of wood were used. The area density, CA, was defined
as the ratio of the total area covered by the building to the total
building lot area, and varied as 6, 11, 16, 25, and 44%. A schematic
of the wind tunnel test is shown in Fig. 1. Half the wind tunnel was
used as an incident flow generating section using spires, barriers,
1
Research Professor, School of Civil, Environmental and Architectural
Engineering, Korea Univ., 145, Anam-ro, Seongbuk-gu, Seoul 136-701,
Korea (corresponding author). E-mail: gentle95@gmail.com
2
Professor, Wind Engineering Research Center, Tokyo Polytechnic
Univ., 1583 Iiyama, Atsugi, Kanagawa 243-0297, Japan.
Note. This manuscript was submitted on July 1, 2013; approved on
February 7, 2014; published online on February 10, 2014. Discussion per-
iod open until December 17, 2014; separate discussions must be submitted
for individual papers. This paper is part of the Journal of Aerospace En-
gineering, © ASCE, ISSN 0893-1321/04014082(13)/$25.00© ASCE,
1943-5525/$25.00.
© ASCE 04014082-1 J. Aerosp. Eng.
and three different-sized blocks. The incident flow was measured at
Lf ¼ 0H. To clarify the effects of surrounding buildings, wind
pressure measurements on the isolated model were conducted at
Lf ¼ 0H. After arranging the dummy low-rise models, the wind
pressure measurements for the target model were conducted by
moving it downstream at specified intervals determined by area
density. Here, the term target model is used to indicate the model
surrounded by dummy low-rise buildings to differentiate it from an
isolated model. The dummy models were arranged in a normal pat-
tern (latticed pattern), and the number of measurement points was
dependent on area density. There were nine measurement points for
area densities of 11, 16, and 44%, and six measurement points for
area densities of 6 and 25%. But in the numerical simulation, the
results at two different upstream distances (Lf) were focused on, as
shown in Table 1.
The sampling frequency was 781 Hz, and the measuring time
was adjusted such that 30 samples were obtained. All pressures
from 125 pressure taps were measured simultaneously, and the tub-
ing effects were numerically compensated using the gain and phase
shift characteristics of the pressure measurement system.
As an incident flow at Lf ¼ 0H, a turbulent boundary layer
representing a suburban area (power-law exponent α ¼ 0.2) was
simulated as shown in Figs. 2(a and b). The reference mean wind
speed and turbulence intensity at model height were Uref ≈
7.2 m=s and Iu;H ≈ 23%, respectively. The wind direction was
fixed at 0°, which was normal to the building surface.
Numerical Simulation
Fluent, included in the package of ANSYS 13.0, was used to carry
out numerical simulations. RANS equation [Eq. (1)] and the
continuity equation [Eq. (2)] were used for the turbulent flow of
an incompressible viscous fluid
∂
∂t
ðρUiÞþ
∂
∂xj
ðρUiUjÞ ¼ −
∂P
∂xi
þ
∂
∂xj

μ

∂Ui
∂xj
þ
∂Uj
∂xi
−
2
3
δij
∂Uk
∂xk

þ
∂
∂xj
ð−ρuiujÞ ð1Þ
∂ρ
∂t
þ
∂
∂xj
ðρUiÞ ¼ 0 ð2Þ
where ρ = fluid density; Ui = time averaged velocity; ui = deviation
from time averaged velocity; P = time averaged pressure; μ =
dynamic viscosity of fluid; and −ρuiuj = Reynolds stress tensor.
Standard k-ε Model
The Reynolds stress tensor appears on the right hand side of the
RANS equation as a result of the time averaging process, and
the Reynolds stress tensor can be expressed as Eq. (3) using the
turbulent kinetic energy k (m2=s2) and dissipation rate ε (m2=s3):
−ρuiuj ¼
2
3
ρkδij þ 2μtSij ð3Þ
where
2μt ¼ ρCμ
k2
ε
ð4aÞ
Sij ¼
1
2

∂Ui
∂xj
þ
∂Uj
∂xi

ð4bÞ
Incident flow
generating section
Measurement section
H
Ldist
Measurement points
Target low-rise model
(moves to downstream side)
Spires
Roughness blocks
Incident flow
Dummy low-rise models
Pstatic,local
Upstream distance, Lf (=0H)
Fig. 1. Schematic of wind tunnel test
Table 1. Computational Conditions
Parameters Isolated CA ¼ 6% CA ¼ 11% CA ¼ 16% CA ¼ 25% CA ¼ 44%
Computational domain (X × Z × Y, unit: H) 21 × 10 × 7 49 × 10 × 2 51 × 10 × 1.5 51 × 10 × 1.25 49 × 10 × 1 51 × 10 × 0.75
Target model position (unit: H) 0 8 and 24 6 and 24 5 and 25 8 and 24 6 and 24
Building distance (Ldist, unit: H) — 3 2 1.5 1 0.5
Pressure-velocity coupling Simple
Spatial discretization Quick
Convergence criteria Continuity: 10−6
Others: 10−6
Grid number (X × Z × Y)
Coarse grid 60 × 33 × 39 293 × 19 × 41 336 × 16 × 41 352 × 14 × 41 395 × 12 × 41 416 × 9 × 41
Fine grid 117 × 47 × 52
yþ
Coarse grid 61  yþ  263 57  yþ  395 54  yþ  398 61  yþ  400 54  yþ  401 30  yþ  420
Fine grid 30  yþ
 357
yP (simulation scale, m)
Coarse grid 0.00514 0.00629
Fine grid 0.00262
Grid expansion factor (yi=yiþ1) Less than 1.2
© ASCE 04014082-2 J. Aerosp. Eng.
In Eq. (4), the turbulent kinetic energy k and its dissipation
rate ε are given by the following transport equations [Eqs. (5)
and (6)]:
∂
∂t
ðρkÞ þ
∂
∂xi
ðρkUiÞ ¼
∂
∂xj

μ þ
μt
σk

∂k
∂xj

þ Gk − ρε ð5Þ
∂
∂t
ðρεÞ þ
∂
∂xi
ðρεUiÞ ¼
∂
∂xj

μ þ
μt
σε

∂ε
∂xj

þ C1ε
ε
k
Gk − C2ερ
ε2
k
ð6Þ
In the equations, Gk represents the generation of turbulent
kinetic energy attributable to the mean velocity gradient, calculated
as Eq. (7)
Gk ¼ −ρuiuj
∂Uj
∂xi
ð7Þ
The coefficients Cμ, C1ε, C2ε, σk, and σε are constants, and
the default values are ðCμ; C1ε; C2ε; σk; σεÞ ¼ ð0.09; 1.44; 1.92;
1.0; 1.3Þ.
Renormalized Group Theory k-ε Model
Yakhot and Orszag (1986) proposed a renormalization group
(RNG) k-ε model that is similar in form to the standard k-ε model;
however, it differs by the inclusion of an additional sink term (Rε)
in the transport equation of turbulent dissipation rate, as shown in
Eq. (8). The form of the transport equation of turbulent kinetic
energy remains the same as that of Eq. (5)
∂
∂t
ðρεÞ þ
∂
∂xi
ðρεUiÞ ¼
∂
∂xj

μ þ
μt
σε

∂ε
∂xj

þ C1ε
ε
k
Gk
− C2ερ
ε2
k
− Rε ð8Þ
where
Rε ¼
Cμρη3ð1 − η=η0Þ
1 þ βη3
ε2
k
ð9Þ
η ¼ Sk=ε, S ¼
ffiffiffiffiffiffiffiffiffiffiffiffiffiffi
2SijSij
p
, η0 ¼ 4.38, β ¼ 0.012.
Recommended values for coefficients are ðCμ; C1ε; C2ε;
σk; σεÞ ¼ ð0.0845; 1.42; 1.68; 0.7194; 0.7194Þ.
Boundary Conditions
The modified law-of-the-wall function based on the equation by
Launder and Spalding (1974) were used in combination with
RANS turbulence models, as shown in Eq. (10), to bridge the
viscosity-affected region between the wall and the fully turbulent
region
UPu
u2
τ
¼
1
κ
ln

EuyP
ν

− ΔB ð10Þ
where UP = tangential wind speed in the center point P of the wall-
adjacent cell; E = empirical constant for a smooth wall (≈ 9.793);
ν = kinematic viscosity of the fluid; yP = distance to the center
point P of the wall-adjacent cell; ΔB = roughness function; and u
and uτ = wall-function friction velocities defined as u ¼ C1=4
μ k1=2
P
and u2
τ ¼ τw=ρ, respectively. Here, Cμ is a constant (= 0.09), kP is
turbulent kinetic energy at point P, τw is wall shear stress, and ρ is
fluid density. The roughness function ΔB was calculated by
Eq. (11) for the full-roughness regime (Kþ
S  90)
ΔB ¼
1
κ
lnð1 þ CSKþ
S Þ ð11Þ
where Kþ
S ¼ ρKSu=μ.
KS and CS need to be input to the solver to calculate ΔB using
Eq. (11). Then Eq. (10) is used to evaluate the shear stress at the
wall and other wall functions for turbulent quantities. In the present
work, KS was determined using the relationship between KS and z0
for the full-roughness regime (Blocken et al. 2007)
KS ≅
Ez0
CS
¼ 9.793
z0
CS
ð12Þ
where z0 = aerodynamic roughness length, and is evaluated from
the incident flow by fitting the points to the logarithmic law;
and CS in Eqs. (11) and (12) = parameter that takes into account
the type of roughness with the restriction that CS should lie in
the interval [0,1]. The obtained z0 for the incident flow is
4.76 × 10⁻⁴, and using CS ¼ 1, KS is set to 0.001 for the floor
roughness condition of the wind tunnel. The boundary conditions
of the two sides and the top were modeled as slip walls, which are
zero normal velocity and zero normal gradients of all variables,
and the free outlet boundary condition was used. Inlet profiles
for streamwise mean wind speed, turbulent kinetic energy, and tur-
bulent dissipation rate were simulated using a user-defined func-
tion. Turbulent kinetic energy was obtained considering only the
streamwise fluctuating component (Tominaga et al. 2008a), and
turbulent dissipation rate was obtained assuming local equilibrium
4 6 8 10 12
0
0.2
0.4
0.6
0.8
1
Mean wind speed (m/s)
Height
(m)
Model height
Experiment
Coarse grid
Fine grid
0 0.1 0.2 0.3 0.4
0
0.2
0.4
0.6
0.8
1
Turbulence intensity
(a) (b)
Height
(m)
Model height
0 0.5 1 1.5 2
0
0.2
0.4
0.6
0.8
1
Kinetic energy (m
(c) 2
/s2
)
Height
(m)
Model height
0.1 1 5 10 30 90
0
0.2
0.4
0.6
0.8
1
Dissi
(d) pation rate (m2
/s3
)
Height
(m)
Model height
Fig. 2. Comparison of profiles from wind tunnel test with those from
numerical simulations: (a) mean wind speed; (b) turbulence intensity;
(c) turbulent kinetic energy; (d) turbulent dissipation rate
© ASCE 04014082-3 J. Aerosp. Eng.
of Gk ¼ ε (Tominaga et al. 2008b). Because profiles at the inlet
change as they travel to the downstream side, the profiles at the
inlet were modified considering the profiles at the model position
to fit the incident flow conditions obtained from the wind tunnel
test at Lf ¼ 0H. Lateral and vertical wind speeds are assumed to
be zero. For the simulation of incident flow and isolated model,
two grid systems were employed to examine the grid dependence
of the results: a coarse grid with yþ larger than 61 and a fine grid
with yþ
larger than 30. The yP values are 0.00514 and 0.00262,
respectively, which are larger than the KS value. The profiles at
the model position were simulated in the empty three-dimensional
domain and the comparison with the incident flow from the
wind tunnel test are shown in Fig. 2, showing good agreement
(b)
Inlet Outlet
Dummy
model
Target
model
Dummy
model
Target
model
X
Y
X
Z
(a)
Fig. 3. Examples of grid system for area density of CA ¼ 25%: (a) X-Y section; (b) X-Z section
Fig. 4. Comparison of mean wind pressure coefficients from wind tunnel test with those from numerical simulation: (a) midwidth center; (b) mid-
height center
Table 2. Comparison of Normalized Mean Square Error (NMSE),
Fractional Bias (FB), and Correlation Coefficient (R)
Grids Surfaces
NMSE FB
R for all
points
std
k-ε
RNG
k-ε
std
k-ε
RNG
k-ε
std
k-ε
RNG
k-ε
Fine
grid
Windward surface 0.1 0.01 −0.23 −0.09 0.90 0.97
Roof surface 0.15 0.06 0.36 0.23
Leeward surface 0.04 0.04 0.21 0.19
Coarse
grid
Windward surface 0.08 0.01 −0.21 −0.06 0.91 0.97
Roof surface 0.12 0.06 0.26 0.2
Leeward surface 0.03 0.04 0.18 0.18
© ASCE 04014082-4 J. Aerosp. Eng.
regardless of the yþ
values. Here, the reference wind speed Uref
means the mean wind speed at the model position, not at the inlet
boundary. Other important conditions for numerical simulations are
summarized in Table 1. Fluent solves the governing equations by
means of a collocated grid system using a finite volume method.
Pressure-velocity coupling is solved by using the semi-implicit
method for pressure-linked equations which are based on an
iterative process that includes a solution to a pressure-correction
Fig. 5. Distribution of normalized turbulence kinetic energy k=U2
ref around an isolated model (coarse grid): (a) midwidth center (reprinted from
Journal of Wind Engineering and Industrial Aerodynamics, 46–47, S. Murakami, “comparison of various turbulence models applied to a bluff body,”
pp. 21–36, © 1993, with permission from Elsevier); (b) midwidth center from the standard k-ε model; (c) midwidth center from the RNG k-ε model;
(d) midheight center from the standard k-ε model; (e) midheight center from the RNG k-ε model
0
(a)
(b)
0.03 0.06 0.09 0.12
0
0.2
0.4
0.6
k/Uref
2
rms
C
p
0 0.03 0.06 0.09 0.12
0
0.2
0.4
0.6
k/Uref
2
rms
C
p
Windward (std k-ε)
Side (std k-ε)
Windward (rngk- )
Side (rng k- )
k-ε
Roof (rngk- )
WIND
WIND
(RNG k- )
(RNG k- )
(RNG k- )
Roof (std )
ε
ε
ε
Fig. 6. Relationship between k=U2
ref from numerical simulation and
rms Cp from wind tunnel test: (a) relationships on windward and side
surfaces; (b) relationships on roof surface
-6 -4 -2 0 2 4
-6
-4
-2
0
2
4
peak Cp,numerical
peak
C
p,experiment
Windward, peak factor=5
Side, peak factor=-7
Roof, peak factor=-7
WIND
gmin=-6
gmin=-8
gmax=4
gmax=6
Fig. 7. Comparison of peak Cp from numerical simulations and
experimental results
© ASCE 04014082-5 J. Aerosp. Eng.
equation to satisfy the continuity equation. The advection-differenc-
ing scheme is solved by the quadratic upstream interpolation for
convective kinetics. The sensitivity of the numerical results pri-
marily result from the grid system around the models, provided
the same numerical conditions are given, and the influence of
the grid systems is examined by using two grid systems with differ-
ent normalized distances for the isolated model. In simulating the
target model, a computational domain was reduced considering
the symmetry conditions. One example of a grid system when area
density of CA ¼ 25% is shown in Fig. 3.
Results and Discussion
Numerical Simulation of Isolated Model
Mean wind pressure coefficients are defined as Eq. (13)
C̄p ¼
P̄ − P̄ref
0.5ρU2
ref
ð13Þ
where P̄ = time-averaged surface pressure; and P̄ref = time-
averaged reference static pressure in the computational domain,
54H
36H
24H
18H
12H
6H
H
48H
30H
0H
Lf =
A B C D
-1.2
-0.9
-0.6
-0.3
0
0.3
0.6
mean
wind
pressure
coefficient
Windward Roof Leeward
A B C D
-1.2
-0.9
-0.6
-0.3
0
0.3
0.6
mean
wind
pressure
coefficient
Windward Roof Leeward
H
0H 25H 45H
5H 10H 15H 20H 30H 50H
Lf =
A B C D
-1.2
-0.9
-0.6
-0.3
0
0.3
0.6
mean
wind
pressure
coefficient
Windward Roof Leeward
A B C D
-1.2
-0.9
-0.6
-0.3
0
0.3
0.6
mean
wind
pressure
coefficient
Windward Roof Leeward
Lf = 0H 30H 48H
H
6H 12H 18H 24H 36H 54H
A B C D
-1.2
-0.9
-0.6
-0.3
0
0.3
0.6
mean
wind
pressure
coefficient
Windward Roof Leeward
B C D
-1.2
-0.9
-0.6
-0.3
0
0.3
0.6
mean
wind
pressure
coefficient
Windward Roof Leeward
experiment Lf/H=5
std k- Lf/H=5
rng k- Lf/H=5
experiment Lf/H=24
std k- Lf/H=24
rng k- Lf/H=24
experiment Lf/H=6
std k-ε Lf/H=6
rng k- Lf/H=6
experiment Lf/H=24
std k- Lf/H=24
rng k- Lf/H=24
experiment Lf/H=6
std k- Lf/H=6
rng k- Lf/H=6
A
WIND D
C
B
A
WIND D
C
B
A
WIND D
C
B
A
WIND D
C
B
A
WIND D
C
B
A
WIND D
C
B
experiment Lf/H=25
std k- Lf/H=25
rng k- Lf/H=25
RNG k- RNG k-
RNG k-
RNG k-
RNG k- RNG k-
ε
ε
ε
ε
ε
ε
ε
ε
ε
ε
ε
A
(a) (b)
(c) (d)
(e) (f)
Fig. 8. Comparison of mean wind pressure coefficients when CA ¼ 11%, CA ¼ 16%, and CA ¼ 44% for midwidth center: (a) CA ¼ 11% at
Lf=H ¼ 6; (b) CA ¼ 11% at Lf=H ¼ 24; (c) CA ¼ 16% at Lf=H ¼ 5; (d) CA ¼ 16% at Lf=H ¼ 25; (e) CA ¼ 44% at Lf=H ¼ 6;
(f) CA ¼ 44% at Lf=H ¼ 24
© ASCE 04014082-6 J. Aerosp. Eng.
which is at exactly the same position as the pitot tube in the wind
tunnel test.
Fig. 4 compares the mean wind pressure coefficients from the
wind tunnel test with those from the numerical simulation for
coarse and fine grids. Differences are observed near the stagnation
point on the windward surface and the leading edges on the roof
and side surfaces in which large suctions occur due to the separated
shear layer. On the leeward surface, the simulation results show
slightly smaller absolute values than the experimental values. In
different turbulence models, clear differences are also observed
near the stagnation point and leading edges. For the standard k-ε
model (in the legend std k-ε), the mean wind pressure coefficient
near the stagnation point is larger than unity, which is theoretically
impossible and which is also much larger than the experimental
values. Contrary to the results of standard k-ε model, those of
RNG k-ε model show relatively good agreement with the experi-
mental results on the windward surface. On the roof and side sur-
faces, the variation trend of the RNG k-ε model is similar to that of
the experimental value, but the values are much smaller than the
experimental results and standard k-ε model results. Focusing
on the smallest mean wind pressure coefficient (larger absolute
value), the standard k-ε model results in slightly conservative val-
ues. On the leeward surface, there is little difference between the
two turbulence models. Almost the same results were obtained for
the two different grids, indicating that the simulation results are
very dependent on the turbulence models, but not on the grid sys-
tem when yþ
is less than 61.
Wind pressure coefficients were compared quantitatively using
three statistical parameters, normalized mean square error [NMSE,
Eq. (14)], fractional bias [FB, Eq. (15)], and correlation coefficients
(R), and the results are summarized in Table 2. In comparison, the
numerical results corresponding to pressure tap positions were
selected. NMSE indicates a value of normalized discrepancies
between the computed (Ci) and experimental (Ei) values, and FB
gives information about overestimation (negative value of FB) or
underestimation (positive value of FB)
NMSE ¼
1=n
Pn
i¼1 ðEi − CiÞ2
1=n
Pn
i¼1ðEiCiÞ
ð14Þ
FB ¼
ðEi − CiÞ
0.5ðEi þ CiÞ
ð15Þ
As shown in Table 2, the NMSE of the RNG k-ε model is very
small compared with those of the standard k-ε model (std k-ε in
Table 2) on the windward and roof surfaces, whereas that on
the leeward surface is almost the same. As expected, the FB of
the windward surface is negative, whereas those of the roof and
Fig. 9. Comparison of normalized turbulence kinetic energy k=U2
ref for different area densities (CA ¼ 11%, CA ¼ 16%, and CA ¼ 44%) at similar
upstream distances (Lf=H ¼ 25 for CA ¼ 16% and Lf=H ¼ 24 as for others) (the darkest-shaded square indicates a target low-rise building, and the
lightest-shaded rectangles at both sides indicate a part of dummy models): (a) CA ¼ 11% from the standard k-ε model; (b) CA ¼ 11% from the RNG
k-ε model; (c) CA ¼ 16% from the standard k-ε model; (d) CA ¼ 16% from the RNG k-ε model; (e) CA ¼ 44% from the standard k-ε model;
(f) CA ¼ 44% from the RNG k-ε model
(a) (b)
0 3 6 9 12
0
0.2
0.4
0.6
0.8
1
Mean wind speed (m/s)
Height
(m)
Model
height
α =0.1
α =0.2
α =0.3
0 0.1 0.2 0.3 0.4 0.5
0
0.2
0.4
0.6
0.8
1
Turbulence intensity
Height
(m)
Model
height
α =0.1
α =0.2
α =0.3
Fig. 10. Profiles of mean wind speed with different power-law expo-
nents and corresponding turbulent intensity: (a) mean wind speed;
(b) turbulence intensity
© ASCE 04014082-7 J. Aerosp. Eng.
leeward surfaces are positive, indicating that the numerical results
are overestimated for the windward surface and underestimated for
the roof and leeward surfaces. The FB of the RNG k-ε model is
smaller than that of the standard k-ε model, showing especially
large differences on the windward surface. Like NMSE, FB shows
little difference on the leeward surface. Similar observations can be
made for correlation coefficient R. For the different grids, the
NMSE and FB obtained from the coarse grid are smaller than those
obtained from the fine grid, implying that the numerical simulation
using a coarse grid better corresponded to the experimental results,
but the differences between them are not significant.
The distributions of normalized turbulent kinetic energy k=U2
ref
for the coarse grid are shown in Fig. 5 together with Murakami’s
(1993) experimental result. The results obtained from the standard
k-ε model are quite different from the experimental results. In par-
ticular, the value of k=U2
ref is highly overestimated near the leading
edge on the roof surface, which causes a large discrepancy in pres-
sure distributions, as shown in Fig. 4(a). This overestimation also
H
48H
32H
0H
Lf = 8H 16H 24H
A B C D
-1.2
-0.9
-0.6
-0.3
0
0.3
0.6
mean
wind
pressure
coefficient
Windward Roof Leeward
A B C D
-1.2
-0.9
-0.6
-0.3
0
0.3
0.6
mean
wind
pressure
coefficient
Windward Side Leeward
H
0H 25H 45H
5H 10H 15H 20H 30H 50H
Lf =
A B C D
-1.2
-0.9
-0.6
-0.3
0
0.3
0.6
mean
wind
pressure
coefficient
Windward Roof Leeward
A B C D
-1.2
-0.9
-0.6
-0.3
0
0.3
0.6
mean
wind
pressure
coefficient
Windward Side Leeward
Lf = 0H 30H 48H
H
6H 12H 18H 24H 36H 54H
A B C D
-1.2
-0.9
-0.6
-0.3
0
0.3
0.6
mean
wind
pressure
coefficient
Windward Roof Leeward
A B C D
-1.2
-0.9
-0.6
-0.3
0
0.3
0.6
mean
wind
pressure
coefficient
Windward Side Leeward
A
WIND D
C
B
WIND
B
A
D
C
A
WIND D
C
B
WIND
B
A
D
C
A
WIND D
C
B
WIND
B
A
D
C
α=0.1
α=0.2
α=0.3
α=0.1
α=0.2
α=0.3
α=0.1
α=0.2
α=0.3
α=0.1
α=0.2
α=0.3
α=0.1
α=0.2
α=0.3
α=0.1
α=0.2
α=0.3
(a)
(b)
(c)
Fig. 11. Comparison of mean wind pressure coefficients for different incident flows at similar upstream distances: (a) Lf=H ¼ 24 when CA ¼ 6%
(left: midwidth center, right: midheight center); (b) Lf=H ¼ 25 when CA ¼ 16% (left: midwidth center, right: midheight center); (c) Lf=H ¼ 24
when CA ¼ 44% (left: midwidth center, right: midheight center)
© ASCE 04014082-8 J. Aerosp. Eng.
causes the models to underpredict the formation of the reverse flow
on the roof and side of the building. However, the RNG k-ε model
predicts relatively well, showing similar values to the experimental
results. The differences in distribution of normalized turbulent ki-
netic energy, however, disappear in the simulation of a target model
in a large group.
Using the numerical results obtained from the RNG k-ε model
with the coarse grid, prediction of peak pressure coefficients on the
windward, side, and roof surfaces were attempted. In the experi-
ment, a large max Cp was obtained near the stagnation points and
large absolute values of min Cp were obtained at pressure taps near
the edges on the side and roof surfaces. Thus, for the pressure taps
shown as solid thick lines in Figs. 6(a and b), the relationship be-
tween normalized turbulent kinetic energy (k=U2
ref) from numerical
simulation and fluctuating wind pressure coefficients (rms Cp)
from the wind tunnel test were examined, and the results are shown
in Fig. 6(a) for the windward and side surfaces and in Fig. 6(b) for
the roof surface. For the relationship on the windward and side sur-
faces, there is a linear relationship, showing no clear difference be-
tween turbulence models, except that the normalized turbulent
kinetic energies from the standard k-ε model are generally larger
than those of the RNG k-ε model. However, for the relationship
on the roof surface, there are clear differences between turbulence
models, originating from the overestimation of turbulent kinetic en-
ergy for the standard k-ε model. It is surprising that a very clear
linear relationship exists for the RNG k-ε model. Using this linear
relationships, peak Cp values were obtained from mean wind pres-
sure coefficients from Eq. (13), normalized turbulent kinetic energy
(k=U2
ref) and various peak factors (g). The comparisons are shown
in Fig. 7, showing good agreement with the experimental data when
gmax ¼ 5 for windward and gmin ¼ −7 for the side and roof surfa-
ces. The results imply that there is a possibility for evaluating peak
Cp from numerical simulation using the RNG k-ε model when the
peak factors were given appropriately. Here, the peak factors (g) are
given arbitrarily, and discussion on peak factor is outside the scope
of the present work.
From the aforementioned results, it can be said that there is clear
dependence of wind pressures on turbulence models, but little
dependence on grid, giving almost identical results for the grid
system with yþ  ð30 ∼ 61Þ. Thus, simulation of the target model
surrounded by a large group of dummy models was conducted
using the grid system with ð30 ∼ 61Þ  yþ
 ðapproximately 400Þ
as shown in Table 1.
Numerical Simulation of Target Model
Fig. 8 compares mean wind pressure coefficients derived from
wind tunnel tests (solid and open circles) with those of the standard
k-ε model (solid and open squares) and the RNG k-ε model (solid
and open stars) at midwidth center near Lf=H ¼ 6 and 24 for vari-
ous area densities. For all area densities, the variation trends of the
numerical results are similar to those of the experimental results,
and correspondence improves as area density increases. For exam-
ple, the mean wind pressure coefficients on the windward surface
decrease with area density, and at higher area density the coeffi-
cients at all surfaces become similar. However, large differences
were still found on the windward surface and near the separation
region as for the isolated model, showing smaller absolute values
than the experimental results. One interesting point is that the dif-
ferences between the turbulence models are generally small for all
surfaces and area densities.
Flow fields among and above the low-rise buildings are highly
random and characterized by fluctuating flows as shown previ-
ously. Modeling of fluctuating flows corresponds to incorporating
the effects of turbulent motion, and there are many turbulent models
available to deal with these effects. Although the RANS turbulence
models are able to reproduce the overall flow pattern around the
model with a relatively fine grid (Santiago et al. 2007; Lien and
Yee 2004), their most significant shortcoming is their prediction
of the pressure field on the model. Because the pressure distribution
strongly correlates with the turbulence statistics in the flow field
around the building, the discrepancies in the pressure field lead
to significant changes in the distribution of turbulent kinetic energy
around the building, as shown in Fig. 5, especially for the standard
k-ε model. In the simulation of the isolated model, the turbulent
kinetic energy of the standard k-ε model is highly overestimated
near the leading edge on the roof surface. This is primarily caused
by failure in modeling the production term of turbulent energy be-
cause of large strain-rate tensor Sij [Eq. (4a)], which is a function of
slope of mean wind speeds (∂Ui=∂xj and ∂Uj=∂xi), resulting in
large eddy viscosity. In addition, the distributions of mean pressure
coefficients are fairly insensitive to which RANS model is chosen,
Isolated model CA=6% CA=11% CA=16% CA=25% CA=44%
(a)
(b)
pos.
neg.
neg.
mean Cp
0.5 1
CA=0% pos.
neg. neg.
mean Cp
0.5 1
6% pos.
neg.
neg.
mean Cp
0.5 1
16% pos.
neg. neg.
mean Cp
0.5 1
11% neg.
neg.
neg.
mean Cp
0.5 1
25%
neg.
neg.
neg.
mean Cp
0.5 1
44%
rms Cp
0.5 1
CA=0%
rms Cp
0.5 1
6%
rms Cp
0.5 1
11%
rms Cp
0.5 1
16%
rms Cp
0.5 1
25%
rms Cp
0.5 1
44%
Ldist 3H 2H 1.5H 1H 0.5H
Fig. 12. Variation of mean and fluctuating wind pressure coefficients at similar upstream distance for various area densities: (a) variation of mean
wind pressure coefficients; (b) variation of fluctuating wind pressure coefficients
© ASCE 04014082-9 J. Aerosp. Eng.
once the standard k-ε model was eliminated (Liu et al. 2013), which
is attributed to differences in the modeling procedure adopted in the
RANS models. Because the flow properties around the building
change significantly because of stagnation, separation, and recircu-
lation, highly anisotropic and unsteady flow features are expected
to occur around the model. The standard k-ε model does not suc-
cessfully capture the anisotropy of turbulence and flow unsteadi-
ness as they are based on the isotropic eddy viscosity modeling
and the steady state flow equations. The inclusion of an anisotropic
term into the dissipation equation of the RNG k-ε turbulence model
slightly improves the prediction of the wind pressure coefficients,
but there are still some problems in predicting the unsteady flow
features.
But in the numerical simulation of a large group of low-rise
buildings, the slope of the mean wind speeds and the mean wind
speeds themselves between buildings decrease with increasing area
density. Thus, the overestimated turbulent kinetic energy of the
standard k-ε model decreases largely in the simulation of the target
model with increasing area density, resulting in similar distributions
to those of the RNG k-ε model with increasing area density, as
shown in Fig. 9. The decrease in turbulent kinetic energy of the
standard k-ε model is remarkable, making little differences in pres-
sure distributions from the RNG k-ε model, as shown in Fig. 8.
Unsteady simulations like large eddy simulation are very attrac-
tive and prerequisite methods, especially in the wind resistant
design of buildings in terms of their accuracy in predicting aero-
dynamic coefficients; however, in the large eddy simulation, it is
impossible to use symmetry boundary conditions for the top and
two sides of the computational domain, which gives a larger com-
putation domain, and hence a larger number of meshes and much
calculation time. The computational cost becomes significant when
compared with RANS simulations, making RANS simulations still
attractive. It is also possible to directly resolve the whole spectrum
of turbulent scales using direct numerical simulation; however, it is
not feasible for practical engineering problems as the mesh sizes are
computationally prohibitive for high Reynolds numbers.
The aforementioned results were obtained from a turbulent
boundary layer whose power-law exponent is 0.2 (Fig. 2). To
examine the effect of different incident flows on wind pressures
by numerical simulation, two different turbulent boundary layers
whose power-law exponents are 0.1 and 0.3 were implemented
in the numerical simulation. Profiles of mean wind speed and tur-
bulence intensity at Lf ¼ 0H are shown in Fig. 10. Reference mean
wind speeds are Uref;α¼0.1 ≈ 9.5 m=s, Uref;α¼0.2 ≈ 7.2 m=s, and
Uref;α¼0.3 ≈ 5.3 m=s, and are used for normalization of wind pres-
sures. The corresponding turbulence intensities are Iu;H;α¼0.1 ≈
0.17, Iu;H;α¼0.2 ≈ 0.23, and Iu;H;α¼0.3 ≈ 0.32.
The results are shown in Fig. 11 for three area densities
(CA ¼ 6%, CA ¼ 16%, and CA ¼ 44%) at similar upstream distan-
ces (Lf=H ¼ 24 and 25). Because only half of the target model was
used in the numerical simulation, the results from half the wind-
ward and leeward surfaces were used for the midheight center.
Although there was a slight difference on the windward surface
when CA ¼ 6% between the flow with α ¼ 0.1 and others, there
was little difference on other surfaces when CA ¼ 6% and other
area densities. The pressure distributions at other upstream distan-
ces (Lf=H ¼ 5, 6, and 8) show similar results, indicating the effect
of the incident flow is negligible when the heights of the dummy
models and target model are similar.
Fig. 12 shows the experimental results of mean and fluctuating
pressure distributions on various area densities at similar upstream
distances (Lf=H ¼ 25 for CA ¼ 16%, and Lf=H ¼ 24 as for other
area densities. It is very apparent that there is a decrease in wind
loads as the area density increases, but in their wind tunnel test, the
building distances (Ldist) were set automatically once the area den-
sities were determined (Table 2). This indicates that in the variation
of pressure distributions shown in Fig. 12, it is impossible to clarify
in which either area density (CA) or building distance (Ldist) is more
influential on the decrease in wind loads. Thus, to examine the ef-
fect of area density and building distance separately, the following
numerical simulations were made:
• Case 1(a): Only upstream buildings closed to Ldist ¼ 1.5H
(from Ldist ¼ 3H) for fixed CA ¼ 6%
1.5H 1.5H
3H
3H
3H
3H
3H
1.5H
1.5H
1.5H
3H
3H
3H
3H
1.5H
1.5H
1.5H
1.5H
1.5H
1.5H
1.5H 1.5H
(a)
(b)
(c)
(d)
(e)
Fig. 13. Examples of modified arrangement of building distance
(Ldist ¼ 1.5H for fixed area density of CA ¼ 6%; the darkest-shaded
building indicates target building; the lightest-shaded buildings indi-
cate dummy buildings; and medium-shaded buildings indicate new
building positions): (a) original arrangement for area density of CA ¼
6%; (b) modified arrangement of upstream buildings to Ldist ¼
1.5H; (c) modified arrangement of side buildings to Ldist ¼ 1.5H;
(d) modified arrangement of downstream buildings to Ldist ¼ 1.5H;
(e) modified arrangement of all buildings to Ldist ¼ 1.5H
© ASCE 04014082-10 J. Aerosp. Eng.
• Case 1(b): Only side buildings closed to Ldist ¼ 1.5H for
fixed CA ¼ 6%
• Case 1(c): Only downstream buildings closed to Ldist ¼ 1.5H
for fixed CA ¼ 6%
• Case 1(d): All buildings closed to Ldist ¼ 1.5H for fixed
CA ¼ 6%
• Case 2(a): Only upstream buildings closed to Ldist ¼ 0.5H
(from Ldist ¼ 3H) for fixed CA ¼ 6%
• Case 2(b): Only side buildings closed to Ldist ¼ 0.5H for
fixed CA ¼ 6%
• Case 2(c): Only downstream buildings closed to Ldist ¼ 0.5H
for fixed CA ¼ 6%
• Case 2(d): All buildings closed to Ldist ¼ 0.5H for fixed
CA ¼ 6%
• Case 3(a): Only upstream buildings moved (from Ldist ¼ 0.5H)
to Ldist ¼ 2H for fixed CA ¼ 44%
• Case 3(b): Only side buildings moved to Ldist ¼ 2H for
fixed CA ¼ 44%
• Case 3(c): Only downstream buildings moved to Ldist ¼ 2H for
fixed CA ¼ 44%
• Case 3(d): All buildings moved to Ldist ¼ 2H for fixed
CA ¼ 44%
First, in Case 1(a), only upstream buildings were moved from
Ldist ¼ 3H to Ldist ¼ 1.5H for a fixed area density of CA ¼ 6%, as
shown in Fig. 13(b). The building distance of CA ¼ 6% is Ldist ¼
3H [Fig. 13(a)], and, Ldist ¼ 1.5H is the building distance
when area density is CA ¼ 16%. The simulation results of this
modified building distance (called modified CA ¼ 6% to CA ¼
16%) were compared with those of area density CA ¼ 16% (called
original CA ¼ 16%). Similarly, in Case 1(b) [Fig. 13(c)], Case 1(c)
[Fig. 13(d)], and Case 1(d) [Fig. 13(e)], only side, downstream, and
all buildings were moved to Ldist ¼ 1.5H, and the simulation re-
sults were again compared with those of the original CA ¼ 16%.
In Case 2, the building distance was moved to Ldist ¼ 0.5H, and
the simulation results (called modified CA ¼ 6% to CA ¼ 44%)
were compared with those of (original) area density CA ¼ 44%
(called original CA ¼ 44%). As the opposite case of Case 1 and
Case 2, in Case 3 for the fixed area density of CA ¼ 44%, only
upstream [Case 3(a)], side [Case 3(b)], downstream [Case 3(c)],
and all [Case 3(d)] buildings moved from Ldist ¼ 0.5H to Ldist ¼
2H, respectively, and the results of the modified CA ¼ 44% to
CA ¼ 11% were compared with those of the original modified
CA ¼ 11%.
The simulation results are shown in Fig. 14 for Case 1, Fig. 15
for Case 2, and Fig. 16 for Case 3. For Fig. 14(a) when only the
upstream buildings were closed to Ldist ¼ 1.5H, the pressure dis-
tributions are very close to those of the original CA ¼ 16%, indi-
cating that the upstream building distance has more influence on
the wind pressures than area density. When only side buildings
were closed to Ldist ¼ 1.5H [Fig. 14(b)], the pressure distributions
on the roof and leeward surfaces are very similar to the original
CA ¼ 16%, and when only downstream buildings were closed to
Ldist ¼ 1.5H [Fig. 14(c)], there is no change in the pressure distri-
butions, showing similar values to the original CA ¼ 6%. When all
buildings were closed to Ldist ¼ 1.5H [Fig. 14(d)], again the pres-
sure distributions are very close to those of the original CA ¼ 16%.
Similar observations were made in Case 2, as shown in Fig. 15, and
this indicates that when the building distances were small, the wind
pressures were mostly influenced by the upstream buildings, and
next by the side buildings. The effect of downstream buildings
is negligible, indicating that the area density has more influence on
the wind pressures.
Fig. 16 shows the results when the building distances are
large for a fixed area density of CA ¼ 44%. It seems that the up-
stream buildings have some influence on the wind pressures, but
the degree of influence is quite different from that for Case 1(a)
[Fig. 14(a)], and Case 2(a) [Fig. 15(a)], and there are no changes
in wind pressures when only side [Fig. 16(b)] and downstream
[Fig. 16(c)] buildings were moved to Ldist ¼ 2H. Only the pressure
distributions of the modified CA ¼ 44% to CA ¼ 11% when all
buildings moved to Ldist ¼ 2H show very similar results to the
original CA ¼ 11%, indicating that in highly dense areas, even
(a) (b)
(c) (d)
A B C D
-1.2
-0.9
-0.6
-0.3
0
0.3
0.6
mean
wind
pressure
coefficient
Windward Roof Leeward
A B C D
-1.2
-0.9
-0.6
-0.3
0
0.3
0.6
mean
wind
pressure
coefficient
Windward Roof Leeward
A B C D
-1.2
-0.9
-0.6
-0.3
0
0.3
0.6
mean
wind
pressure
coefficient
Windward Roof Leeward
A B C D
-1.2
-0.9
-0.6
-0.3
0
0.3
0.6
mean
wind
pressure
coefficient
Windward Roof Leeward
A
WIND D
C
B
Original CA=6%
Original CA=16%
Modified CA=6% to CA=16%
Fig. 14. Comparison of mean wind pressure coefficients from modified CA ¼ 6–16% with original CA ¼ 16%: (a) Case 1(a) – only windward
buildings; (b) Case 1(b) – only side buildings; (c) Case 1(c) – only leeward buildings; (d) Case 1(d) – all buildings
© ASCE 04014082-11 J. Aerosp. Eng.
when the building distances increase, the effect of area density
remains quite large.
Concluding Remarks
RANS turbulence models based on the finite volume method were
used to investigate the characteristics of wind pressures on an
isolated and a target model in a large group. From the numerical
simulations, the following conclusions can be drawn.
Mean wind pressure coefficients of the isolated model obtained
from the RNG k-ε model match well with those from the pressure
measurement. However, for the target model in a large group, the
differences between turbulence models were very small, and the
correspondence to experimental data was generally good, but still
showed some discrepancies near windward and large suction areas.
(a) (b)
(c) (d)
A B C D
mean
wind
pressure
coefficient
Windward Side Leeward
B C D
mean
wind
pressure
coefficient
Windward Side Leeward
A B C D
mean
wind
pressure
coefficient
Windward Side Leeward
A B C D
mean
wind
pressure
coefficient
Windward Side Leeward
WIND
B
A
D
C
Original CA=6%
Original CA=44%
Modified CA=6% to CA=44%
-1.2
-0.9
-0.6
-0.3
0
0.3
0.6
A
-1.2
-0.9
-0.6
-0.3
0
0.3
0.6
-1.2
-0.9
-0.6
-0.3
0
0.3
0.6
-1.2
-0.9
-0.6
-0.3
0
0.3
0.6
Fig. 15. Comparison of mean wind pressure coefficients from modified CA ¼ 6–44% with original CA ¼ 44%: (a) Case 2(a) – only windward
buildings; (b) Case 2(b) – only side buildings; (c) Case 2(c) – only leeward buildings; (d) Case 2(d) – all buildings
(a) (b)
(c) (d)
A B C D
-1.2
-0.9
-0.6
-0.3
0
0.3
0.6
mean
wind
pressure
coefficient
Windward Roof Leeward
A B C D
-1.2
-0.9
-0.6
-0.3
0
0.3
0.6
mean
wind
pressure
coefficient
Windward Side Leeward
A B C D
-1.2
-0.9
-0.6
-0.3
0
0.3
0.6
mean
wind
pressure
coefficient
Windward Roof Leeward
B C D
-1.2
-0.9
-0.6
-0.3
0
0.3
0.6
mean
wind
pressure
coefficient
Windward Side Leeward
A
WIND D
C
B
WIND
B
A
D
C
A
WIND D
C
B
WIND
B
A
D
C
Original CA=44%
Original CA=11%
Modified CA=44% to CA=11%
A
Fig. 16. Comparison of mean wind pressure coefficients from modified CA ¼ 44–11% with original CA ¼ 11%: (a) Case 3(a) – only windward
buildings; (b) Case 3(b) – only side buildings; (c) Case 3(a) – only windward buildings; (d) Case 3(b) – only side buildings
© ASCE 04014082-12 J. Aerosp. Eng.
Using a limited number of positions on the windward, side and
roof surfaces, the relationship between rms Cp and k=U2
ref was ex-
amined to try to predict peak Cp. The results imply that it may be
possible to evaluate peak Cp from numerical simulation using the
RNG k-ε model, if appropriate the peak factors are given.
The effect of different incident flows was examined, and no no-
ticeable effect on the mean pressures on target model in large group
was identified.
When the building distances (Ldist) decreased, the wind pres-
sures were mostly influenced by upstream buildings, and next
by side buildings. The effect of downstream buildings is almost
negligible, indicating that the area density has more influence
on the wind pressures. But when the building distances (Ldist) in-
crease, the effect of upstream buildings decreases, and those of side
and downstream buildings is almost negligible, indicating that in
highly dense areas, even if the building distances increase, the
effect of area density remains quite large.
Acknowledgments
This study was funded by the Ministry of Education, Culture,
Sports, Science and Technology, Japan, through the Global
Center of Excellence Program, 2008-2012. The authors gratefully
acknowledge their support.
References
Blocken, B., Carmeliet, J., and Stathopoulos, T. (2007). “CFD evaluation
of wind speed conditions in passages between parallel buildings-effect
of wall-function roughness modifications for the atmospheric boundary
layer flow.” J. Wind Eng. Ind. Aerodyn., 95(9–11), 941–962.
Chang, C. H. (2001). “Numerical and physical modeling of bluff body
flow and dispersion in urban street.” Ph.D. dissertation, Dept. of Civil
Engineering, Colorado State Univ., Fort Collins, CO.
Chang, C. H., and Meroney, R. N. (2003a). “Concentration distributions
from a point source within urban street canyons: Wind tunnel and com-
putational data.” J. Wind Eng. Ind. Aerodyn., 91(9), 1141–1154.
Chang, C. H., and Meroney, R. N. (2003b). “The effects of surroundings
with different separation distances on surface pressures on low-rise
buildings.” J. Wind Eng. Ind. Aerodyn., 91(8), 1039–1050.
Gad, I. A. M., Nasief, M. M., Aaziz, S. S. A., and Osman, A. A. (2009).
“Modeling of air pollutant dispersion in street canyons in cross-wind.”
13th Int. Conf. on Aerospace Science and Aviation Technology,
Egyptian Ministry of Defense, Cairo, Egypt, 1–13.
Ho, T. C. E., Surry, D., and Davenport, A. G. (1991). “The variability of low
building wind loads due to surroundings.” J. Wind Eng. Ind. Aerodyn.,
38(2–3), 297–310.
Kim, Y. C., Yoshida, A., and Tamura, Y. (2012). “Characteristics of surface
wind pressures on low-rise building located among large group of sur-
rounding buildings.” Eng. Struct., 35(2012), 18–28.
Kim, Y. C., Yoshida, A., and Tamura, Y. (2013). “Influence of surrounding
buildings on wind loads acting on low-rise building.” J. Struct. Eng.,
10.1061/(ASCE)ST.1943-541X.0000625, 275–283.
Launder, B. E., and Spalding, D. B. (1974). “The numerical computation of
turbulent flows.” Comput. Meth. Appl. Mech. Eng., 3(2), 269–289.
Lee, Y. S., and Kim, J. J. (2009). “A CFD modeling on the effect of building
density on urban flow.” 7th Int. Conf. on Urban Climate, Tokyo Institute
of Technology, Tokyo, Japan, 1–4.
Lien, F. S., and Yee, E. (2004). “Numerical modeling of the turbulent
flow developing within and over a 3-D building array, part I: A high-
resolution Reynolds-averaged Navier-Stokes approach.” Boundary
Layer Meteorol., 112(3), 427–466.
Liu, X., Niu, J., and Kwok, K. C. S. (2013). “Evaluation of RANS turbu-
lence models for simulating wind-induced mean pressures and disper-
sions around a complex-shaped high-rise building.” Build. Simul., 6(2),
151–164.
Meroney, R. N., and Chang, C. H. (2001). “Fluid modeling and numerical
modeling results from point and line source released in generic arrange-
ments of bluff bodies with street canyon separations.” Proc., Wind
Hazard Mitigation in Urban Area Conf., Tokyo Institute of Polytech-
nics, Atsugi, Japan, 1–8.
Murakami, S. (1993). “Comparison of various turbulence models applied to
a bluff body.” J. Wind Eng. Ind. Aerodyn., 46–47, 21–36.
Peterka, J. A., and Cermak, J. E. (1976). “Adverse wind loading induced by
adjacent buildings.” J. Struct. Div., 102(3), 533–548.
Santiago, J. L., Martilli, A., and Martin, F. (2007). “CFD simulation
of airflow over a regular array of cubes, part I: Three-dimensional
simulation of flow and validation with wind-tunnel measurements.”
Boundary Layer Meteorol., 122(3), 609–634.
Tominaga, Y., et al. (2008a). “AIJ guidelines for practical applications of
CFD pedestrian wind environment around buildings.” J. Wind Eng. Ind.
Aerodyn., 96(10–11), 1749–1761.
Tominaga, Y., Mochida, A., Murakami, S., and Sawaki, S. (2008b). “Com-
parison of various revised k-e models and LES applied to flow around a
high-rise building model with 1∶1∶2 shape placed within the surface
boundary layer.” J. Wind Eng. Ind. Aerodyn., 96(4), 389–411.
Yakhot, V., and Orszag, S. O. (1986). “Renormalization group analysis of
turbulence. I. Basic theory.” J. Sci. Comput., 1(1), 3–51.
© ASCE 04014082-13 J. Aerosp. Eng.
Copyright of Journal of Aerospace Engineering is the property of American Society of Civil
Engineers and its content may not be copied or emailed to multiple sites or posted to a listserv
without the copyright holder's express written permission. However, users may print,
download, or email articles for individual use.

Mais conteúdo relacionado

Semelhante a kim2015.pdf

Prediction of aerodynamic characteristics for slender bluff bodies with nose ...
Prediction of aerodynamic characteristics for slender bluff bodies with nose ...Prediction of aerodynamic characteristics for slender bluff bodies with nose ...
Prediction of aerodynamic characteristics for slender bluff bodies with nose ...vasishta bhargava
 
Analysis of Wind Load Factors and Stability on Sensitive Structures
Analysis of Wind Load Factors and Stability on Sensitive StructuresAnalysis of Wind Load Factors and Stability on Sensitive Structures
Analysis of Wind Load Factors and Stability on Sensitive StructuresIRJET Journal
 
Numerical and experimental investigation of co shedding vortex generated by t...
Numerical and experimental investigation of co shedding vortex generated by t...Numerical and experimental investigation of co shedding vortex generated by t...
Numerical and experimental investigation of co shedding vortex generated by t...Alexander Decker
 
03302--ICWE14-2015-Experimental and Numerical Evaluation of Micrositing in Co...
03302--ICWE14-2015-Experimental and Numerical Evaluation of Micrositing in Co...03302--ICWE14-2015-Experimental and Numerical Evaluation of Micrositing in Co...
03302--ICWE14-2015-Experimental and Numerical Evaluation of Micrositing in Co...Jussara M. Leite Mattuella
 
Numerical Modelling of Wind Patterns around a Solar Parabolic Trough Collector
Numerical Modelling of Wind Patterns around a Solar Parabolic Trough CollectorNumerical Modelling of Wind Patterns around a Solar Parabolic Trough Collector
Numerical Modelling of Wind Patterns around a Solar Parabolic Trough CollectorIJMER
 
Calculation of Fluid Dynamic for Wind Flow around Reinforced Concrete Walls
Calculation of Fluid Dynamic for Wind Flow around Reinforced Concrete WallsCalculation of Fluid Dynamic for Wind Flow around Reinforced Concrete Walls
Calculation of Fluid Dynamic for Wind Flow around Reinforced Concrete WallsIJERA Editor
 
Effect of mainstream air velocity on velocity profile over a rough flat surface
Effect of mainstream air velocity on velocity profile over a rough flat surfaceEffect of mainstream air velocity on velocity profile over a rough flat surface
Effect of mainstream air velocity on velocity profile over a rough flat surfaceijceronline
 
Trailing edge noise prediction from NACA 0012 and NACA 6320 using empirical p...
Trailing edge noise prediction from NACA 0012 and NACA 6320 using empirical p...Trailing edge noise prediction from NACA 0012 and NACA 6320 using empirical p...
Trailing edge noise prediction from NACA 0012 and NACA 6320 using empirical p...vasishta bhargava
 
IRJET - Wind Analysis of High Rise Buildings
IRJET -  	  Wind Analysis of High Rise BuildingsIRJET -  	  Wind Analysis of High Rise Buildings
IRJET - Wind Analysis of High Rise BuildingsIRJET Journal
 
On the formulation_of_asce7_95_gust_effe
On the formulation_of_asce7_95_gust_effeOn the formulation_of_asce7_95_gust_effe
On the formulation_of_asce7_95_gust_effevijith vasudevan
 
A full experimental and numerical modelling of the practicability of thin foa...
A full experimental and numerical modelling of the practicability of thin foa...A full experimental and numerical modelling of the practicability of thin foa...
A full experimental and numerical modelling of the practicability of thin foa...Mehran Naghizadeh
 
Flow Modeling Based Wall Element Technique
Flow Modeling Based Wall Element TechniqueFlow Modeling Based Wall Element Technique
Flow Modeling Based Wall Element TechniqueCSCJournals
 
Laminar Flow And Turbulence Modeling For Domestic Scale Wind Turbine Siting
Laminar Flow And Turbulence Modeling  For Domestic Scale Wind Turbine SitingLaminar Flow And Turbulence Modeling  For Domestic Scale Wind Turbine Siting
Laminar Flow And Turbulence Modeling For Domestic Scale Wind Turbine Sitingchittaranjang
 
On The Form Factor Prediction Of A Displacement Type Vessel: JBC Case
On The Form Factor Prediction Of A Displacement Type Vessel: JBC CaseOn The Form Factor Prediction Of A Displacement Type Vessel: JBC Case
On The Form Factor Prediction Of A Displacement Type Vessel: JBC CaseIsmail Topal
 
Full paper jbc icame2016
Full paper jbc icame2016Full paper jbc icame2016
Full paper jbc icame2016Uğur Can
 
Numerical investigation of flow characteristics in a
Numerical investigation of flow characteristics in aNumerical investigation of flow characteristics in a
Numerical investigation of flow characteristics in aIAEME Publication
 

Semelhante a kim2015.pdf (20)

Prediction of aerodynamic characteristics for slender bluff bodies with nose ...
Prediction of aerodynamic characteristics for slender bluff bodies with nose ...Prediction of aerodynamic characteristics for slender bluff bodies with nose ...
Prediction of aerodynamic characteristics for slender bluff bodies with nose ...
 
Analysis of Wind Load Factors and Stability on Sensitive Structures
Analysis of Wind Load Factors and Stability on Sensitive StructuresAnalysis of Wind Load Factors and Stability on Sensitive Structures
Analysis of Wind Load Factors and Stability on Sensitive Structures
 
Numerical and experimental investigation of co shedding vortex generated by t...
Numerical and experimental investigation of co shedding vortex generated by t...Numerical and experimental investigation of co shedding vortex generated by t...
Numerical and experimental investigation of co shedding vortex generated by t...
 
2 ashrae chapter7
2 ashrae chapter72 ashrae chapter7
2 ashrae chapter7
 
03302--ICWE14-2015-Experimental and Numerical Evaluation of Micrositing in Co...
03302--ICWE14-2015-Experimental and Numerical Evaluation of Micrositing in Co...03302--ICWE14-2015-Experimental and Numerical Evaluation of Micrositing in Co...
03302--ICWE14-2015-Experimental and Numerical Evaluation of Micrositing in Co...
 
Numerical Modelling of Wind Patterns around a Solar Parabolic Trough Collector
Numerical Modelling of Wind Patterns around a Solar Parabolic Trough CollectorNumerical Modelling of Wind Patterns around a Solar Parabolic Trough Collector
Numerical Modelling of Wind Patterns around a Solar Parabolic Trough Collector
 
Calculation of Fluid Dynamic for Wind Flow around Reinforced Concrete Walls
Calculation of Fluid Dynamic for Wind Flow around Reinforced Concrete WallsCalculation of Fluid Dynamic for Wind Flow around Reinforced Concrete Walls
Calculation of Fluid Dynamic for Wind Flow around Reinforced Concrete Walls
 
Effect of mainstream air velocity on velocity profile over a rough flat surface
Effect of mainstream air velocity on velocity profile over a rough flat surfaceEffect of mainstream air velocity on velocity profile over a rough flat surface
Effect of mainstream air velocity on velocity profile over a rough flat surface
 
Trailing edge noise prediction from NACA 0012 and NACA 6320 using empirical p...
Trailing edge noise prediction from NACA 0012 and NACA 6320 using empirical p...Trailing edge noise prediction from NACA 0012 and NACA 6320 using empirical p...
Trailing edge noise prediction from NACA 0012 and NACA 6320 using empirical p...
 
IRJET - Wind Analysis of High Rise Buildings
IRJET -  	  Wind Analysis of High Rise BuildingsIRJET -  	  Wind Analysis of High Rise Buildings
IRJET - Wind Analysis of High Rise Buildings
 
cfd ahmed body
cfd ahmed bodycfd ahmed body
cfd ahmed body
 
On the formulation_of_asce7_95_gust_effe
On the formulation_of_asce7_95_gust_effeOn the formulation_of_asce7_95_gust_effe
On the formulation_of_asce7_95_gust_effe
 
2392-3449
2392-34492392-3449
2392-3449
 
A full experimental and numerical modelling of the practicability of thin foa...
A full experimental and numerical modelling of the practicability of thin foa...A full experimental and numerical modelling of the practicability of thin foa...
A full experimental and numerical modelling of the practicability of thin foa...
 
Flow Modeling Based Wall Element Technique
Flow Modeling Based Wall Element TechniqueFlow Modeling Based Wall Element Technique
Flow Modeling Based Wall Element Technique
 
Laminar Flow And Turbulence Modeling For Domestic Scale Wind Turbine Siting
Laminar Flow And Turbulence Modeling  For Domestic Scale Wind Turbine SitingLaminar Flow And Turbulence Modeling  For Domestic Scale Wind Turbine Siting
Laminar Flow And Turbulence Modeling For Domestic Scale Wind Turbine Siting
 
On The Form Factor Prediction Of A Displacement Type Vessel: JBC Case
On The Form Factor Prediction Of A Displacement Type Vessel: JBC CaseOn The Form Factor Prediction Of A Displacement Type Vessel: JBC Case
On The Form Factor Prediction Of A Displacement Type Vessel: JBC Case
 
Full paper jbc icame2016
Full paper jbc icame2016Full paper jbc icame2016
Full paper jbc icame2016
 
DIFFUSER ANGLE CONTROL TO AVOID FLOW SEPARATION
DIFFUSER ANGLE CONTROL TO AVOID FLOW SEPARATIONDIFFUSER ANGLE CONTROL TO AVOID FLOW SEPARATION
DIFFUSER ANGLE CONTROL TO AVOID FLOW SEPARATION
 
Numerical investigation of flow characteristics in a
Numerical investigation of flow characteristics in aNumerical investigation of flow characteristics in a
Numerical investigation of flow characteristics in a
 

Último

SOCIAL AND HISTORICAL CONTEXT - LFTVD.pptx
SOCIAL AND HISTORICAL CONTEXT - LFTVD.pptxSOCIAL AND HISTORICAL CONTEXT - LFTVD.pptx
SOCIAL AND HISTORICAL CONTEXT - LFTVD.pptxiammrhaywood
 
BASLIQ CURRENT LOOKBOOK LOOKBOOK(1) (1).pdf
BASLIQ CURRENT LOOKBOOK  LOOKBOOK(1) (1).pdfBASLIQ CURRENT LOOKBOOK  LOOKBOOK(1) (1).pdf
BASLIQ CURRENT LOOKBOOK LOOKBOOK(1) (1).pdfSoniaTolstoy
 
APM Welcome, APM North West Network Conference, Synergies Across Sectors
APM Welcome, APM North West Network Conference, Synergies Across SectorsAPM Welcome, APM North West Network Conference, Synergies Across Sectors
APM Welcome, APM North West Network Conference, Synergies Across SectorsAssociation for Project Management
 
Separation of Lanthanides/ Lanthanides and Actinides
Separation of Lanthanides/ Lanthanides and ActinidesSeparation of Lanthanides/ Lanthanides and Actinides
Separation of Lanthanides/ Lanthanides and ActinidesFatimaKhan178732
 
Ecosystem Interactions Class Discussion Presentation in Blue Green Lined Styl...
Ecosystem Interactions Class Discussion Presentation in Blue Green Lined Styl...Ecosystem Interactions Class Discussion Presentation in Blue Green Lined Styl...
Ecosystem Interactions Class Discussion Presentation in Blue Green Lined Styl...fonyou31
 
Accessible design: Minimum effort, maximum impact
Accessible design: Minimum effort, maximum impactAccessible design: Minimum effort, maximum impact
Accessible design: Minimum effort, maximum impactdawncurless
 
microwave assisted reaction. General introduction
microwave assisted reaction. General introductionmicrowave assisted reaction. General introduction
microwave assisted reaction. General introductionMaksud Ahmed
 
Student login on Anyboli platform.helpin
Student login on Anyboli platform.helpinStudent login on Anyboli platform.helpin
Student login on Anyboli platform.helpinRaunakKeshri1
 
Advanced Views - Calendar View in Odoo 17
Advanced Views - Calendar View in Odoo 17Advanced Views - Calendar View in Odoo 17
Advanced Views - Calendar View in Odoo 17Celine George
 
JAPAN: ORGANISATION OF PMDA, PHARMACEUTICAL LAWS & REGULATIONS, TYPES OF REGI...
JAPAN: ORGANISATION OF PMDA, PHARMACEUTICAL LAWS & REGULATIONS, TYPES OF REGI...JAPAN: ORGANISATION OF PMDA, PHARMACEUTICAL LAWS & REGULATIONS, TYPES OF REGI...
JAPAN: ORGANISATION OF PMDA, PHARMACEUTICAL LAWS & REGULATIONS, TYPES OF REGI...anjaliyadav012327
 
Organic Name Reactions for the students and aspirants of Chemistry12th.pptx
Organic Name Reactions  for the students and aspirants of Chemistry12th.pptxOrganic Name Reactions  for the students and aspirants of Chemistry12th.pptx
Organic Name Reactions for the students and aspirants of Chemistry12th.pptxVS Mahajan Coaching Centre
 
The byproduct of sericulture in different industries.pptx
The byproduct of sericulture in different industries.pptxThe byproduct of sericulture in different industries.pptx
The byproduct of sericulture in different industries.pptxShobhayan Kirtania
 
Q4-W6-Restating Informational Text Grade 3
Q4-W6-Restating Informational Text Grade 3Q4-W6-Restating Informational Text Grade 3
Q4-W6-Restating Informational Text Grade 3JemimahLaneBuaron
 
Presentation by Andreas Schleicher Tackling the School Absenteeism Crisis 30 ...
Presentation by Andreas Schleicher Tackling the School Absenteeism Crisis 30 ...Presentation by Andreas Schleicher Tackling the School Absenteeism Crisis 30 ...
Presentation by Andreas Schleicher Tackling the School Absenteeism Crisis 30 ...EduSkills OECD
 
Beyond the EU: DORA and NIS 2 Directive's Global Impact
Beyond the EU: DORA and NIS 2 Directive's Global ImpactBeyond the EU: DORA and NIS 2 Directive's Global Impact
Beyond the EU: DORA and NIS 2 Directive's Global ImpactPECB
 
Sanyam Choudhary Chemistry practical.pdf
Sanyam Choudhary Chemistry practical.pdfSanyam Choudhary Chemistry practical.pdf
Sanyam Choudhary Chemistry practical.pdfsanyamsingh5019
 
POINT- BIOCHEMISTRY SEM 2 ENZYMES UNIT 5.pptx
POINT- BIOCHEMISTRY SEM 2 ENZYMES UNIT 5.pptxPOINT- BIOCHEMISTRY SEM 2 ENZYMES UNIT 5.pptx
POINT- BIOCHEMISTRY SEM 2 ENZYMES UNIT 5.pptxSayali Powar
 

Último (20)

SOCIAL AND HISTORICAL CONTEXT - LFTVD.pptx
SOCIAL AND HISTORICAL CONTEXT - LFTVD.pptxSOCIAL AND HISTORICAL CONTEXT - LFTVD.pptx
SOCIAL AND HISTORICAL CONTEXT - LFTVD.pptx
 
BASLIQ CURRENT LOOKBOOK LOOKBOOK(1) (1).pdf
BASLIQ CURRENT LOOKBOOK  LOOKBOOK(1) (1).pdfBASLIQ CURRENT LOOKBOOK  LOOKBOOK(1) (1).pdf
BASLIQ CURRENT LOOKBOOK LOOKBOOK(1) (1).pdf
 
APM Welcome, APM North West Network Conference, Synergies Across Sectors
APM Welcome, APM North West Network Conference, Synergies Across SectorsAPM Welcome, APM North West Network Conference, Synergies Across Sectors
APM Welcome, APM North West Network Conference, Synergies Across Sectors
 
Código Creativo y Arte de Software | Unidad 1
Código Creativo y Arte de Software | Unidad 1Código Creativo y Arte de Software | Unidad 1
Código Creativo y Arte de Software | Unidad 1
 
Separation of Lanthanides/ Lanthanides and Actinides
Separation of Lanthanides/ Lanthanides and ActinidesSeparation of Lanthanides/ Lanthanides and Actinides
Separation of Lanthanides/ Lanthanides and Actinides
 
Advance Mobile Application Development class 07
Advance Mobile Application Development class 07Advance Mobile Application Development class 07
Advance Mobile Application Development class 07
 
Ecosystem Interactions Class Discussion Presentation in Blue Green Lined Styl...
Ecosystem Interactions Class Discussion Presentation in Blue Green Lined Styl...Ecosystem Interactions Class Discussion Presentation in Blue Green Lined Styl...
Ecosystem Interactions Class Discussion Presentation in Blue Green Lined Styl...
 
Accessible design: Minimum effort, maximum impact
Accessible design: Minimum effort, maximum impactAccessible design: Minimum effort, maximum impact
Accessible design: Minimum effort, maximum impact
 
microwave assisted reaction. General introduction
microwave assisted reaction. General introductionmicrowave assisted reaction. General introduction
microwave assisted reaction. General introduction
 
Student login on Anyboli platform.helpin
Student login on Anyboli platform.helpinStudent login on Anyboli platform.helpin
Student login on Anyboli platform.helpin
 
INDIA QUIZ 2024 RLAC DELHI UNIVERSITY.pptx
INDIA QUIZ 2024 RLAC DELHI UNIVERSITY.pptxINDIA QUIZ 2024 RLAC DELHI UNIVERSITY.pptx
INDIA QUIZ 2024 RLAC DELHI UNIVERSITY.pptx
 
Advanced Views - Calendar View in Odoo 17
Advanced Views - Calendar View in Odoo 17Advanced Views - Calendar View in Odoo 17
Advanced Views - Calendar View in Odoo 17
 
JAPAN: ORGANISATION OF PMDA, PHARMACEUTICAL LAWS & REGULATIONS, TYPES OF REGI...
JAPAN: ORGANISATION OF PMDA, PHARMACEUTICAL LAWS & REGULATIONS, TYPES OF REGI...JAPAN: ORGANISATION OF PMDA, PHARMACEUTICAL LAWS & REGULATIONS, TYPES OF REGI...
JAPAN: ORGANISATION OF PMDA, PHARMACEUTICAL LAWS & REGULATIONS, TYPES OF REGI...
 
Organic Name Reactions for the students and aspirants of Chemistry12th.pptx
Organic Name Reactions  for the students and aspirants of Chemistry12th.pptxOrganic Name Reactions  for the students and aspirants of Chemistry12th.pptx
Organic Name Reactions for the students and aspirants of Chemistry12th.pptx
 
The byproduct of sericulture in different industries.pptx
The byproduct of sericulture in different industries.pptxThe byproduct of sericulture in different industries.pptx
The byproduct of sericulture in different industries.pptx
 
Q4-W6-Restating Informational Text Grade 3
Q4-W6-Restating Informational Text Grade 3Q4-W6-Restating Informational Text Grade 3
Q4-W6-Restating Informational Text Grade 3
 
Presentation by Andreas Schleicher Tackling the School Absenteeism Crisis 30 ...
Presentation by Andreas Schleicher Tackling the School Absenteeism Crisis 30 ...Presentation by Andreas Schleicher Tackling the School Absenteeism Crisis 30 ...
Presentation by Andreas Schleicher Tackling the School Absenteeism Crisis 30 ...
 
Beyond the EU: DORA and NIS 2 Directive's Global Impact
Beyond the EU: DORA and NIS 2 Directive's Global ImpactBeyond the EU: DORA and NIS 2 Directive's Global Impact
Beyond the EU: DORA and NIS 2 Directive's Global Impact
 
Sanyam Choudhary Chemistry practical.pdf
Sanyam Choudhary Chemistry practical.pdfSanyam Choudhary Chemistry practical.pdf
Sanyam Choudhary Chemistry practical.pdf
 
POINT- BIOCHEMISTRY SEM 2 ENZYMES UNIT 5.pptx
POINT- BIOCHEMISTRY SEM 2 ENZYMES UNIT 5.pptxPOINT- BIOCHEMISTRY SEM 2 ENZYMES UNIT 5.pptx
POINT- BIOCHEMISTRY SEM 2 ENZYMES UNIT 5.pptx
 

kim2015.pdf

  • 1. Simulation of Wind Pressures on a Target Low-Rise Building in Large Group by RANS Turbulence Model Yong Chul Kim1 and Yukio Tamura, M.ASCE2 Abstract: Characteristics of wind pressures on a low-rise building immersed in various building area densities were investigated using three-dimensional Reynolds-Averaged Navier-Stokes (RANS) turbulence models. Wind pressure coefficients obtained from the numerical simulations were compared with those of wind pressure measurements. The results show that for wind pressure coefficients for an isolated model, more reasonable results were obtained when the renormalization group (RNG) k-ε model was used, but for a target model in a large group, there was little difference between wind pressure coefficients obtained from different turbulence models and the effect of different incident flows on wind pressure coefficients was found to be small. Lastly, the effect of area density and building distance was separately examined, showing that the effect of an upstream building was larger than that of any other buildings and area densities. DOI: 10.1061/ (ASCE)AS.1943-5525.0000417. © 2014 American Society of Civil Engineers. Author keywords: Low-rise buildings; Wind tunnel test; Numerical simulation; Pressure coefficient. Introduction Low-rise buildings are normally built in large groups, and the flow field around a building of interest in a group is totally different from that around an isolated building. The significance of this different flow field should be focused on not only structural, but also from environmental viewpoints because the flow field determines wind pressure distributions and the degree of scalar dispersion. Wind pressure measurements for a low-rise building in a large group have been performed by many researchers since the mid- 1970s (Peterka and Cermak 1976; Ho et al. 1991; Kim et al. 2012, 2013). Peterka and Cermak (1976) examined the effect of four nearby octagonal structures on the wind pressure around the cir- cumference of a central circular structure. They observed that adverse effects can be encountered depending on the relative place- ment of structures in the approaching wind. Introducing variations in building geometry may decrease these effects. Ho et al. (1991) studied the effects of surroundings on wind loads on flat-roof low- rise buildings. They considered several cases with different types of immediate surroundings and concluded that with an increase in surrounding obstructions, the mean wind pressures acting on the building decreased as expected, whereas unsteady pressure in- creased. Pressures on the building exhibited large variations, sug- gesting the possibility of large variations in building loads. Most recently, Kim et al. (2012, 2013) measured fluctuating wind pres- sures applied to a cubical low-rise building immersed in various area densities and long upstream distances under suburban flow conditions. After a detailed examination of wind pressures and force characteristics, methodologies of wind load estimation were suggested based on the (zoning) interference factors. The remarkable growth in computer technology has enabled increasing application of numerical simulations to a large group of low-rise buildings (Gad et al. 2009; Lee and Kim 2009; Santiago et al. 2007; Lien and Yee 2004; Chang and Meroney 2003a; Meroney and Chang 2001). Many recent numerical studies have focused on the characteristics of flow and pollutant dispersion us- ing various numerical models including the Reynolds stress model, the Spalart-Alamaras model, and the LES model using a fire dynamic simulator (FDS) code, and Reynolds-Averaged Navier- Stokes (RANS) models (Santiago et al. 2007; Chang 2001). Although some previous studies have focused on the characteristics of wind pressures for a target low-rise building in a large group, the simulated area densities have been very limited, mostly 25%. Few studies have focused on the variation of wind pressures on a target low-rise building immersed in various area densities (Chang and Meroney 2003b). The purpose of the present study was to inves- tigate the characteristics of wind pressures on a low-rise building immersed in a large group simulating various area densities ranging from 6 to 44% by comparing numerical simulations with wind tun- nel tests. The effect of different incident flows on wind pressures was also examined by numerical simulation. Lastly, the effect of area density and building distance was separately examined by controlling the upstream, side, and downstream building distan- ces one by one or altogether for the fixed area density. For the numerical simulation, three-dimensional RANS turbulence models were implemented. Wind Tunnel Test Wind tunnel measurements were conducted at the Tokyo Polytech- nic University in Japan. A 0.1-m cubic building model was used for the target low-rise building, and as dummy models, same-sized cubes made of wood were used. The area density, CA, was defined as the ratio of the total area covered by the building to the total building lot area, and varied as 6, 11, 16, 25, and 44%. A schematic of the wind tunnel test is shown in Fig. 1. Half the wind tunnel was used as an incident flow generating section using spires, barriers, 1 Research Professor, School of Civil, Environmental and Architectural Engineering, Korea Univ., 145, Anam-ro, Seongbuk-gu, Seoul 136-701, Korea (corresponding author). E-mail: gentle95@gmail.com 2 Professor, Wind Engineering Research Center, Tokyo Polytechnic Univ., 1583 Iiyama, Atsugi, Kanagawa 243-0297, Japan. Note. This manuscript was submitted on July 1, 2013; approved on February 7, 2014; published online on February 10, 2014. Discussion per- iod open until December 17, 2014; separate discussions must be submitted for individual papers. This paper is part of the Journal of Aerospace En- gineering, © ASCE, ISSN 0893-1321/04014082(13)/$25.00© ASCE, 1943-5525/$25.00. © ASCE 04014082-1 J. Aerosp. Eng.
  • 2. and three different-sized blocks. The incident flow was measured at Lf ¼ 0H. To clarify the effects of surrounding buildings, wind pressure measurements on the isolated model were conducted at Lf ¼ 0H. After arranging the dummy low-rise models, the wind pressure measurements for the target model were conducted by moving it downstream at specified intervals determined by area density. Here, the term target model is used to indicate the model surrounded by dummy low-rise buildings to differentiate it from an isolated model. The dummy models were arranged in a normal pat- tern (latticed pattern), and the number of measurement points was dependent on area density. There were nine measurement points for area densities of 11, 16, and 44%, and six measurement points for area densities of 6 and 25%. But in the numerical simulation, the results at two different upstream distances (Lf) were focused on, as shown in Table 1. The sampling frequency was 781 Hz, and the measuring time was adjusted such that 30 samples were obtained. All pressures from 125 pressure taps were measured simultaneously, and the tub- ing effects were numerically compensated using the gain and phase shift characteristics of the pressure measurement system. As an incident flow at Lf ¼ 0H, a turbulent boundary layer representing a suburban area (power-law exponent α ¼ 0.2) was simulated as shown in Figs. 2(a and b). The reference mean wind speed and turbulence intensity at model height were Uref ≈ 7.2 m=s and Iu;H ≈ 23%, respectively. The wind direction was fixed at 0°, which was normal to the building surface. Numerical Simulation Fluent, included in the package of ANSYS 13.0, was used to carry out numerical simulations. RANS equation [Eq. (1)] and the continuity equation [Eq. (2)] were used for the turbulent flow of an incompressible viscous fluid ∂ ∂t ðρUiÞþ ∂ ∂xj ðρUiUjÞ ¼ − ∂P ∂xi þ ∂ ∂xj μ ∂Ui ∂xj þ ∂Uj ∂xi − 2 3 δij ∂Uk ∂xk þ ∂ ∂xj ð−ρuiujÞ ð1Þ ∂ρ ∂t þ ∂ ∂xj ðρUiÞ ¼ 0 ð2Þ where ρ = fluid density; Ui = time averaged velocity; ui = deviation from time averaged velocity; P = time averaged pressure; μ = dynamic viscosity of fluid; and −ρuiuj = Reynolds stress tensor. Standard k-ε Model The Reynolds stress tensor appears on the right hand side of the RANS equation as a result of the time averaging process, and the Reynolds stress tensor can be expressed as Eq. (3) using the turbulent kinetic energy k (m2=s2) and dissipation rate ε (m2=s3): −ρuiuj ¼ 2 3 ρkδij þ 2μtSij ð3Þ where 2μt ¼ ρCμ k2 ε ð4aÞ Sij ¼ 1 2 ∂Ui ∂xj þ ∂Uj ∂xi ð4bÞ Incident flow generating section Measurement section H Ldist Measurement points Target low-rise model (moves to downstream side) Spires Roughness blocks Incident flow Dummy low-rise models Pstatic,local Upstream distance, Lf (=0H) Fig. 1. Schematic of wind tunnel test Table 1. Computational Conditions Parameters Isolated CA ¼ 6% CA ¼ 11% CA ¼ 16% CA ¼ 25% CA ¼ 44% Computational domain (X × Z × Y, unit: H) 21 × 10 × 7 49 × 10 × 2 51 × 10 × 1.5 51 × 10 × 1.25 49 × 10 × 1 51 × 10 × 0.75 Target model position (unit: H) 0 8 and 24 6 and 24 5 and 25 8 and 24 6 and 24 Building distance (Ldist, unit: H) — 3 2 1.5 1 0.5 Pressure-velocity coupling Simple Spatial discretization Quick Convergence criteria Continuity: 10−6 Others: 10−6 Grid number (X × Z × Y) Coarse grid 60 × 33 × 39 293 × 19 × 41 336 × 16 × 41 352 × 14 × 41 395 × 12 × 41 416 × 9 × 41 Fine grid 117 × 47 × 52 yþ Coarse grid 61 yþ 263 57 yþ 395 54 yþ 398 61 yþ 400 54 yþ 401 30 yþ 420 Fine grid 30 yþ 357 yP (simulation scale, m) Coarse grid 0.00514 0.00629 Fine grid 0.00262 Grid expansion factor (yi=yiþ1) Less than 1.2 © ASCE 04014082-2 J. Aerosp. Eng.
  • 3. In Eq. (4), the turbulent kinetic energy k and its dissipation rate ε are given by the following transport equations [Eqs. (5) and (6)]: ∂ ∂t ðρkÞ þ ∂ ∂xi ðρkUiÞ ¼ ∂ ∂xj μ þ μt σk ∂k ∂xj þ Gk − ρε ð5Þ ∂ ∂t ðρεÞ þ ∂ ∂xi ðρεUiÞ ¼ ∂ ∂xj μ þ μt σε ∂ε ∂xj þ C1ε ε k Gk − C2ερ ε2 k ð6Þ In the equations, Gk represents the generation of turbulent kinetic energy attributable to the mean velocity gradient, calculated as Eq. (7) Gk ¼ −ρuiuj ∂Uj ∂xi ð7Þ The coefficients Cμ, C1ε, C2ε, σk, and σε are constants, and the default values are ðCμ; C1ε; C2ε; σk; σεÞ ¼ ð0.09; 1.44; 1.92; 1.0; 1.3Þ. Renormalized Group Theory k-ε Model Yakhot and Orszag (1986) proposed a renormalization group (RNG) k-ε model that is similar in form to the standard k-ε model; however, it differs by the inclusion of an additional sink term (Rε) in the transport equation of turbulent dissipation rate, as shown in Eq. (8). The form of the transport equation of turbulent kinetic energy remains the same as that of Eq. (5) ∂ ∂t ðρεÞ þ ∂ ∂xi ðρεUiÞ ¼ ∂ ∂xj μ þ μt σε ∂ε ∂xj þ C1ε ε k Gk − C2ερ ε2 k − Rε ð8Þ where Rε ¼ Cμρη3ð1 − η=η0Þ 1 þ βη3 ε2 k ð9Þ η ¼ Sk=ε, S ¼ ffiffiffiffiffiffiffiffiffiffiffiffiffiffi 2SijSij p , η0 ¼ 4.38, β ¼ 0.012. Recommended values for coefficients are ðCμ; C1ε; C2ε; σk; σεÞ ¼ ð0.0845; 1.42; 1.68; 0.7194; 0.7194Þ. Boundary Conditions The modified law-of-the-wall function based on the equation by Launder and Spalding (1974) were used in combination with RANS turbulence models, as shown in Eq. (10), to bridge the viscosity-affected region between the wall and the fully turbulent region UPu u2 τ ¼ 1 κ ln EuyP ν − ΔB ð10Þ where UP = tangential wind speed in the center point P of the wall- adjacent cell; E = empirical constant for a smooth wall (≈ 9.793); ν = kinematic viscosity of the fluid; yP = distance to the center point P of the wall-adjacent cell; ΔB = roughness function; and u and uτ = wall-function friction velocities defined as u ¼ C1=4 μ k1=2 P and u2 τ ¼ τw=ρ, respectively. Here, Cμ is a constant (= 0.09), kP is turbulent kinetic energy at point P, τw is wall shear stress, and ρ is fluid density. The roughness function ΔB was calculated by Eq. (11) for the full-roughness regime (Kþ S 90) ΔB ¼ 1 κ lnð1 þ CSKþ S Þ ð11Þ where Kþ S ¼ ρKSu=μ. KS and CS need to be input to the solver to calculate ΔB using Eq. (11). Then Eq. (10) is used to evaluate the shear stress at the wall and other wall functions for turbulent quantities. In the present work, KS was determined using the relationship between KS and z0 for the full-roughness regime (Blocken et al. 2007) KS ≅ Ez0 CS ¼ 9.793 z0 CS ð12Þ where z0 = aerodynamic roughness length, and is evaluated from the incident flow by fitting the points to the logarithmic law; and CS in Eqs. (11) and (12) = parameter that takes into account the type of roughness with the restriction that CS should lie in the interval [0,1]. The obtained z0 for the incident flow is 4.76 × 10⁻⁴, and using CS ¼ 1, KS is set to 0.001 for the floor roughness condition of the wind tunnel. The boundary conditions of the two sides and the top were modeled as slip walls, which are zero normal velocity and zero normal gradients of all variables, and the free outlet boundary condition was used. Inlet profiles for streamwise mean wind speed, turbulent kinetic energy, and tur- bulent dissipation rate were simulated using a user-defined func- tion. Turbulent kinetic energy was obtained considering only the streamwise fluctuating component (Tominaga et al. 2008a), and turbulent dissipation rate was obtained assuming local equilibrium 4 6 8 10 12 0 0.2 0.4 0.6 0.8 1 Mean wind speed (m/s) Height (m) Model height Experiment Coarse grid Fine grid 0 0.1 0.2 0.3 0.4 0 0.2 0.4 0.6 0.8 1 Turbulence intensity (a) (b) Height (m) Model height 0 0.5 1 1.5 2 0 0.2 0.4 0.6 0.8 1 Kinetic energy (m (c) 2 /s2 ) Height (m) Model height 0.1 1 5 10 30 90 0 0.2 0.4 0.6 0.8 1 Dissi (d) pation rate (m2 /s3 ) Height (m) Model height Fig. 2. Comparison of profiles from wind tunnel test with those from numerical simulations: (a) mean wind speed; (b) turbulence intensity; (c) turbulent kinetic energy; (d) turbulent dissipation rate © ASCE 04014082-3 J. Aerosp. Eng.
  • 4. of Gk ¼ ε (Tominaga et al. 2008b). Because profiles at the inlet change as they travel to the downstream side, the profiles at the inlet were modified considering the profiles at the model position to fit the incident flow conditions obtained from the wind tunnel test at Lf ¼ 0H. Lateral and vertical wind speeds are assumed to be zero. For the simulation of incident flow and isolated model, two grid systems were employed to examine the grid dependence of the results: a coarse grid with yþ larger than 61 and a fine grid with yþ larger than 30. The yP values are 0.00514 and 0.00262, respectively, which are larger than the KS value. The profiles at the model position were simulated in the empty three-dimensional domain and the comparison with the incident flow from the wind tunnel test are shown in Fig. 2, showing good agreement (b) Inlet Outlet Dummy model Target model Dummy model Target model X Y X Z (a) Fig. 3. Examples of grid system for area density of CA ¼ 25%: (a) X-Y section; (b) X-Z section Fig. 4. Comparison of mean wind pressure coefficients from wind tunnel test with those from numerical simulation: (a) midwidth center; (b) mid- height center Table 2. Comparison of Normalized Mean Square Error (NMSE), Fractional Bias (FB), and Correlation Coefficient (R) Grids Surfaces NMSE FB R for all points std k-ε RNG k-ε std k-ε RNG k-ε std k-ε RNG k-ε Fine grid Windward surface 0.1 0.01 −0.23 −0.09 0.90 0.97 Roof surface 0.15 0.06 0.36 0.23 Leeward surface 0.04 0.04 0.21 0.19 Coarse grid Windward surface 0.08 0.01 −0.21 −0.06 0.91 0.97 Roof surface 0.12 0.06 0.26 0.2 Leeward surface 0.03 0.04 0.18 0.18 © ASCE 04014082-4 J. Aerosp. Eng.
  • 5. regardless of the yþ values. Here, the reference wind speed Uref means the mean wind speed at the model position, not at the inlet boundary. Other important conditions for numerical simulations are summarized in Table 1. Fluent solves the governing equations by means of a collocated grid system using a finite volume method. Pressure-velocity coupling is solved by using the semi-implicit method for pressure-linked equations which are based on an iterative process that includes a solution to a pressure-correction Fig. 5. Distribution of normalized turbulence kinetic energy k=U2 ref around an isolated model (coarse grid): (a) midwidth center (reprinted from Journal of Wind Engineering and Industrial Aerodynamics, 46–47, S. Murakami, “comparison of various turbulence models applied to a bluff body,” pp. 21–36, © 1993, with permission from Elsevier); (b) midwidth center from the standard k-ε model; (c) midwidth center from the RNG k-ε model; (d) midheight center from the standard k-ε model; (e) midheight center from the RNG k-ε model 0 (a) (b) 0.03 0.06 0.09 0.12 0 0.2 0.4 0.6 k/Uref 2 rms C p 0 0.03 0.06 0.09 0.12 0 0.2 0.4 0.6 k/Uref 2 rms C p Windward (std k-ε) Side (std k-ε) Windward (rngk- ) Side (rng k- ) k-ε Roof (rngk- ) WIND WIND (RNG k- ) (RNG k- ) (RNG k- ) Roof (std ) ε ε ε Fig. 6. Relationship between k=U2 ref from numerical simulation and rms Cp from wind tunnel test: (a) relationships on windward and side surfaces; (b) relationships on roof surface -6 -4 -2 0 2 4 -6 -4 -2 0 2 4 peak Cp,numerical peak C p,experiment Windward, peak factor=5 Side, peak factor=-7 Roof, peak factor=-7 WIND gmin=-6 gmin=-8 gmax=4 gmax=6 Fig. 7. Comparison of peak Cp from numerical simulations and experimental results © ASCE 04014082-5 J. Aerosp. Eng.
  • 6. equation to satisfy the continuity equation. The advection-differenc- ing scheme is solved by the quadratic upstream interpolation for convective kinetics. The sensitivity of the numerical results pri- marily result from the grid system around the models, provided the same numerical conditions are given, and the influence of the grid systems is examined by using two grid systems with differ- ent normalized distances for the isolated model. In simulating the target model, a computational domain was reduced considering the symmetry conditions. One example of a grid system when area density of CA ¼ 25% is shown in Fig. 3. Results and Discussion Numerical Simulation of Isolated Model Mean wind pressure coefficients are defined as Eq. (13) C̄p ¼ P̄ − P̄ref 0.5ρU2 ref ð13Þ where P̄ = time-averaged surface pressure; and P̄ref = time- averaged reference static pressure in the computational domain, 54H 36H 24H 18H 12H 6H H 48H 30H 0H Lf = A B C D -1.2 -0.9 -0.6 -0.3 0 0.3 0.6 mean wind pressure coefficient Windward Roof Leeward A B C D -1.2 -0.9 -0.6 -0.3 0 0.3 0.6 mean wind pressure coefficient Windward Roof Leeward H 0H 25H 45H 5H 10H 15H 20H 30H 50H Lf = A B C D -1.2 -0.9 -0.6 -0.3 0 0.3 0.6 mean wind pressure coefficient Windward Roof Leeward A B C D -1.2 -0.9 -0.6 -0.3 0 0.3 0.6 mean wind pressure coefficient Windward Roof Leeward Lf = 0H 30H 48H H 6H 12H 18H 24H 36H 54H A B C D -1.2 -0.9 -0.6 -0.3 0 0.3 0.6 mean wind pressure coefficient Windward Roof Leeward B C D -1.2 -0.9 -0.6 -0.3 0 0.3 0.6 mean wind pressure coefficient Windward Roof Leeward experiment Lf/H=5 std k- Lf/H=5 rng k- Lf/H=5 experiment Lf/H=24 std k- Lf/H=24 rng k- Lf/H=24 experiment Lf/H=6 std k-ε Lf/H=6 rng k- Lf/H=6 experiment Lf/H=24 std k- Lf/H=24 rng k- Lf/H=24 experiment Lf/H=6 std k- Lf/H=6 rng k- Lf/H=6 A WIND D C B A WIND D C B A WIND D C B A WIND D C B A WIND D C B A WIND D C B experiment Lf/H=25 std k- Lf/H=25 rng k- Lf/H=25 RNG k- RNG k- RNG k- RNG k- RNG k- RNG k- ε ε ε ε ε ε ε ε ε ε ε A (a) (b) (c) (d) (e) (f) Fig. 8. Comparison of mean wind pressure coefficients when CA ¼ 11%, CA ¼ 16%, and CA ¼ 44% for midwidth center: (a) CA ¼ 11% at Lf=H ¼ 6; (b) CA ¼ 11% at Lf=H ¼ 24; (c) CA ¼ 16% at Lf=H ¼ 5; (d) CA ¼ 16% at Lf=H ¼ 25; (e) CA ¼ 44% at Lf=H ¼ 6; (f) CA ¼ 44% at Lf=H ¼ 24 © ASCE 04014082-6 J. Aerosp. Eng.
  • 7. which is at exactly the same position as the pitot tube in the wind tunnel test. Fig. 4 compares the mean wind pressure coefficients from the wind tunnel test with those from the numerical simulation for coarse and fine grids. Differences are observed near the stagnation point on the windward surface and the leading edges on the roof and side surfaces in which large suctions occur due to the separated shear layer. On the leeward surface, the simulation results show slightly smaller absolute values than the experimental values. In different turbulence models, clear differences are also observed near the stagnation point and leading edges. For the standard k-ε model (in the legend std k-ε), the mean wind pressure coefficient near the stagnation point is larger than unity, which is theoretically impossible and which is also much larger than the experimental values. Contrary to the results of standard k-ε model, those of RNG k-ε model show relatively good agreement with the experi- mental results on the windward surface. On the roof and side sur- faces, the variation trend of the RNG k-ε model is similar to that of the experimental value, but the values are much smaller than the experimental results and standard k-ε model results. Focusing on the smallest mean wind pressure coefficient (larger absolute value), the standard k-ε model results in slightly conservative val- ues. On the leeward surface, there is little difference between the two turbulence models. Almost the same results were obtained for the two different grids, indicating that the simulation results are very dependent on the turbulence models, but not on the grid sys- tem when yþ is less than 61. Wind pressure coefficients were compared quantitatively using three statistical parameters, normalized mean square error [NMSE, Eq. (14)], fractional bias [FB, Eq. (15)], and correlation coefficients (R), and the results are summarized in Table 2. In comparison, the numerical results corresponding to pressure tap positions were selected. NMSE indicates a value of normalized discrepancies between the computed (Ci) and experimental (Ei) values, and FB gives information about overestimation (negative value of FB) or underestimation (positive value of FB) NMSE ¼ 1=n Pn i¼1 ðEi − CiÞ2 1=n Pn i¼1ðEiCiÞ ð14Þ FB ¼ ðEi − CiÞ 0.5ðEi þ CiÞ ð15Þ As shown in Table 2, the NMSE of the RNG k-ε model is very small compared with those of the standard k-ε model (std k-ε in Table 2) on the windward and roof surfaces, whereas that on the leeward surface is almost the same. As expected, the FB of the windward surface is negative, whereas those of the roof and Fig. 9. Comparison of normalized turbulence kinetic energy k=U2 ref for different area densities (CA ¼ 11%, CA ¼ 16%, and CA ¼ 44%) at similar upstream distances (Lf=H ¼ 25 for CA ¼ 16% and Lf=H ¼ 24 as for others) (the darkest-shaded square indicates a target low-rise building, and the lightest-shaded rectangles at both sides indicate a part of dummy models): (a) CA ¼ 11% from the standard k-ε model; (b) CA ¼ 11% from the RNG k-ε model; (c) CA ¼ 16% from the standard k-ε model; (d) CA ¼ 16% from the RNG k-ε model; (e) CA ¼ 44% from the standard k-ε model; (f) CA ¼ 44% from the RNG k-ε model (a) (b) 0 3 6 9 12 0 0.2 0.4 0.6 0.8 1 Mean wind speed (m/s) Height (m) Model height α =0.1 α =0.2 α =0.3 0 0.1 0.2 0.3 0.4 0.5 0 0.2 0.4 0.6 0.8 1 Turbulence intensity Height (m) Model height α =0.1 α =0.2 α =0.3 Fig. 10. Profiles of mean wind speed with different power-law expo- nents and corresponding turbulent intensity: (a) mean wind speed; (b) turbulence intensity © ASCE 04014082-7 J. Aerosp. Eng.
  • 8. leeward surfaces are positive, indicating that the numerical results are overestimated for the windward surface and underestimated for the roof and leeward surfaces. The FB of the RNG k-ε model is smaller than that of the standard k-ε model, showing especially large differences on the windward surface. Like NMSE, FB shows little difference on the leeward surface. Similar observations can be made for correlation coefficient R. For the different grids, the NMSE and FB obtained from the coarse grid are smaller than those obtained from the fine grid, implying that the numerical simulation using a coarse grid better corresponded to the experimental results, but the differences between them are not significant. The distributions of normalized turbulent kinetic energy k=U2 ref for the coarse grid are shown in Fig. 5 together with Murakami’s (1993) experimental result. The results obtained from the standard k-ε model are quite different from the experimental results. In par- ticular, the value of k=U2 ref is highly overestimated near the leading edge on the roof surface, which causes a large discrepancy in pres- sure distributions, as shown in Fig. 4(a). This overestimation also H 48H 32H 0H Lf = 8H 16H 24H A B C D -1.2 -0.9 -0.6 -0.3 0 0.3 0.6 mean wind pressure coefficient Windward Roof Leeward A B C D -1.2 -0.9 -0.6 -0.3 0 0.3 0.6 mean wind pressure coefficient Windward Side Leeward H 0H 25H 45H 5H 10H 15H 20H 30H 50H Lf = A B C D -1.2 -0.9 -0.6 -0.3 0 0.3 0.6 mean wind pressure coefficient Windward Roof Leeward A B C D -1.2 -0.9 -0.6 -0.3 0 0.3 0.6 mean wind pressure coefficient Windward Side Leeward Lf = 0H 30H 48H H 6H 12H 18H 24H 36H 54H A B C D -1.2 -0.9 -0.6 -0.3 0 0.3 0.6 mean wind pressure coefficient Windward Roof Leeward A B C D -1.2 -0.9 -0.6 -0.3 0 0.3 0.6 mean wind pressure coefficient Windward Side Leeward A WIND D C B WIND B A D C A WIND D C B WIND B A D C A WIND D C B WIND B A D C α=0.1 α=0.2 α=0.3 α=0.1 α=0.2 α=0.3 α=0.1 α=0.2 α=0.3 α=0.1 α=0.2 α=0.3 α=0.1 α=0.2 α=0.3 α=0.1 α=0.2 α=0.3 (a) (b) (c) Fig. 11. Comparison of mean wind pressure coefficients for different incident flows at similar upstream distances: (a) Lf=H ¼ 24 when CA ¼ 6% (left: midwidth center, right: midheight center); (b) Lf=H ¼ 25 when CA ¼ 16% (left: midwidth center, right: midheight center); (c) Lf=H ¼ 24 when CA ¼ 44% (left: midwidth center, right: midheight center) © ASCE 04014082-8 J. Aerosp. Eng.
  • 9. causes the models to underpredict the formation of the reverse flow on the roof and side of the building. However, the RNG k-ε model predicts relatively well, showing similar values to the experimental results. The differences in distribution of normalized turbulent ki- netic energy, however, disappear in the simulation of a target model in a large group. Using the numerical results obtained from the RNG k-ε model with the coarse grid, prediction of peak pressure coefficients on the windward, side, and roof surfaces were attempted. In the experi- ment, a large max Cp was obtained near the stagnation points and large absolute values of min Cp were obtained at pressure taps near the edges on the side and roof surfaces. Thus, for the pressure taps shown as solid thick lines in Figs. 6(a and b), the relationship be- tween normalized turbulent kinetic energy (k=U2 ref) from numerical simulation and fluctuating wind pressure coefficients (rms Cp) from the wind tunnel test were examined, and the results are shown in Fig. 6(a) for the windward and side surfaces and in Fig. 6(b) for the roof surface. For the relationship on the windward and side sur- faces, there is a linear relationship, showing no clear difference be- tween turbulence models, except that the normalized turbulent kinetic energies from the standard k-ε model are generally larger than those of the RNG k-ε model. However, for the relationship on the roof surface, there are clear differences between turbulence models, originating from the overestimation of turbulent kinetic en- ergy for the standard k-ε model. It is surprising that a very clear linear relationship exists for the RNG k-ε model. Using this linear relationships, peak Cp values were obtained from mean wind pres- sure coefficients from Eq. (13), normalized turbulent kinetic energy (k=U2 ref) and various peak factors (g). The comparisons are shown in Fig. 7, showing good agreement with the experimental data when gmax ¼ 5 for windward and gmin ¼ −7 for the side and roof surfa- ces. The results imply that there is a possibility for evaluating peak Cp from numerical simulation using the RNG k-ε model when the peak factors were given appropriately. Here, the peak factors (g) are given arbitrarily, and discussion on peak factor is outside the scope of the present work. From the aforementioned results, it can be said that there is clear dependence of wind pressures on turbulence models, but little dependence on grid, giving almost identical results for the grid system with yþ ð30 ∼ 61Þ. Thus, simulation of the target model surrounded by a large group of dummy models was conducted using the grid system with ð30 ∼ 61Þ yþ ðapproximately 400Þ as shown in Table 1. Numerical Simulation of Target Model Fig. 8 compares mean wind pressure coefficients derived from wind tunnel tests (solid and open circles) with those of the standard k-ε model (solid and open squares) and the RNG k-ε model (solid and open stars) at midwidth center near Lf=H ¼ 6 and 24 for vari- ous area densities. For all area densities, the variation trends of the numerical results are similar to those of the experimental results, and correspondence improves as area density increases. For exam- ple, the mean wind pressure coefficients on the windward surface decrease with area density, and at higher area density the coeffi- cients at all surfaces become similar. However, large differences were still found on the windward surface and near the separation region as for the isolated model, showing smaller absolute values than the experimental results. One interesting point is that the dif- ferences between the turbulence models are generally small for all surfaces and area densities. Flow fields among and above the low-rise buildings are highly random and characterized by fluctuating flows as shown previ- ously. Modeling of fluctuating flows corresponds to incorporating the effects of turbulent motion, and there are many turbulent models available to deal with these effects. Although the RANS turbulence models are able to reproduce the overall flow pattern around the model with a relatively fine grid (Santiago et al. 2007; Lien and Yee 2004), their most significant shortcoming is their prediction of the pressure field on the model. Because the pressure distribution strongly correlates with the turbulence statistics in the flow field around the building, the discrepancies in the pressure field lead to significant changes in the distribution of turbulent kinetic energy around the building, as shown in Fig. 5, especially for the standard k-ε model. In the simulation of the isolated model, the turbulent kinetic energy of the standard k-ε model is highly overestimated near the leading edge on the roof surface. This is primarily caused by failure in modeling the production term of turbulent energy be- cause of large strain-rate tensor Sij [Eq. (4a)], which is a function of slope of mean wind speeds (∂Ui=∂xj and ∂Uj=∂xi), resulting in large eddy viscosity. In addition, the distributions of mean pressure coefficients are fairly insensitive to which RANS model is chosen, Isolated model CA=6% CA=11% CA=16% CA=25% CA=44% (a) (b) pos. neg. neg. mean Cp 0.5 1 CA=0% pos. neg. neg. mean Cp 0.5 1 6% pos. neg. neg. mean Cp 0.5 1 16% pos. neg. neg. mean Cp 0.5 1 11% neg. neg. neg. mean Cp 0.5 1 25% neg. neg. neg. mean Cp 0.5 1 44% rms Cp 0.5 1 CA=0% rms Cp 0.5 1 6% rms Cp 0.5 1 11% rms Cp 0.5 1 16% rms Cp 0.5 1 25% rms Cp 0.5 1 44% Ldist 3H 2H 1.5H 1H 0.5H Fig. 12. Variation of mean and fluctuating wind pressure coefficients at similar upstream distance for various area densities: (a) variation of mean wind pressure coefficients; (b) variation of fluctuating wind pressure coefficients © ASCE 04014082-9 J. Aerosp. Eng.
  • 10. once the standard k-ε model was eliminated (Liu et al. 2013), which is attributed to differences in the modeling procedure adopted in the RANS models. Because the flow properties around the building change significantly because of stagnation, separation, and recircu- lation, highly anisotropic and unsteady flow features are expected to occur around the model. The standard k-ε model does not suc- cessfully capture the anisotropy of turbulence and flow unsteadi- ness as they are based on the isotropic eddy viscosity modeling and the steady state flow equations. The inclusion of an anisotropic term into the dissipation equation of the RNG k-ε turbulence model slightly improves the prediction of the wind pressure coefficients, but there are still some problems in predicting the unsteady flow features. But in the numerical simulation of a large group of low-rise buildings, the slope of the mean wind speeds and the mean wind speeds themselves between buildings decrease with increasing area density. Thus, the overestimated turbulent kinetic energy of the standard k-ε model decreases largely in the simulation of the target model with increasing area density, resulting in similar distributions to those of the RNG k-ε model with increasing area density, as shown in Fig. 9. The decrease in turbulent kinetic energy of the standard k-ε model is remarkable, making little differences in pres- sure distributions from the RNG k-ε model, as shown in Fig. 8. Unsteady simulations like large eddy simulation are very attrac- tive and prerequisite methods, especially in the wind resistant design of buildings in terms of their accuracy in predicting aero- dynamic coefficients; however, in the large eddy simulation, it is impossible to use symmetry boundary conditions for the top and two sides of the computational domain, which gives a larger com- putation domain, and hence a larger number of meshes and much calculation time. The computational cost becomes significant when compared with RANS simulations, making RANS simulations still attractive. It is also possible to directly resolve the whole spectrum of turbulent scales using direct numerical simulation; however, it is not feasible for practical engineering problems as the mesh sizes are computationally prohibitive for high Reynolds numbers. The aforementioned results were obtained from a turbulent boundary layer whose power-law exponent is 0.2 (Fig. 2). To examine the effect of different incident flows on wind pressures by numerical simulation, two different turbulent boundary layers whose power-law exponents are 0.1 and 0.3 were implemented in the numerical simulation. Profiles of mean wind speed and tur- bulence intensity at Lf ¼ 0H are shown in Fig. 10. Reference mean wind speeds are Uref;α¼0.1 ≈ 9.5 m=s, Uref;α¼0.2 ≈ 7.2 m=s, and Uref;α¼0.3 ≈ 5.3 m=s, and are used for normalization of wind pres- sures. The corresponding turbulence intensities are Iu;H;α¼0.1 ≈ 0.17, Iu;H;α¼0.2 ≈ 0.23, and Iu;H;α¼0.3 ≈ 0.32. The results are shown in Fig. 11 for three area densities (CA ¼ 6%, CA ¼ 16%, and CA ¼ 44%) at similar upstream distan- ces (Lf=H ¼ 24 and 25). Because only half of the target model was used in the numerical simulation, the results from half the wind- ward and leeward surfaces were used for the midheight center. Although there was a slight difference on the windward surface when CA ¼ 6% between the flow with α ¼ 0.1 and others, there was little difference on other surfaces when CA ¼ 6% and other area densities. The pressure distributions at other upstream distan- ces (Lf=H ¼ 5, 6, and 8) show similar results, indicating the effect of the incident flow is negligible when the heights of the dummy models and target model are similar. Fig. 12 shows the experimental results of mean and fluctuating pressure distributions on various area densities at similar upstream distances (Lf=H ¼ 25 for CA ¼ 16%, and Lf=H ¼ 24 as for other area densities. It is very apparent that there is a decrease in wind loads as the area density increases, but in their wind tunnel test, the building distances (Ldist) were set automatically once the area den- sities were determined (Table 2). This indicates that in the variation of pressure distributions shown in Fig. 12, it is impossible to clarify in which either area density (CA) or building distance (Ldist) is more influential on the decrease in wind loads. Thus, to examine the ef- fect of area density and building distance separately, the following numerical simulations were made: • Case 1(a): Only upstream buildings closed to Ldist ¼ 1.5H (from Ldist ¼ 3H) for fixed CA ¼ 6% 1.5H 1.5H 3H 3H 3H 3H 3H 1.5H 1.5H 1.5H 3H 3H 3H 3H 1.5H 1.5H 1.5H 1.5H 1.5H 1.5H 1.5H 1.5H (a) (b) (c) (d) (e) Fig. 13. Examples of modified arrangement of building distance (Ldist ¼ 1.5H for fixed area density of CA ¼ 6%; the darkest-shaded building indicates target building; the lightest-shaded buildings indi- cate dummy buildings; and medium-shaded buildings indicate new building positions): (a) original arrangement for area density of CA ¼ 6%; (b) modified arrangement of upstream buildings to Ldist ¼ 1.5H; (c) modified arrangement of side buildings to Ldist ¼ 1.5H; (d) modified arrangement of downstream buildings to Ldist ¼ 1.5H; (e) modified arrangement of all buildings to Ldist ¼ 1.5H © ASCE 04014082-10 J. Aerosp. Eng.
  • 11. • Case 1(b): Only side buildings closed to Ldist ¼ 1.5H for fixed CA ¼ 6% • Case 1(c): Only downstream buildings closed to Ldist ¼ 1.5H for fixed CA ¼ 6% • Case 1(d): All buildings closed to Ldist ¼ 1.5H for fixed CA ¼ 6% • Case 2(a): Only upstream buildings closed to Ldist ¼ 0.5H (from Ldist ¼ 3H) for fixed CA ¼ 6% • Case 2(b): Only side buildings closed to Ldist ¼ 0.5H for fixed CA ¼ 6% • Case 2(c): Only downstream buildings closed to Ldist ¼ 0.5H for fixed CA ¼ 6% • Case 2(d): All buildings closed to Ldist ¼ 0.5H for fixed CA ¼ 6% • Case 3(a): Only upstream buildings moved (from Ldist ¼ 0.5H) to Ldist ¼ 2H for fixed CA ¼ 44% • Case 3(b): Only side buildings moved to Ldist ¼ 2H for fixed CA ¼ 44% • Case 3(c): Only downstream buildings moved to Ldist ¼ 2H for fixed CA ¼ 44% • Case 3(d): All buildings moved to Ldist ¼ 2H for fixed CA ¼ 44% First, in Case 1(a), only upstream buildings were moved from Ldist ¼ 3H to Ldist ¼ 1.5H for a fixed area density of CA ¼ 6%, as shown in Fig. 13(b). The building distance of CA ¼ 6% is Ldist ¼ 3H [Fig. 13(a)], and, Ldist ¼ 1.5H is the building distance when area density is CA ¼ 16%. The simulation results of this modified building distance (called modified CA ¼ 6% to CA ¼ 16%) were compared with those of area density CA ¼ 16% (called original CA ¼ 16%). Similarly, in Case 1(b) [Fig. 13(c)], Case 1(c) [Fig. 13(d)], and Case 1(d) [Fig. 13(e)], only side, downstream, and all buildings were moved to Ldist ¼ 1.5H, and the simulation re- sults were again compared with those of the original CA ¼ 16%. In Case 2, the building distance was moved to Ldist ¼ 0.5H, and the simulation results (called modified CA ¼ 6% to CA ¼ 44%) were compared with those of (original) area density CA ¼ 44% (called original CA ¼ 44%). As the opposite case of Case 1 and Case 2, in Case 3 for the fixed area density of CA ¼ 44%, only upstream [Case 3(a)], side [Case 3(b)], downstream [Case 3(c)], and all [Case 3(d)] buildings moved from Ldist ¼ 0.5H to Ldist ¼ 2H, respectively, and the results of the modified CA ¼ 44% to CA ¼ 11% were compared with those of the original modified CA ¼ 11%. The simulation results are shown in Fig. 14 for Case 1, Fig. 15 for Case 2, and Fig. 16 for Case 3. For Fig. 14(a) when only the upstream buildings were closed to Ldist ¼ 1.5H, the pressure dis- tributions are very close to those of the original CA ¼ 16%, indi- cating that the upstream building distance has more influence on the wind pressures than area density. When only side buildings were closed to Ldist ¼ 1.5H [Fig. 14(b)], the pressure distributions on the roof and leeward surfaces are very similar to the original CA ¼ 16%, and when only downstream buildings were closed to Ldist ¼ 1.5H [Fig. 14(c)], there is no change in the pressure distri- butions, showing similar values to the original CA ¼ 6%. When all buildings were closed to Ldist ¼ 1.5H [Fig. 14(d)], again the pres- sure distributions are very close to those of the original CA ¼ 16%. Similar observations were made in Case 2, as shown in Fig. 15, and this indicates that when the building distances were small, the wind pressures were mostly influenced by the upstream buildings, and next by the side buildings. The effect of downstream buildings is negligible, indicating that the area density has more influence on the wind pressures. Fig. 16 shows the results when the building distances are large for a fixed area density of CA ¼ 44%. It seems that the up- stream buildings have some influence on the wind pressures, but the degree of influence is quite different from that for Case 1(a) [Fig. 14(a)], and Case 2(a) [Fig. 15(a)], and there are no changes in wind pressures when only side [Fig. 16(b)] and downstream [Fig. 16(c)] buildings were moved to Ldist ¼ 2H. Only the pressure distributions of the modified CA ¼ 44% to CA ¼ 11% when all buildings moved to Ldist ¼ 2H show very similar results to the original CA ¼ 11%, indicating that in highly dense areas, even (a) (b) (c) (d) A B C D -1.2 -0.9 -0.6 -0.3 0 0.3 0.6 mean wind pressure coefficient Windward Roof Leeward A B C D -1.2 -0.9 -0.6 -0.3 0 0.3 0.6 mean wind pressure coefficient Windward Roof Leeward A B C D -1.2 -0.9 -0.6 -0.3 0 0.3 0.6 mean wind pressure coefficient Windward Roof Leeward A B C D -1.2 -0.9 -0.6 -0.3 0 0.3 0.6 mean wind pressure coefficient Windward Roof Leeward A WIND D C B Original CA=6% Original CA=16% Modified CA=6% to CA=16% Fig. 14. Comparison of mean wind pressure coefficients from modified CA ¼ 6–16% with original CA ¼ 16%: (a) Case 1(a) – only windward buildings; (b) Case 1(b) – only side buildings; (c) Case 1(c) – only leeward buildings; (d) Case 1(d) – all buildings © ASCE 04014082-11 J. Aerosp. Eng.
  • 12. when the building distances increase, the effect of area density remains quite large. Concluding Remarks RANS turbulence models based on the finite volume method were used to investigate the characteristics of wind pressures on an isolated and a target model in a large group. From the numerical simulations, the following conclusions can be drawn. Mean wind pressure coefficients of the isolated model obtained from the RNG k-ε model match well with those from the pressure measurement. However, for the target model in a large group, the differences between turbulence models were very small, and the correspondence to experimental data was generally good, but still showed some discrepancies near windward and large suction areas. (a) (b) (c) (d) A B C D mean wind pressure coefficient Windward Side Leeward B C D mean wind pressure coefficient Windward Side Leeward A B C D mean wind pressure coefficient Windward Side Leeward A B C D mean wind pressure coefficient Windward Side Leeward WIND B A D C Original CA=6% Original CA=44% Modified CA=6% to CA=44% -1.2 -0.9 -0.6 -0.3 0 0.3 0.6 A -1.2 -0.9 -0.6 -0.3 0 0.3 0.6 -1.2 -0.9 -0.6 -0.3 0 0.3 0.6 -1.2 -0.9 -0.6 -0.3 0 0.3 0.6 Fig. 15. Comparison of mean wind pressure coefficients from modified CA ¼ 6–44% with original CA ¼ 44%: (a) Case 2(a) – only windward buildings; (b) Case 2(b) – only side buildings; (c) Case 2(c) – only leeward buildings; (d) Case 2(d) – all buildings (a) (b) (c) (d) A B C D -1.2 -0.9 -0.6 -0.3 0 0.3 0.6 mean wind pressure coefficient Windward Roof Leeward A B C D -1.2 -0.9 -0.6 -0.3 0 0.3 0.6 mean wind pressure coefficient Windward Side Leeward A B C D -1.2 -0.9 -0.6 -0.3 0 0.3 0.6 mean wind pressure coefficient Windward Roof Leeward B C D -1.2 -0.9 -0.6 -0.3 0 0.3 0.6 mean wind pressure coefficient Windward Side Leeward A WIND D C B WIND B A D C A WIND D C B WIND B A D C Original CA=44% Original CA=11% Modified CA=44% to CA=11% A Fig. 16. Comparison of mean wind pressure coefficients from modified CA ¼ 44–11% with original CA ¼ 11%: (a) Case 3(a) – only windward buildings; (b) Case 3(b) – only side buildings; (c) Case 3(a) – only windward buildings; (d) Case 3(b) – only side buildings © ASCE 04014082-12 J. Aerosp. Eng.
  • 13. Using a limited number of positions on the windward, side and roof surfaces, the relationship between rms Cp and k=U2 ref was ex- amined to try to predict peak Cp. The results imply that it may be possible to evaluate peak Cp from numerical simulation using the RNG k-ε model, if appropriate the peak factors are given. The effect of different incident flows was examined, and no no- ticeable effect on the mean pressures on target model in large group was identified. When the building distances (Ldist) decreased, the wind pres- sures were mostly influenced by upstream buildings, and next by side buildings. The effect of downstream buildings is almost negligible, indicating that the area density has more influence on the wind pressures. But when the building distances (Ldist) in- crease, the effect of upstream buildings decreases, and those of side and downstream buildings is almost negligible, indicating that in highly dense areas, even if the building distances increase, the effect of area density remains quite large. Acknowledgments This study was funded by the Ministry of Education, Culture, Sports, Science and Technology, Japan, through the Global Center of Excellence Program, 2008-2012. The authors gratefully acknowledge their support. References Blocken, B., Carmeliet, J., and Stathopoulos, T. (2007). “CFD evaluation of wind speed conditions in passages between parallel buildings-effect of wall-function roughness modifications for the atmospheric boundary layer flow.” J. Wind Eng. Ind. Aerodyn., 95(9–11), 941–962. Chang, C. H. (2001). “Numerical and physical modeling of bluff body flow and dispersion in urban street.” Ph.D. dissertation, Dept. of Civil Engineering, Colorado State Univ., Fort Collins, CO. Chang, C. H., and Meroney, R. N. (2003a). “Concentration distributions from a point source within urban street canyons: Wind tunnel and com- putational data.” J. Wind Eng. Ind. Aerodyn., 91(9), 1141–1154. Chang, C. H., and Meroney, R. N. (2003b). “The effects of surroundings with different separation distances on surface pressures on low-rise buildings.” J. Wind Eng. Ind. Aerodyn., 91(8), 1039–1050. Gad, I. A. M., Nasief, M. M., Aaziz, S. S. A., and Osman, A. A. (2009). “Modeling of air pollutant dispersion in street canyons in cross-wind.” 13th Int. Conf. on Aerospace Science and Aviation Technology, Egyptian Ministry of Defense, Cairo, Egypt, 1–13. Ho, T. C. E., Surry, D., and Davenport, A. G. (1991). “The variability of low building wind loads due to surroundings.” J. Wind Eng. Ind. Aerodyn., 38(2–3), 297–310. Kim, Y. C., Yoshida, A., and Tamura, Y. (2012). “Characteristics of surface wind pressures on low-rise building located among large group of sur- rounding buildings.” Eng. Struct., 35(2012), 18–28. Kim, Y. C., Yoshida, A., and Tamura, Y. (2013). “Influence of surrounding buildings on wind loads acting on low-rise building.” J. Struct. Eng., 10.1061/(ASCE)ST.1943-541X.0000625, 275–283. Launder, B. E., and Spalding, D. B. (1974). “The numerical computation of turbulent flows.” Comput. Meth. Appl. Mech. Eng., 3(2), 269–289. Lee, Y. S., and Kim, J. J. (2009). “A CFD modeling on the effect of building density on urban flow.” 7th Int. Conf. on Urban Climate, Tokyo Institute of Technology, Tokyo, Japan, 1–4. Lien, F. S., and Yee, E. (2004). “Numerical modeling of the turbulent flow developing within and over a 3-D building array, part I: A high- resolution Reynolds-averaged Navier-Stokes approach.” Boundary Layer Meteorol., 112(3), 427–466. Liu, X., Niu, J., and Kwok, K. C. S. (2013). “Evaluation of RANS turbu- lence models for simulating wind-induced mean pressures and disper- sions around a complex-shaped high-rise building.” Build. Simul., 6(2), 151–164. Meroney, R. N., and Chang, C. H. (2001). “Fluid modeling and numerical modeling results from point and line source released in generic arrange- ments of bluff bodies with street canyon separations.” Proc., Wind Hazard Mitigation in Urban Area Conf., Tokyo Institute of Polytech- nics, Atsugi, Japan, 1–8. Murakami, S. (1993). “Comparison of various turbulence models applied to a bluff body.” J. Wind Eng. Ind. Aerodyn., 46–47, 21–36. Peterka, J. A., and Cermak, J. E. (1976). “Adverse wind loading induced by adjacent buildings.” J. Struct. Div., 102(3), 533–548. Santiago, J. L., Martilli, A., and Martin, F. (2007). “CFD simulation of airflow over a regular array of cubes, part I: Three-dimensional simulation of flow and validation with wind-tunnel measurements.” Boundary Layer Meteorol., 122(3), 609–634. Tominaga, Y., et al. (2008a). “AIJ guidelines for practical applications of CFD pedestrian wind environment around buildings.” J. Wind Eng. Ind. Aerodyn., 96(10–11), 1749–1761. Tominaga, Y., Mochida, A., Murakami, S., and Sawaki, S. (2008b). “Com- parison of various revised k-e models and LES applied to flow around a high-rise building model with 1∶1∶2 shape placed within the surface boundary layer.” J. Wind Eng. Ind. Aerodyn., 96(4), 389–411. Yakhot, V., and Orszag, S. O. (1986). “Renormalization group analysis of turbulence. I. Basic theory.” J. Sci. Comput., 1(1), 3–51. © ASCE 04014082-13 J. Aerosp. Eng.
  • 14. Copyright of Journal of Aerospace Engineering is the property of American Society of Civil Engineers and its content may not be copied or emailed to multiple sites or posted to a listserv without the copyright holder's express written permission. However, users may print, download, or email articles for individual use.