PMSquare Provides Cutting-Edge Consulting Services
•
11 gostaram•5,692 visualizações

Insurance sales performance management solutions powered by PMSquare

Recomendados
Recomendados
Mais conteúdo relacionado
Mais procurados
Mais procurados (20)
Destaque
Destaque (20)
Semelhante a PMSquare Provides Cutting-Edge Consulting Services
Semelhante a PMSquare Provides Cutting-Edge Consulting Services (20)
PMSquare Provides Cutting-Edge Consulting Services
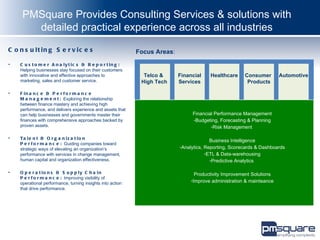
- 1. PMSquare Provides Consulting Services & solutions with detailed practical experience across all industries C o n s u lt in g S e r v ic e s Focus Areas: • C u s t o m e r A n a ly t ic s & R e p o r t in g : Helping businesses stay focused on their customers with innovative and effective approaches to Telco & Financial Healthcare Consumer Automotive marketing, sales and customer service. High Tech Services Products • F in a n c e & P e r f o r m a n c e M a n a g e m e n t : Exploring the relationship between finance mastery and achieving high performance, and delivers experience and assets that can help businesses and governments master their Financial Performance Management finances with comprehensive approaches backed by -Budgeting, Forecasting & Planning proven assets. -Risk Management • Ta l e n t & O r g a n i z a t i o n Business Intelligence P e r f o r m a n c e : Guiding companies toward strategic ways of elevating an organization’s -Analytics, Reporting, Scorecards & Dashboards performance with services in change management, -ETL & Data-warehousing human capital and organization effectiveness, -Predictive Analytics • O p e r a t io n s & S u p p ly C h a in Productivity Improvement Solutions P e r f o r m a n c e : Improving visibility of operational performance, turning insights into action -Improve administration & mainteance that drive performance.
- 3. Business Analytics for any organisation: Common Decision-Making Model Open, Enterprise Platform Source System Seamless Business Intelligence Analytics Drill Through Packaged Reporting & Analysis Financial Analytics Sales Analytics Risk Analytics Ledger Pipeline Performance Operational Payables Sales force Performance Strategic Receivables Sales Segmentation Enterprise Risk Cash Management Customer Relations Scorecards Customer/Vendor Risk Pricing and Program Analytics GRC Workforce Analytics Marketing Analytics Procurement Analytics Talent Development Customer Segmentation Spend Analysis Talent Management Product & Pricing Analysis Vendor Analysis Talent Retention Promotions Analysis Contract Management Workforce Strength Brand Analytics Operational Efficiency Compensation 3
- 4. INSURANCE SALES PERFORMANCE The IBM Insurance Sales Performance Dashboard solution provides a prebuilt framework for Analysis and Monitoring of KPIs What is the Insurance Sales Performance Dashboard Solution? The Insurance Sales Performance Dashboard solution provides an Insurance company Chief Marketing Offices , Chief Sales Officers, Senior Sales Executives and Sales Managers a pre built role based reporting framework for visually presenting and reporting the Key Performance Indicators across the Sales & Marketing area to enable them to track the sales, revenue, productivity and performance. What does the solution do? Health of the whole organization can be viewed by CXO at one go MODELS, TECHNOLOGY, BEST PRACTICES Balance Scorecard approach provides uniform focus to different functional areas A single integrated enterprise-wide view of Cross-LOB metrics catering Role based KPIs according to hierarchy to the requirements of multiple and functional areas Insurance Sales levels of Management. Performance Dashboard Provide alerts on thresholds Role based access control Sales and Customer Information Ability to handle ad-hoc queries to Claims Marketing Finance Services Technology Others generate customized reports in addition to standard reports Data & Content, Federation, Advanced Analysis 4
- 5. Performance Management Functionality Reporting Provides full breadth of report types Delivers consistent information across all types of report output Can be personalized and targeted Analysis Provides guided exploration across multiple dimensions of information Provides capabilities to do further analysis Gets to the “why” behind trends to reveal symptoms and causes Moves from summary level to detail levels of information effortlessly Dashboards Provides at-a-glance, high impact views of complex information Helps quick focus on issues that need attention and action Are highly visual and intuitive with an option of tabular view Combines information across disparate sources Multiple views of KPI for analysis Scorecards Provides instant measurement relative to targets and benchmarks Aligns decisions and tactics with strategic initiatives Ensures ownership and accountability
- 6. Insurance Sales Performance Dashboard : Solution Overview Business Benefits Provides Sales Officers the power of informed decision making Robust underlying model (IIW) helps in adding new KPIs with minimal effort Complete control over sales and revenue with balanced scorecards, alerts and analysis views Built-in sales force performance and productivity analysis Impact analysis and follow up actions Prebuilt Solution Components 66 Key Performance Indicators and 150 Standard Reports spreading across Sales & Marketing IIW based Datamart Cognos Metadata Model (FM Package) Role based Dashboards Balanced Scorecards Rules based alerts Ad-hoc queries to generate customized reports in addition to standard reports
- 7. Technology Application firewall, Authentication, Authorization, Cryptographic Services COGNOS COMMUNICATION WEB Reports published COGNOS SECURITY in web Composite Chart Analysis List Dashboard COGNOS Second level Analysis Metric Project Meta data model APPLICATION First level Framework Manager Package Meta data model All meta data except Metric related metric related meta data SOAP API (WSDL) Star schema IIW data mart Data Mart Data Mart Content Store Metric Store DB2 DATA Cognos Managed Repositories Operations Data ODS Store Policy Financials Claims Others Source Systems
- 8. Summary Fast Less More confidence Decision probability about the Making of error decisions
- 9. Roles and Hierarchy VP Sales VP Sales Dashboard Sales Manager Sales Manager Sales Supervisor Sales Supervisor Agent Agent
- 10. Role Based Dashboard Authentication and Role based dashboard
- 11. VP Sales Dashboard Analysis Cubes for slicing Key and dicing data, do what-if Performance analysis and a lot more ad- indicators hoc analysis shown with status, Targets, Actual, Alerts – with option Variance, to analyze and Rate of identify root causes change over previous Link to reports month Key sales figures with the capability to analyze the details
- 12. VP Sales Dashboard Hover the mouse on the KPI to see the trend for the last 12 Months
- 13. VP Sales Dashboard – Detail Option to view the detail information
- 14. VP Sales Dashboard – Sales detail
- 15. VP Sales – Reports View Reports grouped under sections
- 16. Compensation – Commission Analysis One can drill down to see the break up of commission under Life insurance
- 17. Compensation - Commission Analysis – Drill down by Product One can further drill down and analyze the commission break up under Term Life
- 18. Compensation-Commission Analysis–Drill down by Product
- 21. Policy-New Business Case Count
- 22. Policy – In-Force Policy Count
- 24. Productivity - Average Policy Size
- 25. Productivity - Quadrant Analysis
- 26. Productivity – Based on Case Count
- 27. Productivity – Based on Commission
- 28. Productivity – New Customers Acquired
- 29. Productivity – Percentage of Non Performing Agents
- 30. Productivity – Total Sum Insured
- 31. Sales Force – Agency Manpower
- 32. Sales Force – Activity Ratio
- 33. Sales Force – Agent Appointments
- 34. Sales Force – Net Terminations
- 35. Sales Force – Average Number of Newly Appointed Agents
- 36. Sales Revenue – New Business Premium
- 37. Sales Revenue – Total Premium
- 38. Sales Revenue – Growth in Premium Revenue
- 39. Sales Revenue – In-Force Premium
- 40. Sales Revenue – Premium Revenue by Organization
- 41. Sales Revenue – Revenue Ratio from New Customers
- 42. Analysis – Man Power
- 44. Analysis – Sales Production
- 45. Sales Force Hierarchy VP Sales Sales Manager Sales Manager Sales Supervisor Sales Supervisor Sales Supervisor Dashboard Agent Agent
- 46. Sales Supervisor Dashboard Link to Reports Score Card Comparison against Organizational averages
- 47. Sales Supervisor Reports – New Business Case Count
- 48. Sales Supervisor Reports – In-Force Policies
- 49. Sales Supervisor Reports - New Business Premium Analysis
- 50. Sales Supervisor Reports – Premium Revenue
- 51. Sales Supervisor Reports – Policy Persistency
- 52. Sales Supervisor Reports – Sales Production
- 53. Sales Supervisor Reports – Distribution of Commission
Notas do Editor
- So how do we do that …. Remember, we ’ re business-centric not data centric. Our application ’ s model then is based on several critical pillars that support business centricity. This includes: A common decision-making model that allows organizations to extend analysis either within a specific domain, or among different domains. Seamless business intelligence via Cognos 8 ’ s open enterprise platform Drill down and through analysis Access to multiple data sources Packaged self-serve reporting and analysis that can be managed and generated by line of business This central nervous system for domain specific reporting and analysis allows you to review and modify reporting and analysis in the green areas – a full portfolio of horizontal packaged applications. The application model ’ s differentiation resides in your ability to configure, synchronize and extend analysis through a single touch point that provides a robust library of dimensions, metrics and calculations that can be modified simply and quickly … allowing you through existing packaged reports or through the creation of new ones to generate multiple permutations of analysis depending on the requirements of your stakeholders. The implications – Unlimited extension of the business model Connectors to traditional ERP systems, but also Multiple data sources from which to analyze performance