SlideShare uma empresa Scribd logo
1 de 3
Baixar para ler offline
The Association of
Arts Management,
Marketing and
Development
Professionals
3
Continued on page 4
Data Analytics
By Neil FitzGerald, President, PriceWhispers
I
n a recent client consultation, I was
asked whether I thought data an-
alytics had reached their zenith of
applicability in arts and entertainment,
specifically in regards to the maturity of
analytical tools and the questions that
could be answered.
This query was posed by a progressive and for-
ward-thinking arts organization and was primarily
motivated by their indecision on how (or if) to move
forward with additional investment in data analyt-
ics. Working as part of a group with over 25 years
in the data and analytics domain across multiple
industries using data in sophisticated analyses, I
knew the answer was a definitive “No,” but this led
to an interesting conversation – first on a review of
the analytics domain today across other industries,
and then towards the beginnings of a framework to
self-assess on data analytics readiness and oppor-
tunities. Here is a template of that framework for
you to use in your organization to determine where
you are today on the analytical spectrum and what
opportunities might be around the corner for you.
The Analytical Spectrum
The pyramid in the diagram at right highlights
the varied levels of capabilities available. As you
move up, the more sophisticated the potential anal-
ysis...and the potential rewards in facilitating better
decision making. Unfortunately, moving up also
increases the required sophistication of the tools
and analysts.
Every organization, including our clients and
your organization too, is already on this analysis
spectrum. Using reports or excel worksheets created
internally or provided by your ticketing or CRM
system (e.g. to determine where to send a promo-
tion email) fits in the lower levels of the pyramid.
Creating custom metrics or visualizations for an
executive dashboard (e.g., revenue per available
seat or genre penetration rates by geographic area)
thatincorporatesdatafrominternaldatabasesmoves
you up the pyramid. Using advanced statistical and/
or algorithms to model your organization and its
customers places you near the top.
Opportunity Knocks
At each level of the pyramid, there are usually a
myriadofunmetchallengesthatcanbeaddressedby
toolsandcapableanalysts(e.g.,customersegmenta-
tion, forecasting, demand-based pricing, sales pace
curves and heat maps, probability to buy, customer
loyalty scores, promotion analysis, etc.). In addition
(and an important element in the discussion with
my progressive client noted above), there are also
ongoing opportunities provided by utilizing an iter-
ative process of analysis and striving for integrated
analysis and continuous improvement.
Implementing a cycle of constant improvement
enablesorganizationstousecompletedanalysesand
proven metrics as inputs or a foundation into future
analysis.Asanexample,thinkaboutanorganization
that has completed a set of advanced Probability to
Buy (PTB) metrics for their customer base. While
powerful by itself for facilitating segmented market
promotions, imagine the benefits that this organiza-
tion can realize by combining the PTB metrics with
their performance forecasting and sales pace analyt-
ics. They can quickly identify shows and sections
that are under- or over-performing expectations and
createatargetedpromotionlistbymarryingthatdata
with the individual customer PTB metrics — i.e.,
don’t make discount offers to customers who have
a high PTB and have not yet purchased.
Organizational Readiness
While organizations are likely unanimous in their
interesttotakeadvantageofthebenefitsprovidedby
leveraging more (and better) analytics, the unfortu-
nate reality is that not everyone has the bandwidth
Data Analytics Are Here to Stay — Long Live Data Analytics!
The Data Analytics Spectrum: Where
You Are and Where to Go From Here
Advanced
Analytics
Self-Service
Analytics & Visualization
Guided Analytics & Reporting
Canned Reporting & Excel Imports
Web Dashboards Data-driven
Decisions
The Analytical Spectrum
“Implementing a
cycle of constant
improvement
enables
organizations to
use completed
analyses and
proven metrics
as inputs or a
foundation into
future analysis.”
Advancing
Arts Revenue
GrowthTogether
www.artsreach.com 
1-888-881-5861
4
Data Analytics
Continued from page 3
or familiarity with the methods and tools to be able
to step back and assess the entire data landscape (or
data-health) of their organization. The chart below
provides an outline of the three core areas that
contribute to better data-driven decision making in
every organization.
To facilitate an internal assessment of your orga-
nizational readiness, an executive team can begin
by reviewing the three primary elements outlined in
this framework – Technology, Data and People. By
candidly self-assessing in each of these key areas,
a group can determine where internal gaps exist,
where opportunity presents itself in the short-term
and understand paths for moving forward to take
advantage of the lowest hanging fruit.
TECHNOLOGY
With the pace of technology advances today, this
is an area that can feel overwhelming to organiza-
tions very quickly.The figure below provides a guide
to the primary toolsets available to arts organizations
forinvestigatingandextractingvaluefromtheirdata.
As you move up the technology stack depicted
above, the potential benefits to your organization
(along with their potential cost) increase. The more
specialized tools enable more advanced types of
analyses and the consolidation of analyses across
multiple data sources.
To help you assess where your organization is
today and the possible paths forward, you should
carefully consider two elements of your technology
infrastructure – Tools Availability, i.e., what tools
you have access to from the above diagram, and
Infrastructure Scalability, i.e., is your organization
equipped to grow its IT infrastructure to accommo-
date more advanced analytics.
Data
Data-driven
Decision
Making
The three core
areas that contribute
to better data-driven
decision making
People Technology
The primary toolsets for investigating and extracting value from data:
Advanced
Analytics
R, SPSS, SAS
- statistical
packages
Predictive/
modeling
Business
Intelligence
SAP, IBM, Tableau,
QlikView, etc.
Dashboards &
interactive reports
Advanced
visualizations
Web & Social
Media Analytics
Google and other
Web analytics
Facebook &
Twitter analytics
Excel/
Spreadsheets
Exports from
functional systems
Pivot tables Basic charts
System Reports
Single source
reporting
Integrated
reporting
HIGH
Invest in Analysis
• IT infrastrucure &
staff in place.
• Need to purchase
tools or analytics
expertise.
Grow Analytics
• Available analytics
tools & scalable
IT infrastructure
means you’re ready
to scale your anal-
ysis with or without
third-party support.
<———————SCALABILITY——————>
In the Clouds
• Can gain scalability
& analytic capabil-
ity via outsourcing
to third-party ex-
perts in the Cloud.
• Need internal
infrastructure
expansion or cloud
infrastructure.
IT Catch-Up
• IT infrastrucure
investment must be
upgraded to match
requirements of
analytic tools.
• Outsourcing option
for IT infrastructure.
LOW <———TOOL AVAILABILITY——> HIGH
The quadrant map above enables you to identify
where your organization sits today in regards to
analytics technology and supporting infrastructure.
Based on your organization’s quadrant, the diagram
suggests what your analytics next steps are.
DATA
Even with all the analytic tools in the world and
an infinitely scalable ITinfrastructure, the results of
any data analysis will be lacking and unimpressive
without consistent and consolidated data. You can
think of the analytic technology discussed above as
the sports car of data analytics, and the actual data
as the fuel. If the fuel is contaminated or of poor
quality, the sports car’s performance will stutter or
stall. Here are a few initial questions to consider
regarding the state of your data:
3	Do you have a centralized source of data? Think
of a single database where you can ask ques-
tions about ticket sales, donations, marketing
initiatives, budgets, customer demographics,
geographic information, psychographic data,
weather information, web activity, social media
activity, etc.
TECHNOLOGY
The Association of
Arts Management,
Marketing and
Development
Professionals
5
“A well-crafted
data analytics
project should
be expected to
provide a return
of 10-25 times
the original
investment…”
3	Do you have a separate data analytics group, i.e.,
outside of specific functional areas or software
systems?
3	Do you have access to generalized analytic or
business intelligence tools, i.e., tools not attached
to a given system such as Google Analytics or
ticketing system reports?
Based on our experience, the majority of or-
ganizations in arts and entertainment will answer
the above questions with a resounding “No.” This
is simply a reflection of the state of maturity for
analysis in arts and neither a good or bad thing.
These are considered best practices however, and
are commonly implemented across other industries.
The good news for arts and entertainment organi-
zations is that there are templates for best practices
to create a robust data environment. By leveraging
these, the arts domain can avoid repeating mistakes
from other industries.The other piece of good news
is that many of the systems that you already use do
provide solid datasets for their specific domain (e.g.,
ticket systems, web and social media activity) and
analytic value can be derived from each of these
datasets as you work through a consolidation effort
and aspire to advanced analytics across the datasets.
PEOPLE
Extending our previous sports car analogy, as the
data fuels the technology sports car, it’s definitively
and always the people in an organization that drive
the car to make improved data-driven decisions.
Without a capable driver, the performance of a
sports car will be unpredictable at best and in many
cases, very dangerous.
To help you assess where your organization is
today and the possible paths forward regarding your
Human Resources (HR), carefully consider two ele-
ments – ResourceAvailability, i.e., do analysts have
available bandwidth/time, and Resource Capability,
i.e., do you have analysts on staff with the skills to
conduct the varied types of analytics.
The quadrant map below enables you to identify
where your organization sits today in regards to
analytics skills and availability. Based on your or-
ganization’s quadrant, this visual suggests potential
next steps for accelerating your focus on analytics
in the short-term.This quadrant can be applied both
holistically on your data analytics environment and
also on a specific analytic challenge, i.e., an internal
analyst or hired consultant may not have capability
across all advanced analytic problems and methods.
SUMMARY
As my originally referenced
client came to agree, the
analytics domain in
arts and entertain-
ment (and other in-
dustries) is still ripe
with opportunity.
The key to success is
to critically self-assess, identify gaps, acquire the
required resources and skills, technology and data
to fill the organizational gaps, target an analytic
objective with a big-bang return in investment and
execute towards your objective(s). A well-crafted
data analytics project should be expected to provide
a return of 10-25 times the original investment,
so following the keys to success can be both pro-
fessionally and organizationally rewarding. An
Analytics Scorecard is a great way to measure this
return on analytics investment and your project
success. These dashboards can often be created
using the same analytic tools being used for your
analysis and business intelligence, but that’s a topic
for exploration on another day.
Neil FitzGerald is the Founder and President of Price-
Whispers. Prior to founding the company in 2010, he
worked in the Business Intelligence (BI), Reporting
and Analytics space for 15+ years and founded an
award-winning, global IT and BI outsourcing company
with offices in the United States, Canada and China.
Neil actively works across industry verticals in the
application and development of innovative pricing,
reporting and analytic strategies to help
optimize revenue and increase opera-
tional excellence. Neil is a published
author in the analytics and reporting
domain having sold over 50,000 copies
around the world in multiple languag-
es. He can be reached at nfitzgerald@
pricewhispers.com
HIGH
Skills Gaps to Fill
• Train staff.
• Complement team
with data analytics
expertise with
focus on initial sup-
port & subsequent
knowledge transfer.
Analyze This!
Ready to Go!
• Analyze, Assess,
Take Action, Review,
Repeat.
• Focus on moving up
the data analyt-
ics pyramid and
exploring new data
challenges.
<———————AVAILABILITY——————>
Opportunity Knocks
• Expand team inter-
nally, or
• Expand team with
external data ana-
lytics expertise.
• Identify initial
project.
Prioritization
Opportunity
• Free your analysts’
time for high-value
analysis work.
• Outsource or elim-
inate lower-value
activities.
LOW <——RESOURCE CAPABILITY—> HIGH
HUMAN RESOURCES

Mais conteúdo relacionado

Destaque (9)

Software
SoftwareSoftware
Software
 
O golpe de gurgel 12 03-2013
O golpe de gurgel 12 03-2013O golpe de gurgel 12 03-2013
O golpe de gurgel 12 03-2013
 
Power informatica
Power informaticaPower informatica
Power informatica
 
1 a terra_e_magnetica
1 a terra_e_magnetica1 a terra_e_magnetica
1 a terra_e_magnetica
 
юные экологи москвы
юные экологи москвыюные экологи москвы
юные экологи москвы
 
Plantilla con-normas-icontec
Plantilla con-normas-icontecPlantilla con-normas-icontec
Plantilla con-normas-icontec
 
Era cenozoica
Era cenozoicaEra cenozoica
Era cenozoica
 
Answering Twitter Questions: a Model for Recommending Answerers through Socia...
Answering Twitter Questions: a Model for Recommending Answerers through Socia...Answering Twitter Questions: a Model for Recommending Answerers through Socia...
Answering Twitter Questions: a Model for Recommending Answerers through Socia...
 
Coordenadoria Regional de Saúde Norte - NASF
Coordenadoria Regional de Saúde Norte - NASFCoordenadoria Regional de Saúde Norte - NASF
Coordenadoria Regional de Saúde Norte - NASF
 

ArtsReach Article - PriceWhispers Data Analytics Eval

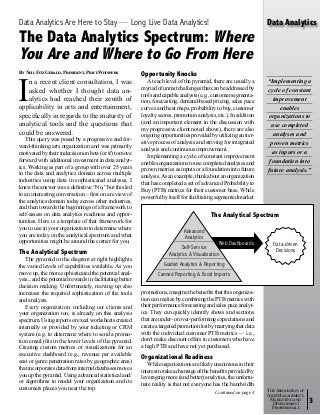
  • 1. The Association of Arts Management, Marketing and Development Professionals 3 Continued on page 4 Data Analytics By Neil FitzGerald, President, PriceWhispers I n a recent client consultation, I was asked whether I thought data an- alytics had reached their zenith of applicability in arts and entertainment, specifically in regards to the maturity of analytical tools and the questions that could be answered. This query was posed by a progressive and for- ward-thinking arts organization and was primarily motivated by their indecision on how (or if) to move forward with additional investment in data analyt- ics. Working as part of a group with over 25 years in the data and analytics domain across multiple industries using data in sophisticated analyses, I knew the answer was a definitive “No,” but this led to an interesting conversation – first on a review of the analytics domain today across other industries, and then towards the beginnings of a framework to self-assess on data analytics readiness and oppor- tunities. Here is a template of that framework for you to use in your organization to determine where you are today on the analytical spectrum and what opportunities might be around the corner for you. The Analytical Spectrum The pyramid in the diagram at right highlights the varied levels of capabilities available. As you move up, the more sophisticated the potential anal- ysis...and the potential rewards in facilitating better decision making. Unfortunately, moving up also increases the required sophistication of the tools and analysts. Every organization, including our clients and your organization too, is already on this analysis spectrum. Using reports or excel worksheets created internally or provided by your ticketing or CRM system (e.g. to determine where to send a promo- tion email) fits in the lower levels of the pyramid. Creating custom metrics or visualizations for an executive dashboard (e.g., revenue per available seat or genre penetration rates by geographic area) thatincorporatesdatafrominternaldatabasesmoves you up the pyramid. Using advanced statistical and/ or algorithms to model your organization and its customers places you near the top. Opportunity Knocks At each level of the pyramid, there are usually a myriadofunmetchallengesthatcanbeaddressedby toolsandcapableanalysts(e.g.,customersegmenta- tion, forecasting, demand-based pricing, sales pace curves and heat maps, probability to buy, customer loyalty scores, promotion analysis, etc.). In addition (and an important element in the discussion with my progressive client noted above), there are also ongoing opportunities provided by utilizing an iter- ative process of analysis and striving for integrated analysis and continuous improvement. Implementing a cycle of constant improvement enablesorganizationstousecompletedanalysesand proven metrics as inputs or a foundation into future analysis.Asanexample,thinkaboutanorganization that has completed a set of advanced Probability to Buy (PTB) metrics for their customer base. While powerful by itself for facilitating segmented market promotions, imagine the benefits that this organiza- tion can realize by combining the PTB metrics with their performance forecasting and sales pace analyt- ics. They can quickly identify shows and sections that are under- or over-performing expectations and createatargetedpromotionlistbymarryingthatdata with the individual customer PTB metrics — i.e., don’t make discount offers to customers who have a high PTB and have not yet purchased. Organizational Readiness While organizations are likely unanimous in their interesttotakeadvantageofthebenefitsprovidedby leveraging more (and better) analytics, the unfortu- nate reality is that not everyone has the bandwidth Data Analytics Are Here to Stay — Long Live Data Analytics! The Data Analytics Spectrum: Where You Are and Where to Go From Here Advanced Analytics Self-Service Analytics & Visualization Guided Analytics & Reporting Canned Reporting & Excel Imports Web Dashboards Data-driven Decisions The Analytical Spectrum “Implementing a cycle of constant improvement enables organizations to use completed analyses and proven metrics as inputs or a foundation into future analysis.”
  • 2. Advancing Arts Revenue GrowthTogether www.artsreach.com  1-888-881-5861 4 Data Analytics Continued from page 3 or familiarity with the methods and tools to be able to step back and assess the entire data landscape (or data-health) of their organization. The chart below provides an outline of the three core areas that contribute to better data-driven decision making in every organization. To facilitate an internal assessment of your orga- nizational readiness, an executive team can begin by reviewing the three primary elements outlined in this framework – Technology, Data and People. By candidly self-assessing in each of these key areas, a group can determine where internal gaps exist, where opportunity presents itself in the short-term and understand paths for moving forward to take advantage of the lowest hanging fruit. TECHNOLOGY With the pace of technology advances today, this is an area that can feel overwhelming to organiza- tions very quickly.The figure below provides a guide to the primary toolsets available to arts organizations forinvestigatingandextractingvaluefromtheirdata. As you move up the technology stack depicted above, the potential benefits to your organization (along with their potential cost) increase. The more specialized tools enable more advanced types of analyses and the consolidation of analyses across multiple data sources. To help you assess where your organization is today and the possible paths forward, you should carefully consider two elements of your technology infrastructure – Tools Availability, i.e., what tools you have access to from the above diagram, and Infrastructure Scalability, i.e., is your organization equipped to grow its IT infrastructure to accommo- date more advanced analytics. Data Data-driven Decision Making The three core areas that contribute to better data-driven decision making People Technology The primary toolsets for investigating and extracting value from data: Advanced Analytics R, SPSS, SAS - statistical packages Predictive/ modeling Business Intelligence SAP, IBM, Tableau, QlikView, etc. Dashboards & interactive reports Advanced visualizations Web & Social Media Analytics Google and other Web analytics Facebook & Twitter analytics Excel/ Spreadsheets Exports from functional systems Pivot tables Basic charts System Reports Single source reporting Integrated reporting HIGH Invest in Analysis • IT infrastrucure & staff in place. • Need to purchase tools or analytics expertise. Grow Analytics • Available analytics tools & scalable IT infrastructure means you’re ready to scale your anal- ysis with or without third-party support. <———————SCALABILITY——————> In the Clouds • Can gain scalability & analytic capabil- ity via outsourcing to third-party ex- perts in the Cloud. • Need internal infrastructure expansion or cloud infrastructure. IT Catch-Up • IT infrastrucure investment must be upgraded to match requirements of analytic tools. • Outsourcing option for IT infrastructure. LOW <———TOOL AVAILABILITY——> HIGH The quadrant map above enables you to identify where your organization sits today in regards to analytics technology and supporting infrastructure. Based on your organization’s quadrant, the diagram suggests what your analytics next steps are. DATA Even with all the analytic tools in the world and an infinitely scalable ITinfrastructure, the results of any data analysis will be lacking and unimpressive without consistent and consolidated data. You can think of the analytic technology discussed above as the sports car of data analytics, and the actual data as the fuel. If the fuel is contaminated or of poor quality, the sports car’s performance will stutter or stall. Here are a few initial questions to consider regarding the state of your data: 3 Do you have a centralized source of data? Think of a single database where you can ask ques- tions about ticket sales, donations, marketing initiatives, budgets, customer demographics, geographic information, psychographic data, weather information, web activity, social media activity, etc. TECHNOLOGY
  • 3. The Association of Arts Management, Marketing and Development Professionals 5 “A well-crafted data analytics project should be expected to provide a return of 10-25 times the original investment…” 3 Do you have a separate data analytics group, i.e., outside of specific functional areas or software systems? 3 Do you have access to generalized analytic or business intelligence tools, i.e., tools not attached to a given system such as Google Analytics or ticketing system reports? Based on our experience, the majority of or- ganizations in arts and entertainment will answer the above questions with a resounding “No.” This is simply a reflection of the state of maturity for analysis in arts and neither a good or bad thing. These are considered best practices however, and are commonly implemented across other industries. The good news for arts and entertainment organi- zations is that there are templates for best practices to create a robust data environment. By leveraging these, the arts domain can avoid repeating mistakes from other industries.The other piece of good news is that many of the systems that you already use do provide solid datasets for their specific domain (e.g., ticket systems, web and social media activity) and analytic value can be derived from each of these datasets as you work through a consolidation effort and aspire to advanced analytics across the datasets. PEOPLE Extending our previous sports car analogy, as the data fuels the technology sports car, it’s definitively and always the people in an organization that drive the car to make improved data-driven decisions. Without a capable driver, the performance of a sports car will be unpredictable at best and in many cases, very dangerous. To help you assess where your organization is today and the possible paths forward regarding your Human Resources (HR), carefully consider two ele- ments – ResourceAvailability, i.e., do analysts have available bandwidth/time, and Resource Capability, i.e., do you have analysts on staff with the skills to conduct the varied types of analytics. The quadrant map below enables you to identify where your organization sits today in regards to analytics skills and availability. Based on your or- ganization’s quadrant, this visual suggests potential next steps for accelerating your focus on analytics in the short-term.This quadrant can be applied both holistically on your data analytics environment and also on a specific analytic challenge, i.e., an internal analyst or hired consultant may not have capability across all advanced analytic problems and methods. SUMMARY As my originally referenced client came to agree, the analytics domain in arts and entertain- ment (and other in- dustries) is still ripe with opportunity. The key to success is to critically self-assess, identify gaps, acquire the required resources and skills, technology and data to fill the organizational gaps, target an analytic objective with a big-bang return in investment and execute towards your objective(s). A well-crafted data analytics project should be expected to provide a return of 10-25 times the original investment, so following the keys to success can be both pro- fessionally and organizationally rewarding. An Analytics Scorecard is a great way to measure this return on analytics investment and your project success. These dashboards can often be created using the same analytic tools being used for your analysis and business intelligence, but that’s a topic for exploration on another day. Neil FitzGerald is the Founder and President of Price- Whispers. Prior to founding the company in 2010, he worked in the Business Intelligence (BI), Reporting and Analytics space for 15+ years and founded an award-winning, global IT and BI outsourcing company with offices in the United States, Canada and China. Neil actively works across industry verticals in the application and development of innovative pricing, reporting and analytic strategies to help optimize revenue and increase opera- tional excellence. Neil is a published author in the analytics and reporting domain having sold over 50,000 copies around the world in multiple languag- es. He can be reached at nfitzgerald@ pricewhispers.com HIGH Skills Gaps to Fill • Train staff. • Complement team with data analytics expertise with focus on initial sup- port & subsequent knowledge transfer. Analyze This! Ready to Go! • Analyze, Assess, Take Action, Review, Repeat. • Focus on moving up the data analyt- ics pyramid and exploring new data challenges. <———————AVAILABILITY——————> Opportunity Knocks • Expand team inter- nally, or • Expand team with external data ana- lytics expertise. • Identify initial project. Prioritization Opportunity • Free your analysts’ time for high-value analysis work. • Outsource or elim- inate lower-value activities. LOW <——RESOURCE CAPABILITY—> HIGH HUMAN RESOURCES