SlideShare uma empresa Scribd logo
1 de 38
Baixar para ler offline
IT OUTSOURCING SUCCESS:
A MULTI-DIMENSIONAL, CONTEXTUAL PERSPECTIVE ON OUTSOURCING
                                OUTCOMES


                                 Sara Cullen
                      Department of Information Systems
                         The University of Melbourne
                         scullen@cullengroup.com.au


                               Peter B. Seddon
                      Department of Information Systems
                         The University of Melbourne
                          p.seddon@unimelb.edu.au


                                     and


                             Leslie P. Willcocks
                         London School of Economics
                           L.P.Willcocks@lse.ac.uk


   Submitted to the Second information Systems Workshop on global Sourcing:
                      Service, Knowledge and Innovation


           Copyright ©Cullen, Seddon, and Willcocks January 2008.
                             All Rights Reserved
IT OUTSOURCING SUCCESS:
         A MULTI-DIMENSIONAL, CONTEXTUAL PERSPECTIVE ON OUTSOURCING
                                         OUTCOMES


ABSTRACT


This paper proposes and demonstrates the usefulness of a new conceptualization of information
technology outsourcing (ITO) success. Based on results from three ITO surveys conducted
during 1994-2000, a review of the literature, and data from 49 in-depth ITO cases, it is argued
that although some organizations may, at times, seek outcomes from outsourcing similar to other
organizations, fundamentally what each firm seeks from outsourcing is different. Accordingly, it
is argued, studies that recognize the idiosyncratic and changing nature of outcomes sought are
likely to offer greater insight into what comprises successful outsourcing. Developing this idea,
the paper proposes an ITO outcomes framework consisting of a list of 25 goals that organizations
frequently pursue when outsourcing IT.        The list reflects most goals pursued by most
organizations, but only some of these goals are expected to be applicable to any given
organization at any given time.


The key argument in this paper is that ITO success should be assessed by, first, asking
organizations to nominate the outcomes that were/are most important to them at various times in
the life of the contract, then second, gauging the extent to which each organization has achieved
its nominated outcomes during the period when those outcomes were being pursued. The
usefulness of the framework is assessed using seven in-depth case studies and a 2007 survey
with responses from 56 large organizations. The results from these 63 organizations show that
(a) all 25 goals were considered “applicable” by at least 20% of these organizations, (b) no
organization set out to achieve all 25 goals, (c) the goals pursued changed with time, and (d) no
important goals were missing (except, perhaps, relationships). It is therefore suggested that the
instrument presented in Appendix A is a useful tool for future research into ITO success.


                                                                                               2
INTRODUCTION


Pervasive adoption has made information technology outsourcing (ITO) a growing multi-billion
dollar industry Dibbern et al, (2004). The market is ever maturing, suppliers and their offerings
ever expanding, and technology advancements are increasingly enabling the separation of
management, delivery, and operations.       Furthermore, with “offshore outsourcing” attracting
increasing attention, the level of ITO activity seems set to grow even larger.


However, despite over decade of research into ITO, the dependent variable for much ITO
research, ITO success, is surprisingly under-researched. In their comprehensive reviews of the
literature, Hui and Beath (2002) and Dibbern et al. (2004) attribute disparate conclusions on ITO
success, at least in part, to the lack of an accepted success construct. Supporting this view, Lee
et al. (2004)—who used the Grover et al. (1996) instrument to measure ITO Success—suggest
that metrics of success need further development:         “As outsourcing grows in complexity,
researchers need to develop more sophisticated metrics to assess the success of outsourcing
ventures”.


One of the key issues concerning the ITO success construct is whether a certain outcome, e.g.,
cost savings, is desirable and therefore applicable to every outsourcing initiative, or whether ITO
success is so idiosyncratic that one must assess it against each organization’s own, different,
criteria. Dibbern et al. (2004), for instance, argue that ITO is such a complex phenomenon that
context plays a much more significant role in ITO than in other areas of IS success measurement.
They further argue that expectations, and their realization, are critical to any research into ITO
success and are more closely tied to predefined criteria and actual results. Echoing this view,
Lacity et al. (1996) report that the criteria that drove an organization’s perception of success
varied between organizations, and elsewhere Lacity and Willcocks (2001) explicitly recognize
that outcomes are more appropriately assessed relative to each organization’s goals rather than
assuming that all organizations want the same things to the same degree (e.g., cost savings).


Unrecognized in most of the literature is that outcomes sought from outsourcing have a temporal
dimension, as well as varying from organization to organization. Only two studies by King and


                                                                                                 3
Malhotra (2000) and Hui and Beath (2002) explicitly recognize the temporal nature of an
organization’s outsourcing goals. In both these studies, short-term outcomes were defined as
operational, mid-term as tactical and learning, and long-term as strategic. However, associating
a particular outcome to a time-period for benefit realization does not recognize the fact that
organizations’ operational, tactical, and even strategic goals for outsourcing may change over the
life of the contract.


In response to these three concerns, i.e., prior researchers’ arguments that (a) further work is
required to refine the ITO success construct, (b) what constitutes ITO success may differ from
organization to organization, and (c) organizational goals for ITO change over time, the
objective of this study is to provide a comprehensive framework for conceptualizing and
assessing ITO success. To demonstrate the contribution of our framework, we compare it to
what we regard as the best instrument currently available for measuring ITO success, namely
that of Grover et al. (1996) 1. We identify some difficulties with their framework and provide a
solution to those difficulties in the form of the new instrument in Appendix A. The contributions
of this study are the new conceptual framework; the evidence that different organizations do seek
different outcomes from outsourcing; the evidence that these goals change over time; the insight
that satisfaction is a valid perceptual measure of ITO success because it draws on the
respondent’s goals, not on some researcher’s pre-defined list; and the ITO Success measurement
instrument presented in Appendix A that is constructed around these insights. Use of the new
conceptual framework proposed in this study will, we hope, help future researchers build better
theories to explain why some outsourcing projects are more successful than others.


New conceptual frameworks correspond to what Gregor (2006) calls Analysis theories. Gregor’s
criteria for evaluating Analysis theory are as follows:
       ‘If any classification system is developed, implicit claims are that the classification system is
       useful in aiding analysis in some way, that the category labels and groupings are meaningful
       and natural, and that hierarchies of classification are appropriate (most important divisions
       are shown at the highest level). The logic for the placement of phenomena into categories


1
    In July 2007, Google Scholar reported 164 citations to the Grover et al. (1996) paper.


                                                                                                      4
should be clear, as should the characteristics that define each category. In addition, important
     categories or elements should not be omitted from the classification system, that is, it should
     be complete and exhaustive. A previous classification system could be revised as new entities
     come to light, or some preferable way of grouping or naming categories is identified. A
     judgement as to the degree to which the theory satisfies these criteria allows one to assess the
     contribution to knowledge’. (p.264)


 In this study, we attempt to satisfy all the above criteria for making a successful contribution to
 an Analysis theory of ITO Success measurement. In addition, however, the current study offers
 more than just a taxonomy of different possible types of outcome from IT outsourcing. Our
 framework also embodies the important insight that not all organizations pursue all possible
 outcomes listed in the framework. This means that in assessing ITO success, each respondent
 must first indicate which goals were important to his/her organization at the time of interest, then
 ITO success should be evaluated in terms of the achievement of those goals, not the achievement
 of all possible goals.


 To present our case for the validity and usefulness of this new ITO success framework, the paper
 proceeds as follows. First, the framework is presented and justified in Section 2. Second, in
 Section 3, the usefulness of the framework is assessed using data from (a) seven in-depth case
 studies conducted during 2003 and 2004, and (b) 56 responses from a 2007 survey of large
 organizations with ICT outsourcing contracts.         Finally, some further justification of the
 framework is presented in the Discussion section, Section 4, along with a discussion of the
 generalizability of the empirical findings from Section 3.


A FRAMEWORK FOR ASSESSING IT OUTSOURCING SUCCESS


 Table 1 contains what we claim is a comprehensive (25-point) list of the most commonly
 intended outcomes from ITO. It represents a collective view of the goals of many organizations
 (as opposed to any single organization).       As mentioned earlier, a research instrument for
 assessing ITO success based on this framework is presented in Appendix A.


                                                                                                   5
The method proposed for using this instrument is to:


       a.       ask interviewees or survey respondents which of the 25 possible outcomes are (i)
                applicable to their organization, (ii) initial primary intended outcomes, (iii) current
                primary intended outcomes, and (iv) future primary intended outcomes;
       b.       ask them to identify any other primary intended outcomes not in the list of 25;
       c.       ask them to score on a Likert scale the extent to which those outcomes have been
                achieved; and
       d.       if comparison with ICTO success in other organizations is intended, calculate an
                average score for intended outcomes at the relevant time in the life of the contract.


                                   Table 1: ITO Outcomes and References2
Value for Money                                  Other research studies that have discussed this goal
1. Demonstrable value for money                  Fowler and Jeffs (1998), McAulay et al. (2002), Hui and Beath (2002)
                                                 Mylott (1995), Apte and Sobol (1997), Klepper and Jones (1998),
2.   Market price under internal cost            Fowler and Jeffs (1998), Lacity and Willcocks (2001), McAulay et al.
                                                 (2002),Dibbern et al. (2004)
Improved Financial Results
                                                 Apte and Sobol (1997), Lacity and Willcocks (2001), McAulay et al.
3.   Ongoing cost reduction
                                                 (2002), Lee et al. (2004)
                                                 Mylott (1995), Grover et al. (1996) Q.6, Apte and Sobol (1997),
4.   Stabilise and predict costs
                                                 Klepper and Jones (1998), Hurley and Costa (2001)
5.   Means of financing assets                   Apte and Sobol (1997), Klepper and Jones (1998)
                                                 Cross (1995), Mylott (1995), Klepper and Jones (1998), Lacity and
6.   Convert capital to operating expense
                                                 Willcocks (2001), Hurley and Costa (2001), Lee et al. (2002)
                                                 Mylott (1995), Grover et al. (1996) Q.4&5, Klepper and Jones
7.   Aggregate total demand for economies
                                                 (1998), Fowler and Jeffs (1998)
                                                 Mylott (1995), McFarlan and Nolan (1995), Klepper and Jones
8.   Cash for sale of assets
                                                 (1998), Lee et al. (2002)
9. Reduce staff numbers                          Mylott (1995), Fowler and Jeffs (1998), McAulay et al. (2002)
10. Rationalise/consolidate assets               Fowler and Jeffs (1998), Lacity and Willcocks (2001)
11. Remedy for poor performance                  [Anon3]
Improved Operations                              Other research studies that have discussed this goal
                                                 Fowler and Jeffs (1998), Domberger et al. (2000), Lacity and
12. Improve service                              Willcocks (2001), Hurley and Costa (2001), McAulay et al. (2002),
                                                 Dibbern et al. (2004)
13. Obtain services not available internally     Klepper and Jones (1998), McAulay et al. (2002)
14. Improve discipline/ accountability           Lacity and Willcocks (2001)


         2
             Items in bold correspond to those in Grover et al.’s (1996) ITO success measure, discussed later.


                                                                                                                      6
Improved Operations                        Other research studies that have discussed this goal
                                           Mylott (1995), Grover et al. (1996) Q.2&3, Apte and Sobol (1997),
                                           Klepper and Jones (1998), Fowler and Jeffs (1998), Lacity and
15. Obtain better/more expertise
                                           Willcocks (2001), Hurley and Costa (2001), McAulay et al. (2002),
                                           Lee et al. (2002)
16. More flexible work practices           Fowler and Jeffs (1998), McAulay et al. (2002)
17. Align resource supply to demand/       Cheon et al. (1995), Mylott (1995), Apte and Sobol (1997), Klepper
    minimize capacity gap                  and Jones (1998), Hurley and Costa (2001), Lee et al. (2002)
                                           Mylott (1995), Grover et al. (1996) Q.7&8, Apte and Sobol (1997),
18. Obtain better/more technology          Klepper and Jones (1998), Fowler and Jeffs (1998), Hurley and Costa
                                           (2001), McAulay et al. (2002), Lee et al. (2002)
                                           Grover et al. (1996) Q.5, Lacity and Willcocks (2001), McAulay et
19. Standardize technology
                                           al.(2002)
20. Standardize services                   Lacity and Willcocks (2001), McAulay et al. (2002)
Strategic Outcomes                         Other research studies that have discussed this goal
                                           Quinn and Hilmer (1994), Mylott (1995), Grover et al. (1996) Q.1,
21. Concentrate on core business           Fowler and Jeffs (1998), Quinn et al. (1990), Klepper and Jones
                                           (1998), Hurley and Costa (2001), Lee et al. (2004)
                                           Grover et al. (1996) Q.1, Apte and Sobol (1997), Klepper and Jones
22. Refocus internal IT staff on high
                                           (1998), Fowler and Jeffs (1998), Lacity and Willcocks (2001),
    value/strategic activities
                                           McAulay et al. (2002), Lee et al. (2004)
                                           Klepper and Jones (1998), Hurley and Costa (2001), Lacity and
23. Contribute to business
                                           Willcocks (2001), Hui and Beath (2002)
                                           Mylott (1995), Klepper and Jones (1998), Grover et al. (1996)
24. Access to best practices, new
                                           Q.3&8, Fowler and Jeffs (1998), Lacity and Willcocks (2001),
    developments
                                           McAulay et al. (2002)
25. Industry development                   Lacity and Willcocks (2001)


The rationale for using the above method for measuring ITO success is that the success of an
organization’s outsourcing endeavors should be assessed against its own goals for the project,
not in terms of some researcher-assumed goals.                By contrast, our benchmark nine-item
instrument from Grover et al. (1996) (a) assumes that its nine items are applicable in all
situations, and (b) does not ask about outcomes such as obtaining value for money, cost savings,
and improved service quality, that (i) have been argued by authors such as Domberger (1998)
Domberger et al. (2000) and to be fundamental reasons for outsourcing, and (ii) are the goals
most frequently checked by respondents to our survey (reported below) as goals applicable to
their organizations.         Since a respondent’s Satisfaction with ITO will be assessed against
whichever goals are important to that respondent, we accept that any sensible question about
satisfaction with ITO, such as Grover et al.’s question 9: “We are satisfied with our overall
benefits from outsourcing”, will always yield a valid perceptual indication of ITO success (no
matter which goals the organization has decided to pursue, nor how much such goals have
changed since the inception of the deal). What distinguishes our measure is that we do not


                                                                                                                7
accept that it is valid to assume that the eight remaining questions in the Grover et al. (1996)
instrument are always applicable to all respondents.


Developing the 25-point list of possible intended outcomes


The following process was used for developing the list of possible intended outcomes in Table 1.
First, the framework builds on answers to questions on ex ante goals and ex post outcomes from
outsourcing in a series of three surveys on ITO conducted in 1994, 1997, and 2000 [Anon. 1,2,3].
During the course of those surveys, the list of outcomes evolved from seven in the 1994 survey,
to 15 in 1997, to 21 in 2000. Each successive survey incorporated lessons from open items from
the prior surveys (e.g. respondents were always invited to suggest additional outcomes sought
not in the lists provided) and new ideas from the literature. For instance, the 2000 survey had
been compared and reconciled with the twelve goals from the Lacity and Willcocks (2002a)
survey.


Second, the list of 21 commonly pursued ITO outcomes from the 2000 survey [Anon. 3] was
refined into 25 by the lead author, based on (a) a review of the literature, and (b) a thorough
analysis of 49 case studies of ITO projects. With respect to these case studies, the lead author
had participated as a senior outsourcing consultant in 49 ITO projects spanning 51 countries
during 1994-2002, and had detailed first-hand knowledge of the 49 cases. (A list of the types of
organization and year of each project is documented in [Anon. 4].)          Working documents
reviewed for each project included plans, contracts, reports, evaluations, correspondence,
presentations, minutes, reviews, and audit reports.      The process involved scanning these
documents for each of the 49 projects looking for additional outsourcing goals not already
covered in the framework.


Third, to ensure that we built on the insights of prior researchers, the 25 outcomes were
compared to goals and outcomes reported in the ITO literature. For each of the 25 possible
outcomes identified in this study, prior studies that have discussed that outcome are summarized
in the right-hand column in Table 1. Not all studies used the same terms, so there is not an exact
one-to-one mapping, but the underlying concepts are similar. In particular, we tried to identify


                                                                                                8
indicators of ITO success that were not in our list. As one might expect, Table 1 shows that
although no prior study has reported all 25 outcomes, each outcome other than the eleventh
(remedy for poor performance) has been discussed in at least one study by prior researchers.


Finally, as with the Grover et al. (1996) study which grouped items into the three categories, the
25 outcomes were grouped into what we think are four conceptually distinct categories.
According to Gregor (2006) in an Analysis-theory paper: “The logic for the placement of
phenomena into categories should be clear, as should the characteristics that define each
category”. We compare our categorization scheme to that of Grover et al. (1996) in Table 2.
Grover et al.’s three categories correspond almost exactly to the three most important “primary
reasons for outsourcing” reported by Saunders et al. (1997) (p.70), namely, technological
considerations, cost savings, and strategic considerations.        The reason for advancing our
alternative to Grover et al.’s and Saunders et al.’s categorization is that, as Domberger (1998)
suggests, outsourcing is only worth doing if the net cost to the client organization drops as a
result of outsourcing, subject to the proviso that there is no drop in service quality. This suggests
that two key constructs in assessing ITO success are service quality and cost.


In our framework, the first construct, success in meeting the client organization’s service goals is
assessed using the group of questions headed “Improved Operations” in Table 1. Meeting such
service goals seems to be a more fundamental objective than achieving Grover et al.’s and
Saunders et al.’s “Technological benefits”, which are (one hopes) a source of improved service
outcomes (Grover et al., 1996; Saunders et al., 1997). Second, success in meeting the client
organization’s cost goals is assessed using the group of questions headed “Improved Financial
Results” in Table 1. This is similar to Grover et al.’s (1996) Economic success category (and
Saunders et al.’s (1997) Cost Savings), but it also includes the notion of improved financial
control, which does not necessarily imply cost savings. Third, our “Value for money” category
then assesses the organization’s success in balancing these service and cost objectives. There is
no counterpart for this “value for money” construct in the Grover et al. instrument, but it has
been mentioned by Fowler and Jeffs (1998), McAulay et al. (2002), and Hui and Beath (2002).
If one wanted a single measure of ITO success, Value for money would seem to be a good
candidate. Finally, our “Strategic” category is very similar to that of Grover et al. (1996); it is


                                                                                                   9
concerned with whether outsourcing helps the client organization to focus on its core business.


Table 2: Comparing success categories in this study with those from Grover et al. (1996)
Outcome categories proposed in this study            Grover et al.’s (1996) ITO Success categories
Category          Definition                         Category*         Definition (p.93)
Value for money Value for money                      Economic          “utilize expertise and
Improved          Cost reduction and stability                         economies of scale” “to
Financial Results                                                      manage its cost structure”
Improved          Improved service, including        Technological “gain access to leading-edge
Operations        access to new and better                             IT”
                  technology
Strategic         Focus on the core business         Strategic           “enable a firm to focus on its
                                                                         core business”
*Note: This is a conceptual classification, not one backed by empirical evidence. In Grover et
al.’s factor analysis, reported in their Table 3, p.102, all eight factors loaded on the one construct.


In short, based on the process summarized above, it is argued that the 25-point ITO outcomes
framework in Table 1 provides a comprehensive summary of most types of benefits that
organizations have typically sought to achieve from ITO. The final list is not intended to
represent all possible goals that every organization may have for ITO - only those that were
observed regularly.     For example, excluded from the framework was the possible desired
outcome of transferring public-sector staff to the private sector.          This was a unique and
infrequent government-specific goal. Another example possible desired outcome also excluded
from the framework was obtaining non-unionized labor.                This was only applicable to
organizations in a troubled unionized environment.


Different organizations pursue different outcomes from IT Outsourcing


In assessing ITO success, it is important to understand that only some of the 25 goals from Table
1 are likely to be pursued in any given outsourcing deal. This is particularly apparent when one
examines results from the 2000 survey [Anon. 3] (which had 235 responses from large
organizations) where 17 goals from the 25 in Table 1 were included in that survey. As shown in


                                                                                                    10
Table 3, each of the 17 goals from the 2000 survey was a primary reason for outsourcing for
some organizations whilst being not applicable for others. In short, based on results from both
the 2000 survey (and the 49 case studies), it is clear that ITO success measurement must
recognize that different organizations pursue different goals in different deals. This is why using
a “one size fits all” approach to ITO success measurement is inappropriate.


According to Gregor (2006) the contribution of an Analysis-theory paper is assessed by
considering the extent to which its new classification scheme is different to, and more helpful
than, the old one. To enable such a comparison, the first eight items from the Grover et al.
(1996) instrument are also shown in column 6 in Table 3. (The ninth question, quoted earlier,
which asked about overall satisfaction is not considered further because it does not appear in
Grover et al.’s subsequent analysis, e.g., see their Table 3.) Comparing columns 1 and 6 in our
Table 3 it is apparent that there is no clear match in the Grover et al. instrument for thirteen
questions in column 1, yet as shown in columns 2 and 3, considerable numbers of respondents
indicated that these outcomes were of primary or secondary interest to their organizations. For
example, there is no clear match in the Grover et al. (1996) instrument for question 3 “Ongoing
cost reduction”, or question 12 “Improve service”, or question 13 “Obtain services not available
internally”, yet as shown in column 2, many respondents indicated that these were primary
reasons that their organizations entered into outsourcing contracts. In addition, there are some
questions in the Grover et al. instrument that are not relevant to some organizations. For
example, in response to question 18 “Obtain better/more technology”, 41 of 185 organizations
that answered this question indicated in column 4 that this was not a primary or secondary goal
for their organization, yet Grover et al. ask two questions (7 and 8) about this outcome. Likewise,
in response to question 21 “Concentrate on core business”, 44 of 190 organizations indicated that
this was not a primary or secondary goal for their organization. In proposing the new framework
in this paper, our argument is simply that if an organization does not set out to achieve a
particular goal, it does not make sense to evaluate ITO success by asking if they have achieved a
good outcome in respect of that non-desired goal.


                                                                                                11
Table 3: Desired ITO Outcomes from the lead author’s Survey [Anon 3] matching Table 1
            and items from the Grover et al.’s (1996) ITO Success Instrument
                                          Second
Outcome (numbered to           Primary    -ary       Not                       Grover et al. (1996)
correspond to Table 1)         reason     reason     applic.    Total
       (Column 1)              (Col. 2)   (Col. 3)   (Col. 4)   (Col.5)               (Col. 6)
3. Ongoing cost reduction           52          57        81        190
4. Stabilise and predict                                                  6. We have increased control of
    costs*                                                                   IS expenses
6. Convert capital to
    operating expense               24          45       112        181
                                                                          4. We have enhanced
                                                                             economies of scale in human
7. Aggregate total demand                                                    resources
   for economies*                                                         5. We have enhanced
                                                                             economies of scale in
                                                                             technological resources
8   Cash for sale of assets           3         17       161        181
9 Reduce staff numbers              25          57       100        182
10 Rationalise/consolidate
    assets                          29          40       112        181
11. Remedy for poor
    performance                       6         21       154        181
12 Improve service                  64          65        56        185
13 Obtain services not
    available internally            94          44        54        192
14 Improve discipline/
    accountability                  25          69        89        183
15. Obtain better/more                                                    2. We have enhanced our IT
    expertise                                                                competence
                                                                          3. We have increased access
                                   115          61        17        193      to skilled personnel
16 More flexible work
   practices                        40          54        88        182
17 Align resource supply to
   demand/ minimize
   capacity gap                     71          60        53        184
18 Obtain better/more                                                     7. We have reduced the risk of
   technology                                                                technological obsolescence
                                                                          8. We have increased access
                                                                             to key information
                                    69          75        41        185      technologies
21 Concentrate on core                                                    1. We have been able to
    business                        83          63        44        190      refocus on our core business
22 Refocus internal IT staff                                              1. We have been able to
    on high value/strategic                                                  refocus on our core business
    activities                      66          69        51        186
23. Contribute to business          31          61        87        179
24. Access to best                                                        3. We have increased access
    practices, new                                                           to skilled personnel
    developments*                                                         8. We have increased access
                                                                             to key information


                                                                                                      12
technologies
 25 Industry development                 18          30        130        178
 * Item from Table 1 not included in the 2000 survey, but which matches a question from Grover et al. (1996)


It is this conditional nature of the various possible outcomes from Table 1 that creates difficulties
for conventional approaches to instrument development. For example, column 4 in Table 3
shows that not all items apply to all organizations.                 This means it is not possible to use
conventional first- or second-generation factor-analytic techniques to refine the list of 25 items
into an instrument for measuring ITO success or even to help in grouping them as we have done
in Table 2. Instead, we had to rely on human judgment to group items that seemed similar under
the four headings in Table 1, i.e., Value for money, Improved Financial Results, Improved
Operations, and Strategic outcomes.


Desired outcomes also change over time


In addition to recognizing that different organizations pursue different goals for ITO in different
deals, it is also important when assessing ITO success to understand that the outcomes sought
from ITO change over time, even for the one deal. Management may start out with quite
ambitious goals for an outsourcing project, encounter problems, then focus on some more
targeted, but more achievable, goals for their ITO deal. Since perceptions of success will
normally be gauged relative to current goals, it is suggested that in asking managers to identify
intended outcomes, care should be taken to distinguish between at least three types of intended
outcome, namely: (1) initial primary intended outcomes – the focus at the outset of the deal; (2)
current primary intended outcomes – the current focus of the deal; and (3) future primary
intended outcomes – the future focus of the deal.


ASSESSING THE COMPLETENESS OF THE FRAMEWORK


The preceding section has presented a framework that corresponds to what Gregor (2006)
describes as an Analysis theory of ITO success measurement. The framework is the list of 25
types of outcome shown in Table 1, grouped into four categories as defined in Table 2, plus the


                                                                                                               13
argument that because different organizations pursue different goals at different times, ITO
success should normally be assessed against the currently sought goals of each individual
organization. The usefulness of this theory is assessed empirically in this section. The first half
of this section uses seven in-depth case studies as its source of data. The second half uses 56
responses from a survey (plus results from the seven case studies) to extend that assessment to a
broader range of organizations.


The Cases


A case-study methodology was the technique chosen for our first assessment of both the
completeness of the framework in Table 1, and the extent to which outcomes sought had changed
over time. The questions were: (a) Were any common objectives missing from the list in
Table 1? (b) Which objectives motivated your organization to engage in outsourcing? and (c)
Are those objectives still relevant today? For these case studies, in 2003 we invited 14 of the
100 largest IT-using organizations in one State (anonymized for reviewing), to participate in the
study. Seven of the 14 organizations accepted; each became the subject of a case study. Unlike
the 49 ITO case studies used in constructing the ITO-outcomes framework in Table 1, the lead
author had no prior association with any of the organizations in these cases.          The seven
participating organizations were from five different industries comprising communications and
transport services, manufacturing, mining, government and conglomerates of multiple industries.
The size of the seven organizations ranged from US$ 2B to US$ 22B in per annum revenue and
from 7,800 to 51,000 employees as shown in Figure 1


                                                                                                14
Figure 1: Test Cases - Organization Size
                              Size - Annual Reve nue                                  Size - FTEs
                 25                                                  60,000
                 20                                                  50,000
 Revenue (A$B)


                                                                     40,000
                 15


                                                              FTEs
                                                                     30,000
                 10
                                                                     20,000
                  5                                                  10,000

                  0                                                      0
                      1   2    3    4       5     6    7                      1   2   3    4     5   6   7
                                   Case                                                   Case


Guided by Lacity and Hirschheim’s (1993) observation that much of the ITO literature tends to
be over optimistic because the evaluation is often too early in the agreement, i.e., during the
“honeymoon period”, it was decided to focus on a major contract in each of these seven
organizations that had been in operation for at least two years. After discussions with the CIOs
at the seven organizations, seven contracts were selected. With the exception of Case 6 for which
the contract was completed in one year, the contracts had been in operation for no less than two
years, and up to five years, at the time of the interviews. Overall, as documented later in
Figure 2, cases 1 and 7 would probably be called failures. Their average ITO success scores as
measured by our instrument were 1.9 and 2.8 out of five, respectively. By contrast, cases 4 and 5
would be considered successes.                     Their average ITO success scores were 4.1 and 4.5,
respectively.


The seven cases involve contracts signed between 1999 and 2001, ranging from US$1 million to
$133 million per annum. Using the guidelines of [Anon. 5] for describing key features of these
contracts, these contracts are summarized in Table 4. Service scope ranged from whole-of-IT to
selective services; geographic scope from state-based to global; supplier grouping from panels to
sole suppliers; financial scale from large to small; pricing from fixed to unit-based; duration from
long to short-term; resource ownership from the supplier owning all the service delivery
resources to the supplier providing purely the labor component; and commercial relationship
structures from arms-length to co-sourcing.


                                                                                                             15
Table 4: Configurations of the Seven Test Cases
                           Case 1:        Case 2:        Case 3:      Case 4:    Case 5:     Case 6:         Case 7:
                           MAN1           SERV1          MIN1         GOV1       GOV2        CON1            MAN2
                                          Apps                                   Single
                                                                      Note                   All IT except   Data center
                           Whole of       develop-       Whole of                app
              Service                                                 book                   networks &      facility, ops,
                           IT             ment and       IT                      develop-
                                                                      mgmt                   apps            & equip
(1) Scope                                 support                                ment
Grouping                                  Parent, all    All units,                                          Parent,
                           Parent and                                 All                    Parent and
              Recipient                   units, all     all spin                Parent                      subsidiaries
                           subsidiaries                               schools                subsidiaries
                                          subsidiaries   offs                                                optional
              Geographic   National       National       Global       State      State       National        National
                                          Best of
(2) Supplier Grouping      Sole                          Prime        Prime      Sole        Sole            Sole
                                          Breed
(3)                                                                              Not
              Relative     80%            15%            33%          26%                    23%             25%
Financial                                                                        tracked
Scale         Absolute     $40M           $30M           $133M        $31M       $1M         $16M            $10M
(4) Pricing Framework      Fixed          Unit           Hybrid       Unit       Fixed       Fixed           Fixed
                                                         Rollover     Rollover               Rollover        Rollover
(5) Duration (years)       Fixed (5)      Fixed (5)                              Fixed (1)
                                                         (7+1+1)      (3+3)                  (6+ TBD)        (3+2)
                           Supplier -     Supplier –     Supplier     Supplier   Supplier    Supplier –      Supplier –
(6) Resource ownership
                           all            labor          – all        – labor    – labor     all             all
(7) Commercial             Arms           Co-            Value        Arms       Co-                         Arms
                                                                                             Value-add
Relationship               length         sourcing       add          length     sourcing                    length


Detailed semi-structured interviews totaling 34 hours were conducted with the CIO and the top
contract manager by the lead author at the headquarters of each firm. As explained earlier, the
interview questions are attached in Appendix A. Two senior managers per organization were
interviewed to reduce reliance on a single source of evidence. The interviews were digitally
recorded, manually recorded on the instrument form (Appendix A), and then coded into a
database.        In addition, documents such as contracts, correspondences, and performance
evaluations were used to substantiate each interviewee’s statements and perceptions.


To explore the extent to which intended outcomes for outsourcing change, interviewees at each
case organization were first asked to identify which of the 25 ITO outcomes in Table 1 (a) were
applicable to their organization (as potential outcomes that could have been sought), and (b)
their organization had pursued as desired outcomes. In addition, they were asked if any desired
outcomes were missing from the list. In response to this last question, one additional outcome
mentioned in two of the seven cases, was “good relationships with suppliers”. This outcome,
which is an outcome driver rather than a desired outcome per se, is discussed in more detail in

                                                                                                                          16
the Discussion section below.


As required by the instrument, three timeframes were used for classifying outcomes sought:


      1       initial primary intended outcome – the focus at the outset of the deal,
      2       current primary intended outcome – the current focus of the deal, and
      3       future primary intended outcome – the future focus of the deal.


The degree to which each desired outcome was achieved was assessed on a five-point Likert-
type scale:


      1 = very poor outcome against expectations
      2 = poor outcome against expectations
      3 = no perceptible outcome against expectations
      4 = good outcome against expectations
      5 = very good outcome against expectations


Case-study findings


Table 5 summarizes outcomes that were judged by the managers in the case study organizations
to be applicable to their organization (heading “AO”), initial primary outcomes sought (“IPO”),
current primary outcomes sought (“CPO”), and future primary outcomes sought “FPO”). A
tick/check in the AO column means that the interviewees said that outcome was applicable to
their organization. In other words, it would have been meaningful for their organization to try to
achieve that goal. A tick/check in any of the three columns to the right of the AO column
indicates that the interviewees said that this was a goal of interest to their organization either in
the past, now, or in the future. The blacked-out cells indicate outcomes that were judged to be
not applicable to the organization in question. They had no tick in the AO column.


                                                                                                  17
Table 5: Applicable and Intended Outcomes per Case
                                                        Case 1               Case 2              Case 3                 Case 4          Case 5              Case 6               Case 7
Outcome Attributes                               AO   IPO   CPO   FPO   AO    IPO   FPO   AO   IPO   CPO   FPO   AO   IPO   CPO   FPO    AO    IPO   AO   IPO   CPO   FPO   AO    IPO   CPO
Value for Money
01. Value for money
02. Price under internal cost
Improved Financial Results
03. Ongoing cost reduction
04. Cost stability
05. Finance assets
06. Convert to operating expense
07. Aggregate demand
08. Cash from asset sales
09. Reduce staff
10. Rationalize assets
11. Remedy for poor performance
Other
Improved Operations
12. Improve service
13. Obtain services not available internally
14. Improve discipline/ accountability
15. Obtain better/more expertise
16. Flexible work practices
17. Scalability
18. Obtain better/more technology
19. Standardize technology
20. Standardize services
Other
Strategic Outcomes
21. Focus on core business
22. Refocus internal IT staff
23. Contribute to business
24. Access best practice, developments
25. Industry development
Other
                              Total attributes   24   23    2      8    14     4    7     27   10    4      3    22   5     7      5     9     7     23   10    9      9    25     4    5
Notes:
1. AO = Applicable outcome, IPO = initial primary outcome sought, CPO=current primary outcome sought, FPO=future primary outcome sought. Blacked-out cells
   mean “outcome not applicable”.
2. Case 2 had no current goals. The Case 5 contract had ended, thus had only initial goals. Case 7 had not identified any future goals at the time of the study.
3. “Other” comprises: Case 3: financial – “utility purchasing form” and strategic – “use of the innovation fund”; Case 4: strategic – “technology adoption by users”;
   Case 5: operational – “risk management”; and Case 6 strategic -“partnering-style relationship”, Case 7 strategic – “controlled relationship”.


                                                                                                                                        18
As shown in the “Total attributes” row at the bottom of Table 5, all 25 outcomes were judged to
be applicable to at least one of the seven case organizations, all 25 had been sought by at least
one of them, all seven case organizations had changed and reduced the number of outcomes
sought, and no two firms had the same portfolio of applicable, initially sought, or outcomes
sought now. Furthermore, although the list of 25 possible outcomes is not intended to be fully
comprehensive, none of the interviewees at the seven case organizations identified any common
goals that were missing from the list other than “good relationships with suppliers” (discussed in
more detail in the Discussion section below). These findings support our argument that (a) the
list of 25 potential outcomes is quite comprehensive, and (b) no single set of outcomes is
applicable to all organizations.


In observing the changes to intended outcomes over time in Table 5, two trends appear. First,
firms more experienced with outsourcing had fewer intended outcomes at the outset. The “first
generation” deals (first-time outsourcing) comprised of Cases 1, 3, 4, 6, and 7 had an average of
10.5 initial intended outcomes at the outset, nearly twice that of the “second generation” firms
which had an average of 5.5. Second, all organizations became more focused over time. As
shown in Table 5, after the first few years of each deal, there was a general trend to reduce
intended outcomes over time. The number of intended outcomes reduced to an average of 4.5
current goals and 6.5 future goals. This suggests that an organization can focus on relatively few
outcomes at any given time. It appears that organizations in first-generation deals may be
unrealistic at the outset; however within a few years they develop more realistic expectations.


Finally, as reported in [Anon. 2; 3], Figure 2 shows that outcomes that were initial intended
primary outcomes were generally achieved to a greater extent than the outcomes that were not
primary goals.


                                                                                                  19
Figure 2: Outcomes Achieved – Primary Goals versus Non-primary Outcomes achieved

                                       Prim ary Initial Outcom es       Primary

                                        Sought vs. Non-prim ary         Non primary

                                   5

                   Average Score   4

                                   3

                                   2

                                   1
                                       1     2     3     4      5   6         7
                                                       Case


A Survey to assess the applicability of the framework


In addition to the above seven case studies, we also used a survey to assess the applicability of
the items in the framework in a wide variety of organizations. The questions addressed by the
survey were: (a) Is it correct to assume that only some of the outcomes in Table 1 are applicable
to any one organization, or are some questions applicable to all organizations?, (b) What are the
most frequent goals for outsourcing in large organizations in Australia, and (c) Do outcomes
sought change over time? To answer these questions we sent e-mails containing the URL for a
survey to senior IT managers in 1,000 of the country’s largest IT-using organizations inviting
them to complete a detailed on-line survey on ICT outsourcing in October 2006. Job titles of
these 1,000 senior managers were IT Manager, Director IT, or similar (56%), CIO (18%),
General Manager IT (12%). Many of those e-mails were deleted without being read, so we
followed up in late October 2006 with a hard-copy version of the survey, then during December
2006 and January 2007 individually telephoned over 900 organizations that had not responded.


The questionnaire included the instrument in Appendix A along with many other questions
related to another study. It took approximately 30 minutes to complete. All respondents were


                                                                                               20
offered free copies of a report based on the survey if they completed the questionnaire. Our
records indicate that by March 2007, 102 people had started to complete the on-line version of
the survey. However, only 56 completed the full survey. The completed-survey response rate is
thus only 56/960 = 6%. A response rate of 6% is not as high as we would have liked, but the
opinions of these 56 senior IT managers about the outcomes from their largest ICTO contract
provide a lot of valuable information, discussed in sections 3.5 and 3.6. The generalizability of
these findings is discussed in Section 4 below.


Contextual information


In order to make transferability judgments based on the analysis that follows (as suggested by
Palmquist et al. (2004)) it is important to understand more about the respondent firms. For that
reason, details of the respondents’ industries, organization sizes, IT budgets, and degree of
involvement with IT outsourcing (which was often substantial) are provided in Tables 6 and 7.
From these tables it is evident that respondent organizations (a) are from a wide range of
industries and firm sizes, (b) operate in a wide range of different geographic regions, (c) have
very different percentages of ICT budget outsourced (both in the country under study and
offshore), and (d) typically have fewer than five ICT contracts.


                                  Table 6: Respondents by industry
 Industry                   Count     Industry               Count   Industry                  Count
 Agriculture, forestry &
 fishing                      1       Government - Federal     5     Media                        2
 Car Hire                     1       Government – State       9     Minerals processing          1
                                      Health & community
 Construction                 1       services                 1     Mining                       1
 Education                    3       Health Insurance         1     Trade - Retail               3
 Electricity, gas & water     3       Hospitality              1     Transport & storage          3
 Finance & insurance          5       Law and Legal            3                       Total     56
 Government - City/local      4       Manufacturing            8


                                                                                                       21
Table 7: Characteristics of organizations in the sample
    Organization    Attribute      Count    Percentage       Organizational    Attribute       Count    Percentage
    al attribute    Range                    (of the 56      attribute         Range                     (of the 56
                                               orgs.)                                                      orgs.)
    Revenue         $<100M            4            7         Percent ICT       <10%             12            22
                    $100-499M        22           40         spend             10-49%           34            62
                    $500-999M         7           13         outsourced        50-90%            8            15
                    $1-4.9B          15           27                           No answer         1             2
                    $5-20B            7           13         Percent ICT       0%               39            71
    Employees       <1000            12           22         spend offshore    1-9.9%            9            16
                    1000-4999        32           58                           10-20%            4             7
                    5000-40000       11           20                           100%              1             2
    Geographic      Local             5            9                           No answer         2             4
    coverage        State            19           35         Number of         1                10            18
                    National         21           38         ICTO              2-4              29            53
                    Asia Pacific      2            4         contracts*        5-15             11            20
                    Global            7           13                           20-120            4             7
                    No answer         1            2                           0?                1             2
    Annual ICT      $<10M            21           38         Number of         1                10            18
    Spend           $10-99M          28           51         ICTO              2-4              29            53
                    $100-999M         6           11         suppliers*        5-15             11            20
                                                                               20-100            4             7
    * Number of contracts not equal to number of suppliers                     0?                1             2


Outcomes Applicable, Initially sought, and Currently sought


Respondents to the survey were presented with the instrument in Appendix A and asked to
indicate goals that were applicable, initially sought, sought now, and to be sought, as well as to
score outcomes achieved on the five-point Likert scale in Appendix A. Results for the 56
respondent firms have been combined with those from the seven case-study organizations (to
give a total sample size of 63) and are reported in Table 83.


3
    There appears to have been some respondent fatigue at this stage of the survey, because only 31 of 56 respondents
actually checked any outcomes as “currently sought”.


                                                                                                                      22
Table 8: ICT Outsourcing Outcomes applicable and sought
        (N=63: 56 responses from the 2007 survey combined with those from the 7 cases)
                                                                                                 Number of      Mean
                                                                                                respondents   Outcome
                                                                     Initial    Current          who scored   achieved
                                                                   Primary      Primary             their       on a
                                                                   Outcome      Outcome          success in   scale of
                                                     Applicable     sought       Sought           achieving   1=low to
                    Outcome                             %            (IPO)       (CPO)*         the outcome    5=high
                   (Column 1)                         (Col. 2)      (Col. 3)     (Col. 4)          (Col. 5)    (Col. 6)
Value for money
1.    Demonstrable value for money                      97%               44           19               60           3.52
2.    Market price under internal cost                  70%               33            8               40           3.53
Improved Financial Results
3.    Obtain ongoing cost reduction                     79%               32           17               47           3.30
4.    Stabilise and predict costs                       86%               34           15               50           3.77
5.    Means of financing assets                         35%               11            3               18           3.78
6.    Convert capital to operating expense              37%               12            3               15           3.93
7.    Aggregate total demand for economies              59%               23            9               30           3.63
8.    Obtain cash for sale of assets                    21%                6            1                6           3.32
9.    Reduce staff numbers                              51%               24            5               27           3.67
10. Rationalize/consolidate assets                      40%               12            8               19           3.38
11. Get remedy for poor performance                     57%               22            5               34           3.49
Improved Operations
12. Improve service                                     94%               42           18               55           3.64
13. Obtain services not available internally            84%               38           13               50           3.77
14. Improve discipline/ accountability                  63%               20           12               34           3.12
15. Obtain better/more expertise                        84%               40           11               50           3.42
16. Allow more flexible work practices                  48%               15            7               25           3.12
17. Align resource supply to demand/
     minimize capacity gap                              55%               21            7               26           3.73
18. Obtain better/more technology                       70%               29            6               40           3.62
19. Standardize technology                              65%               27            7               35           3.88
20. Standardize services                                71%               32            8               41           3.82
Strategic
21. Concentrate on core business                        79%               38           10               44           3.61
22. Refocus internal IT staff on high value
     /more strategic activities                         73%               29           14               42           3.50
23. Contribute to business (i.e. joint R&D,
     joint commercialisation)                           43%               11            8               20           3.04
24. Access to best practices, new
     developments                                       70%               29           11               36           3.31
25. Industry development                                48%               13            7               21           3.10
* Possibly due to respondent fatigue, only 31 of 56 survey respondents answered this question


                                                                                                                23
Lessons from Table 8 are as follows.       First, all outcomes from Table 1 were considered
“applicable” to at least some organizations.          Three outcomes in particular, namely
“Demonstrable value for money” (97%), “Improved Operations” (94%), and “Stabilize and
predict cost” (86%), were applicable to almost all organizations. Frequent selection of these
three items is consistent with the argument presented in the justification of the categories in
Table 2 that outsourcing is fundamentally a question about value for money. Second, based on
the scores in column 6, some outcomes, such as “standardizing technology”, “standardizing
services”, and even “concentrating on the core business” appear to be much more achievable
than others, such as “accessing best practices” and “obtaining ongoing cost reduction”. The
value of working with the list of outcomes presented in this paper (Table 1 and Appendix A) is
that it opens the researchers’ and respondents’ minds to this range of possible benefits. Without
the list, many of these possible benefits may not be considered.      Finally, the scatterplot in
Figure 3 (which only shows the 26 organizations that reported non-zero numbers of both initial
and current primary outcomes sought) shows that the number of reported primary outcomes
sought by these 26 organizations certainly changed with time.        If the number of primary
outcomes sought had not changed, the dots in Figure 3—each representing a single
organization—would all lie on the straight line shown sloping upwards from the origin. They
don’t.


    Figure 3: Current Primary Outcomes (CPO) sought compared to Initial Primary
 Outcomes (IPO) sought for the survey respondents that reported non-zero CPO and IPO


                                                                                              24
25


           Count of Current Primary Outcomes sought   20


                                                      15


                                                      10


                                                      5


                                                      0


                                                           0   5           10           15            20   25
                                                               Count of Initial Primary Outcomes sought


Averaged Outcomes-achieved Scores Compared to Overall Satisfaction


Although the scores on the individual items are often of more interest than any overall average
measure, researchers often seek to compare ITO success across organizations. If one has access
to data like that summarized in Table 8, the best way to compare overall ITO success would
seem to be to compare averages of perceived success in achieving intended outcomes. The
question is, “Are such averages useful for comparing ITO success across organizations?”


As indicated earlier, overall satisfaction is likely to be a valid measure of ITO success because
each respondent will intuitively compare success against the goals relevant to his/her
organization. This means that one way to assess the validity of average outcomes-achieved
scores is to compare them to overall measures of satisfaction. For that reason, two questions
related to satisfaction were included in Appendix A.


                                                                                                                25
Table 9 reports average overall satisfaction (Overall Satisfaction), satisfaction with the service
provider/s (Sat. with supplier), applicable outcome scores (Mean Outcome), primary outcome
initially sought scores (Mean IPO), and primary outcomes currently sought as reported by the 63
respondents. As noted earlier, only 31 of the 56 survey respondents checked any outcomes as
“currently sought”. Their mean Outcomes-achieved scores for outcomes currently sought are
considerably lower than those for outcomes overall, which could explain why they have become
a focus of management attention.


Spearman correlation coefficients between the various measures are shown on the right of Table
9 (together with the number of observations used for calculating each correlation coefficient).
No statistical tests of significance have been calculated because it is not clear that the sample is
representative of the population of all large organizations in the country with ITO contracts. The
correlation coefficients show that the first five measures are highly correlated4. These high
correlations suggest that all five measures are tapping similar constructs. This, in turn, provides
preliminary evidence that averages of the outcomes-achieved measures for individual items
selected by the respondents (i.e., Mean Outcome and Mean IPO) are likely to be useful measures
of ITO success. The lower mean score for Mean Primary Outcomes currently sought (CPO) and
lower correlations between this and the other measures suggests that there is something different
about outcomes currently sought that could be worth investigating in future research.


          Table 9: Means and Spearman correlation coefficients for Satisfaction with IT
                   Outsourcing, Value for Money, and mean Outcomes scores
            (N=63: 56 responses from the 2007 survey combined with those from the 7 cases)
                                    Std.         Spearman Correlation Coefficients (and number of observations)
                                               Overall    Sat with    Value for      Mean       Mean        Mean
                            Mean    Dev
                                             Satisfaction supplier     money       Outcome       IPO        CPO
    Overall Satisfaction     3.42     0.96         1.000      .830         .689          .768       .752       .576
                        N                    61            61           58          61           56           30
    Sat with supplier        3.43     1.02          .830        1.000        .716         .687         .765        .430


4
    If the sample were judged to be representative, SPSS says that all correlations reported in Table 9 are significantly
different from zero at p<0.001, except for the correlations with Mean CPO, two of which are only “significant” at
p<0.05.


                                                                                                                          26
N                       61           62          59           62           57           31
 Value for money           3.56     1.01         .689        .716        1.000         .767         .723         .631
                   N                       58           59          59           59           55           30
 Mean Outcome              3.65     0.69         .768        .687         .767        1.000         .913         .725
                   N                       61           62          59           62           57           31
 Mean IPO                  3.75     0.72         .752        .765         .723         .913        1.000         .458
                   N                       56           57          55           57           57           26
 Mean CPO                  3.26     0.99         .576        .430         .631         .725         .458        1.000
                     N                       30            31           30           31        26         31
 Overall Satisfaction:   Overall, how satisfied is your organization with this contract?
 Sat. with supplier:     How satisfied is your organization with the outsourcing suppliers(s)?
 Value for money:        Outcome-achieved score for Demonstrated value-for-money
 Mean Outcome:           Mean of all the respondent’s outcome-achieved scores, equally weighted
 Mean IPO:               Mean of outcome-achieved scores for primary outcomes initially sought, equally weighted
 Mean CPO:               Mean of outcome-achieved scores for primary outcomes currently sought, equally weighted


DISCUSSION


Idiosyncratic Nature of Outcomes Sought


As suggested in section 2.2, the results in the previous section demonstrate that organizations
outsource for different reasons. Future discussions of outsourcing success or outcomes must
recognize this fact. For example, it is not valid to assume that all organizations seek cost savings
when they outsource. As shown in Table 8, row 3, cost saving was not an applicable objective
for 21% of organizations studied. For such organizations, it does not make sense to assess ITO
success by asking about cost savings. Consequently, any study of ITO success at the firm level
requires a more detailed deconstruction of what success means for that organization.
Furthermore, as demonstrated in the case studies (see Figure 2), intended outcomes are achieved
to a greater degree than those that were not. This emphasizes, again, that understanding the
unique nature of an organization’s desired outcome portfolio is vital for assessing ITO success.


As explained in section 3.2 and Figure 3, not only did each firm have its own suite of desired
outcomes, but these changed over time. In other words, an organization’s definition of success is
not static. The goal posts are always moving. The original intent of the deal may not reflect the


                                                                                                                        27
current or future intent. Any discussion regarding success must therefore also be explicit about
periods during which specific outcomes were sought.


Techniques Driving Success and Failure of IT Outsourcing


The fact that any one firm has achieved any given outcome or group of outcomes, does not
automatically mean that that same outcome or group of outcomes is achievable by any other firm
that outsources its IT.    Various explanations were offered by managers in the case-study
organizations for their outcomes, both successes and failures. These explanations provide quite
rich insights into the case organizations and the way managers in those organizations think about
both outsourcing success and failure.


For example, case organizations 2, 4, 5, and 6 reported that they had realized good value for
money, but each attributed it to a different reason. Case 2’s management attributed their success
to offering suppliers a “take it or leave it” deal “give me as much labor as I need for an hourly
rate of 10% more than what it costs me inhouse”, Case 4’s to competitive tendering, Case 5’s to
the fixed-price nature of the contract, and Case 6’s to the long-term duration of the contract. One
might infer then, that such techniques represent successful methods for achieving value for
money. However, the techniques that worked for these organizations were also identified as
reasons for failure in other cases. For example, Case 5’s fixed-price configuration was also
adopted by Case 1. However, in Case 1, this action caused the supplier to go bankrupt and was a
poor value-for-money outcome, “we didn’t know the risk of the supplier not getting additional
clients and the sustainability of their business”. Case 6’s long-term duration solution was also
adopted by Case 7. However, Case 7 had a poor value-for-money outcome because the price for
services in this case was higher than market rates (the second-generation deals with three new
suppliers, not just one, achieved 70% cost savings over the first-generation deal).


Exploring the causes of poor outcomes led to a similar conclusion about the variability of
reasons for those outcomes. Cases 1 and 4 which realized very poor results in terms of being
able to refocus internal IT staff on strategic activities again attributed their outcomes to different
causes. In an excellent example of Kern et al.’s Winner’s Curse (2002), Case 1’s management


                                                                                                   28
had chosen a new-entrant supplier that had priced its services too cheaply to make a profit and
Case 1’s CIO and IT team became focused on managing disputes with the service provider rather
than managing IT, “I was not the CIO for nine months, three days and four hours”. This was not
the reason for Case 4’s inability to refocus IT staff.       Case 4 became focused on “micro-
management of the users” in helping the users adopt the purchased technology because
management had under-scoped the work outsourced and left out key areas that were not assigned
to either party. IT staff had to carry out these activities on a reactive basis, meaning that desired
refocusing was not achieved.


Do these two cases mean that choosing a vendor that is not going to make money on the deal, or
under-scoping the work and the retained IT organization, are causes of failure? In these two
cases is the answer yes, but in other cases the answer is no. For example, like Case 1, Case 5
also chose a supplier that underbid the fixed price. However, Case 5’s supplier was able to
absorb the cost overruns and deliver a successful application, thereby winning substantial future
work and becoming “our number one preferred developer”. Case 5 never set out to refocus IT
staff, so that outcome was not relevant to it, but nor did it have to reallocate any staff to the
“firefighting” as did Case 1 and 4. Finally, as stated earlier, Case 4 did not fully scope the work
nor design carefully the retained organization. Neither did Case 3, but management there have
been able to rescope and reshape the contract every day since signing, and it has been able to
refocus IT staff well, “we have no worker bees anymore, we focus on strategy, business analysis,
architecture, and relationship management”.


In short, single-factor explanations of success as well as failure are too simplistic. In different
contexts, techniques that drove successful outcomes in some cases led to failure in other cases.
In addition, factors that led to failed outcomes in some cases yielded good results in others. For
these reasons, the wide range of success advice and prescriptions appearing throughout the
literature must be viewed as highly conditional – not only in terms of the success constructs the
author/s have adopted, but also in terms of the contextual situation of each of the organizations
involved.


                                                                                                  29
Is “Relationship with Supplier” an Outcome?


As mentioned earlier, a question that arose during the conduct of the case studies was whether
the relationship between the parties is an outcome or a means to obtain desired outcomes. The
framework in Table 1 does not explicitly recognize quality of the relationship as an outcome, yet
many practitioners and researchers argue that the key to success in outsourcing is good working
relationships (see for example Alborz, 2005; Kern and Willcocks, 2002; Lacity and Willcocks,
2000b). In terms of specific studies: Dibbern et al. (2004) note that success might only occur if
accompanied by partnering-style behaviors; Grover et al. (1996) report that what they called
“partnership”—a combination of two behaviors (supplier problem notification and the parties
helping each other) and two perceptions (supplier is trustworthy and the working relationship is
happy) by the client organization—was a major factor in explaining variance in perceptions of
outsourcing success; and Corbett (2005) argues that outsourcing relationships replace many of an
organization’s traditional assets – people, technologies, facilities, methods, and know-how, and
that the relationship becomes a asset itself requiring ongoing investment. Based on these and
similar studies, the importance of the relationship in achieving ITO success is indisputable.


The question is, however, whether relationship goals should be treated as, say, a fifth category of
outcomes in Tables 1 and 2 or as, say, a variable moderating or mediating other factors such as
use of selective sourcing that are posited to be drivers of ITO success. Within this study, at least
two of the seven case-study organizations had made achieving a better relationship a distinct
goal, albeit not at the outset of the deal. An example goal from one organization was as follows:
“better change management and communications, recognize and manage the fact that different
businesses and countries have different relationships, having the vendor take a decision and take
a risk”. Further, in the survey, respondents were asked “What importance to you attach to the
relationship between the parties in this contract?” All 56 respondents chose to answer this
question.   On a scale from 1=low to 5=high, their mean score for the Importance of the
Relationship was a very high 4.70 (s.d. 0.60). Thus although relationship goals are not benefits
from outsourcing per se, future studies should at least consider the merit of adding relationship-
type goals to the 25-point list.


                                                                                                 30
Generalizability of the findings from this study


The response rate for the survey discussed in Section 3 was very low, so it is important to assess
the extent to which the results from this study are generalizable to (a) all large organizations in
the country studied, and (b) the rest of the world. Seddon and Scheepers (2006) argue that the
key to drawing generalizable conclusions from any survey with less than a 100% response rate is
to demonstrate—through argument—that the sample is representative, in terms of the factors of
interest in the study, of the population of interest.


As explained earlier, 46 of 102 respondents started but did not complete the on-line survey.
Their initial responses (captured on the survey website) are compared to the 56 organizations that
completed the survey in Table 10. The independent-samples t-test (equal variances not assumed)
shows that ICT spend and the percentage of ICT expenditure outsourced are significantly higher
for the firms that completed the survey5. Assuming that non-respondent firms are more like
those who failed to complete the survey, this suggests that managers of organisations more
involved in outsourcing were more motivated to complete the time-consuming survey (it took
many respondents 30 minutes to complete). The inference we draw from Table 10 is that the
findings reported in this study are likely to be more representative of organisations that make
more intense use of ICT and of ICT outsourcing than those that do not.


         5
             Inferential statistics (p-values) are meaningful here because the question is whether these two samples
could be random samples drawn from the same population. For average % of the ICT budget outsourced, the tests
show that this is highly unlikely.


                                                                                                                       31
Table 10: Key statistics for organizations that completed the survey compared to those
                                           that did not
                               The 56          The 46 firms that Difference in Significance
                               complete        started but did   means,        (2-tailed)
                               responses to not complete the independent
                               the survey      survey            samples
                                                                 t-statistic
 Average Revenue                $2.0 billion      $2.1 billion        0.375       0.709
 Average Employment                3,600              4,600           0.776       0.442
 Average ICT spend              $44 million       $41 million        -2.177       0.033*
 Average % of ICT budget           29%                14%            -3.047       0.003**
 outsourced
 Average % of outsourcing          3.2%               1.6%           -0.775       0.440
 budget offshore
 Average number of                  7.5                3.8           -1.365       0.176
 outsourcing contracts
 Average number of                  6.5                5.4           -0.268       0.790
 outsourcing suppliers
 *=p<0.05; **p<0.01


Armed with this information, how generalizable are the claimed contributions of this study, first,
to all large organizations in the country studied, and second, to other large organizations in the
Western world?       The five claimed contributions of this study and comments on their
generalizability are summarized in Table 11. The analysis in Table 11 suggests that the results
from this study are likely to hold true for all large organizations that outsource ICT in country X
(country not specified to preserve anonymity during the review process). Further, since <other
continents> (again, not specified to preserve anonymity) have similar institutional settings, we
would also expect the claimed contributions of this study to apply there as well.


Table 11: Generalizability of claimed contributions of this study from the 63 organizations
                  studied to all large organizations within Country X*
     Claimed contribution                          Comment on generalizability
1. The new conceptual framework. Generalizable: It seems unlikely that other organizations
                                    with fewer outsourcing contracts would have more or very
                                    different desired outcomes.


                                                                                                32
2. The evidence that different        Generalizable: If these 63 organizations have such
   organizations do seek different    different mixes of goals it seems unlikely that
   outcomes from outsourcing.         organizations with fewer outsourcing contracts would all
                                      have similar goals.
3. The evidence that these goals      Generalizable: If the goals of the 7 case study
   change over time.                  organizations have changed, and the outcome scores for
                                      the 31 organizations scoring current primary intended
                                      outcomes in Table 9 are so different, it seems unlikely that
                                      other organizations’ goals would not also change.
4. The insight that satisfaction is a Generalizable: This was an insight based on logic, not
   valid perceptual measure of ITO data. It does not depend on the sample of data collected.
   success because it draws on the It provides the justification for the argument that the
   respondent’s goals, not on some correlation tests reported in Table 9 provide useful
   researcher’s pre-defined list.     information.
5. The ITO Success measurement This contribution is generalizable because the
   instrument based on the above      contributions above are generalizable.
   insights.
* Country name suppressed to maintain anonymity during the review process


    CONCLUSIONS AND DIRECTIONS FOR FUTURE RESEARCH


This paper has focused on the measurement of outsourcing success. Its primary contribution is
the evidence that different organizations seek different outcomes from outsourcing and that these
change over time. It follows that although ITO success may validly be assessed by asking
questions about overall satisfaction6—and possibly about achievement of the four broad sub-
goals in Table 1 (Value for money, Improved Financial Results, Service delivery, and Strategic
outcomes), which seem to apply to most organizations—any attempt to assess ITO success in
terms of more detailed criteria, such as cost savings or focusing on core business, requires
identification of the different criteria relevant to each organization for each different contract at
the time of the study.


The 25 outcomes proposed in Table 1 represent a convenient catalog of frequently sought
outcomes from ITO. Questions about the achievement of those that are relevant can be framed


6
    As explained earlier, satisfaction is an acceptable measure because the respondent in each organization may be
assumed to use his or her organization’s own set of goals when assessing satisfaction.


                                                                                                                     33
in terms of past, present, and future outcomes sought as well as assessed in terms of negative,
null, and positive outcome realization as shown in Appendix A. In using such an instrument it is
important to understand that organizations refine their desired outcomes from their ITO deals
over time. Thus while original outcomes sought may be met, longitudinal studies need to
consider the achievement of different outcomes at different times.


Looking forward, future research might seek to explain why organizational goals for ITO change,
and whether there is merit in including questions about the relationship between ITO client and
vendor as an indicator of ITO success. Further progress in understanding outsourcing and the
drivers of ITO success also seems likely through studying interdependences between intended
outcomes. Although Dibbern et al. (2004) did not find any study in this area, preliminary work
carried out by Rouse et al. (2001) found associations between cost reduction and strategic
benefits, and service and strategic benefits. In addition, Dibbern et al. called for intensive
research in the area of balancing multiple outsourcing outcomes and multiple stakeholder
expectations.   Assessments of success are also likely to be different depending on who is
surveyed and their expectations - in this study, CIOs, IT managers, and contract executives.
What happens when different stakeholders are examined (i.e. users, business managers, supplier
personnel) and the conflicting expectations that may surface, offers an interesting research path.
Hirschheim and Lacity (1998; 2000) found that achieving multiple stakeholder goals is elusive, if
not unrealistic, and involves many trade offs.


These and many more research opportunities can be explored on a consistent and comparable
manner once a reasonably complete ITO success construct becomes sufficiently tested and
adopted. It is hoped that this research has contributed to that goal.


                                                                                               34
REFERENCES
[Anon 1-5] Anonymous References withheld for anonymous refereeing.

Alborz, S., Seddon, P.B. and Scheepers, R. (2005) The Quality of Relationship Construct in IT
Outsourcing, Proceedings of the Ninth Pacific Asia Conference on Information Systems
(PACIS), pp. 1118-1131.

Apte, U. and Sobol, M. (1997) “IS outsourcing practices in the USA, Japan and Finland: a
comparative study”, Journal of Information Technology, 12, (4) 289-304.

Cheon, M.J., Grover, V. and Teng, J.T.C (1995) “Theoretical Perspectives on the Outsourcing of
Information Services”, Journal of Information Technology, 10 (4) 209-210.

Corbett, M. (2005) “Outsourcing: Just the end of the beginning” in Brudenall, P. (ed)
Technology and Offshore Outsourcing Strategies, London: Palgrave Macmillan, x-xiii

Cross, J. (1995) “IT Outsourcing at British Petroleum”, Harvard Business Review, May-June,
94-102.

Dibbern, J., Goles, T., Hirschheim, R, and Jayatilaka, B. (2004) “Information Systems
Outsourcing: A Survey and Analysis of the Literature”, ACM Data Base, 35 (4) 6-102.

Domberger, S. (1998) The Contracting Organization: A Strategic Guide to Outsourcing, Oxford:
Oxford University Press

Domberger, S., Fernandez, P. and Fiebeg, D. (2000) “Modelling the price, performance and
contract characteristics of IT Outsourcing”, Journal of Information Technology, 15 (2) 107-118.

Fowler, A. and Jeffs, B. (1998) “Examining information systems outsourcing: a case study from
the United Kingdom”, Journal of Information Technology, 13, 111-126.

Gregor, S. (2006) The Nature of Theory in Information Systems, MIS Quarterly, 30(3) 611-642

Grover, V., Cheon M.Y. and Teng J. (1996) “The Effect of Service Quality and Partnership on
the Outsourcing of Information Systems Functions”, Journal of Management Information
Systems, 12 (4) Spring 89-116.

Hirschheim, R.A. and Lacity, M.C. (1998) “Reducing Information Systems Costs through
Insourcing: Experiences from the Field”, Proceedings of the 31st International Conference on
System Sciences, Hawaii, 644-653.

Hirschheim, R.A and Lacity, M.C., (2000) “The Myths and Realities of Information Technology
Outsourcing”, Communications of the ACM, 43 (2) 99-107.


                                                                                            35
Hui, P.P. and Beath, C.M. (2002) “The IT Sourcing Process: A Framework for Research”.
Working Paper, Austin: University of Texas at Austin.

Hurley, M. and Costa, C. (2001) The Blurring Boundary of the Organisation: Outsourcing
Comes of Age, Sydney: KPMG Consulting.

Kern, T. and Willcocks, L.P. (2002) “Exploring Relationship in Information Technology
Outsourcing: The Interaction Approach”, European Journal of Information Systems, 11(1) 3-19.

Kern, T., Willcocks, L., and Heck, E. (2002) “The Winner’s Curse in IT Outsourcing: Strategies
for Avoiding Relational Trauma”, California Management Review, 44(2) 47-69.

King, W.R and Malhotra, Y. (2000) “Developing a Framework for Analyzing IS Outsourcing”,
Information & Management, 37 323-334.

Klepper, R. and Jones, W. O. (1998) Outsourcing Information Technology Systems & Services,
NJ: Prentice Hall.

Lacity, M.C. and Hirschheim, R.A. (1993) Information Systems Outsourcing: Myths, Metaphors,
and Realities, Chichester: Wiley.

Lacity M.C. and Willcocks, L.P. (1998) An empirical investigation of information technology
sourcing practices: Lessons from Experience, MIS Quarterly 22(3) 363-408.

Lacity, M.C. and Willcocks, L.P. (2002a) Inside Information Technology Outsourcing: A State of
the Art Report, Templeton College, Oxford: Templeton Research.

Lacity, M.C. and Willcocks, L.P. (2000b) “Relationships in IT Outsourcing: A Stakeholder
Perspective”, in Zmud, R. (ed.) Framing the Domains of IT Management Research: Glimpsing
The Future through The Past, California: Pinnaflex.

Lacity, M.C. and Willcocks, L.P. (2001) Global Information Technology Outsourcing: Search
for Business Advantage, Chichester: Wiley.

Lacity, M.C., Willcocks, L.P. and Feeny, D.(1996) “The Value of Selective Sourcing”, Sloan
Management Review, Spring 13-25

Lee, J.-N., and Kim, Y.-G. (1999) “Effect of Partnership Quality on IS Outsourcing Success:
Conceptual Framework and Empirical Validation”, Journal of MIS, 15(4) 29-61.

Lee, J-N, Miranda, S.M. and Kim, Y-M. (2004) “IT Outsourcing Strategies: Universalistic,
Contingency, and Configurational Explanations of Success”, Information Systems Research,
15(2) 110–131.

McAulay, M., Doherty, N. and Keval, N. (2002) “The stakeholder dimension in information
systems evaluation”, Journal of Information Technology. 17 241-255.


                                                                                           36
McFarlan, F.W and Nolan, R. (1995) “How to Manage an IT Outsourcing Alliance”, Sloan
Management Review, Winter 9-23.

Mylott, T.R. (1995) Computer Outsourcing: Managing the Transfer of Information Systems, NJ:
Prentice Hall.

Palmquist, M. et al. (2004). “Introduction to Generalizability and Transferability”. Website:
http://writing.colostate.edu/guides/research/gentrans/pop2a.cfm (viewed June 2007)

Quinn, J.B., Doorley, T. and Paquette, P. (1990) “Beyond Products: Services-Based Strategy”,
Harvard Business Review, March-April 58-67.

Quinn, J.B. and Hilmer, F.G. (1994) “Strategic Outsourcing”, Sloan Management Review, 35(4)
43-55.

Rouse, A., Corbitt B. and Aubert, B. (2001) “Perspectives on IT Outsourcing Success:
Covariance Structure Modelling of a Survey of Outsourcing in Australia”, Working Paper,
Montreal: Ècole des Hautes Ètudes Commericales de Montrèal, March.

Saunders, C., Gebelt, M. and Hu, Q. (1997) “Achieving Success in Information Systems
Outsourcing”, Californian Management Review. 39(2) 63–79.

Seddon, P.B. and Scheepers, R. (2006) Other-settings Generalization in IS Research,
Proceedings of the 27th International Conference on Information Systems, pp. 1141-1158.


                                                                                          37
Outsourcing

Mais conteúdo relacionado

Mais procurados

Decision support-systems
Decision support-systemsDecision support-systems
Decision support-systemsNguyen Phuc
 
Poster ECIS 2016
Poster ECIS 2016Poster ECIS 2016
Poster ECIS 2016Rui Silva
 
Assessing Information System Integration Using Combination of the Readiness a...
Assessing Information System Integration Using Combination of the Readiness a...Assessing Information System Integration Using Combination of the Readiness a...
Assessing Information System Integration Using Combination of the Readiness a...journalBEEI
 
Employee Engagement within the IT Industry
Employee Engagement within the IT Industry Employee Engagement within the IT Industry
Employee Engagement within the IT Industry Momo Scott
 
KNOWLEDGE SHARING, INNOVATION AND FIRM PERFORMANCE: EVIDENCE FROM TURKEY
KNOWLEDGE SHARING, INNOVATION AND FIRM PERFORMANCE: EVIDENCE FROM TURKEYKNOWLEDGE SHARING, INNOVATION AND FIRM PERFORMANCE: EVIDENCE FROM TURKEY
KNOWLEDGE SHARING, INNOVATION AND FIRM PERFORMANCE: EVIDENCE FROM TURKEYMesut DOĞAN
 
Knowledge sharing innovation_and_firm_performance_evidence_from_turkey
Knowledge sharing innovation_and_firm_performance_evidence_from_turkeyKnowledge sharing innovation_and_firm_performance_evidence_from_turkey
Knowledge sharing innovation_and_firm_performance_evidence_from_turkeyMesut DOĞAN
 
The Effect of Information Technology and Total Quality Management on Organiza...
The Effect of Information Technology and Total Quality Management on Organiza...The Effect of Information Technology and Total Quality Management on Organiza...
The Effect of Information Technology and Total Quality Management on Organiza...Sigit Sanjaya
 
CIS 336 str Exceptional Education / snaptutorial.com
CIS 336 str Exceptional Education / snaptutorial.comCIS 336 str Exceptional Education / snaptutorial.com
CIS 336 str Exceptional Education / snaptutorial.comdonaldzs97
 
Achieving and Ensuring Business Process Acceptance for Systems and Software E...
Achieving and Ensuring Business Process Acceptance for Systems and Software E...Achieving and Ensuring Business Process Acceptance for Systems and Software E...
Achieving and Ensuring Business Process Acceptance for Systems and Software E...Dr. Mustafa Değerli
 
Cis 336 str Education Redefined - snaptutorial.com
Cis 336 str    Education Redefined - snaptutorial.comCis 336 str    Education Redefined - snaptutorial.com
Cis 336 str Education Redefined - snaptutorial.comDavisMurphyC76
 
Cis 336 Enhance teaching / snaptutorial.com
Cis 336   Enhance teaching / snaptutorial.comCis 336   Enhance teaching / snaptutorial.com
Cis 336 Enhance teaching / snaptutorial.comDavis104
 
26425 95197-1-pb (1)
26425 95197-1-pb (1)26425 95197-1-pb (1)
26425 95197-1-pb (1)Mary Reimers
 
Icdec2020_presentation_slides_12
Icdec2020_presentation_slides_12Icdec2020_presentation_slides_12
Icdec2020_presentation_slides_12ICDEcCnferenece
 
Mba2216 business research week 3 research methodology 0613
Mba2216 business research week 3 research methodology 0613Mba2216 business research week 3 research methodology 0613
Mba2216 business research week 3 research methodology 0613Stephen Ong
 
Antecedents to effective sales and operations planning. swaim, maloni, bow...
Antecedents to effective sales and operations planning.    swaim, maloni, bow...Antecedents to effective sales and operations planning.    swaim, maloni, bow...
Antecedents to effective sales and operations planning. swaim, maloni, bow...Patrick Bower
 
Business research methods chap003
Business research methods chap003Business research methods chap003
Business research methods chap003Kamran Sheikh
 
Implications Of Human Resource Variables On Supply Chain Performance And Comp...
Implications Of Human Resource Variables On Supply Chain Performance And Comp...Implications Of Human Resource Variables On Supply Chain Performance And Comp...
Implications Of Human Resource Variables On Supply Chain Performance And Comp...CSCJournals
 
Minning of Bitcoin Technology
Minning of Bitcoin TechnologyMinning of Bitcoin Technology
Minning of Bitcoin TechnologyEECJOURNAL
 
Collaborative performance
Collaborative performanceCollaborative performance
Collaborative performanceNeeraj Jaiswal
 

Mais procurados (20)

Decision support-systems
Decision support-systemsDecision support-systems
Decision support-systems
 
Poster ECIS 2016
Poster ECIS 2016Poster ECIS 2016
Poster ECIS 2016
 
Assessing Information System Integration Using Combination of the Readiness a...
Assessing Information System Integration Using Combination of the Readiness a...Assessing Information System Integration Using Combination of the Readiness a...
Assessing Information System Integration Using Combination of the Readiness a...
 
Employee Engagement within the IT Industry
Employee Engagement within the IT Industry Employee Engagement within the IT Industry
Employee Engagement within the IT Industry
 
KNOWLEDGE SHARING, INNOVATION AND FIRM PERFORMANCE: EVIDENCE FROM TURKEY
KNOWLEDGE SHARING, INNOVATION AND FIRM PERFORMANCE: EVIDENCE FROM TURKEYKNOWLEDGE SHARING, INNOVATION AND FIRM PERFORMANCE: EVIDENCE FROM TURKEY
KNOWLEDGE SHARING, INNOVATION AND FIRM PERFORMANCE: EVIDENCE FROM TURKEY
 
Knowledge sharing innovation_and_firm_performance_evidence_from_turkey
Knowledge sharing innovation_and_firm_performance_evidence_from_turkeyKnowledge sharing innovation_and_firm_performance_evidence_from_turkey
Knowledge sharing innovation_and_firm_performance_evidence_from_turkey
 
The Effect of Information Technology and Total Quality Management on Organiza...
The Effect of Information Technology and Total Quality Management on Organiza...The Effect of Information Technology and Total Quality Management on Organiza...
The Effect of Information Technology and Total Quality Management on Organiza...
 
CIS 336 str Exceptional Education / snaptutorial.com
CIS 336 str Exceptional Education / snaptutorial.comCIS 336 str Exceptional Education / snaptutorial.com
CIS 336 str Exceptional Education / snaptutorial.com
 
Achieving and Ensuring Business Process Acceptance for Systems and Software E...
Achieving and Ensuring Business Process Acceptance for Systems and Software E...Achieving and Ensuring Business Process Acceptance for Systems and Software E...
Achieving and Ensuring Business Process Acceptance for Systems and Software E...
 
Cis 336 str Education Redefined - snaptutorial.com
Cis 336 str    Education Redefined - snaptutorial.comCis 336 str    Education Redefined - snaptutorial.com
Cis 336 str Education Redefined - snaptutorial.com
 
Cis 336 Enhance teaching / snaptutorial.com
Cis 336   Enhance teaching / snaptutorial.comCis 336   Enhance teaching / snaptutorial.com
Cis 336 Enhance teaching / snaptutorial.com
 
26425 95197-1-pb (1)
26425 95197-1-pb (1)26425 95197-1-pb (1)
26425 95197-1-pb (1)
 
Icdec2020_presentation_slides_12
Icdec2020_presentation_slides_12Icdec2020_presentation_slides_12
Icdec2020_presentation_slides_12
 
Mba2216 business research week 3 research methodology 0613
Mba2216 business research week 3 research methodology 0613Mba2216 business research week 3 research methodology 0613
Mba2216 business research week 3 research methodology 0613
 
Antecedents to effective sales and operations planning. swaim, maloni, bow...
Antecedents to effective sales and operations planning.    swaim, maloni, bow...Antecedents to effective sales and operations planning.    swaim, maloni, bow...
Antecedents to effective sales and operations planning. swaim, maloni, bow...
 
Business research methods chap003
Business research methods chap003Business research methods chap003
Business research methods chap003
 
Implications Of Human Resource Variables On Supply Chain Performance And Comp...
Implications Of Human Resource Variables On Supply Chain Performance And Comp...Implications Of Human Resource Variables On Supply Chain Performance And Comp...
Implications Of Human Resource Variables On Supply Chain Performance And Comp...
 
Minning of Bitcoin Technology
Minning of Bitcoin TechnologyMinning of Bitcoin Technology
Minning of Bitcoin Technology
 
The Strategic Of It Capability to Support Innovativeness for Firm Performance
The Strategic Of It Capability to Support Innovativeness for Firm PerformanceThe Strategic Of It Capability to Support Innovativeness for Firm Performance
The Strategic Of It Capability to Support Innovativeness for Firm Performance
 
Collaborative performance
Collaborative performanceCollaborative performance
Collaborative performance
 

Semelhante a Outsourcing

Research articleFactors affecting the successful realisati.docx
Research articleFactors affecting the successful realisati.docxResearch articleFactors affecting the successful realisati.docx
Research articleFactors affecting the successful realisati.docxrgladys1
 
Modeling and Application of a Modified Attributional Psychometric Instrument...
Modeling and Application of a Modified Attributional  Psychometric Instrument...Modeling and Application of a Modified Attributional  Psychometric Instrument...
Modeling and Application of a Modified Attributional Psychometric Instrument...IOSR Journals
 
Organization effectiveness assesment of cocacola using the goals approach mod...
Organization effectiveness assesment of cocacola using the goals approach mod...Organization effectiveness assesment of cocacola using the goals approach mod...
Organization effectiveness assesment of cocacola using the goals approach mod...Solomon Adetokunbo
 
Research writing technique
Research writing techniqueResearch writing technique
Research writing techniqueHARRY ENTEBANG
 
1820-02141300020S.pdf
1820-02141300020S.pdf1820-02141300020S.pdf
1820-02141300020S.pdfTesfish Hailu
 
Shared objective versus collaboration
Shared objective versus collaboration Shared objective versus collaboration
Shared objective versus collaboration Leon Dohmen
 
IRJET - Bankruptcy Score Indexing
IRJET - Bankruptcy Score IndexingIRJET - Bankruptcy Score Indexing
IRJET - Bankruptcy Score IndexingIRJET Journal
 
Mutinda bernadette, gakenia judith, kangu maureen and kamau stephen what ma...
Mutinda bernadette, gakenia judith,  kangu maureen and kamau stephen  what ma...Mutinda bernadette, gakenia judith,  kangu maureen and kamau stephen  what ma...
Mutinda bernadette, gakenia judith, kangu maureen and kamau stephen what ma...KIRINYAGA UNIVERSITY
 
CHAPTER-1 Discussion 11) DiscussionCOLLAPSEIT value Infor.docx
CHAPTER-1 Discussion 11) DiscussionCOLLAPSEIT value Infor.docxCHAPTER-1 Discussion 11) DiscussionCOLLAPSEIT value Infor.docx
CHAPTER-1 Discussion 11) DiscussionCOLLAPSEIT value Infor.docxmccormicknadine86
 
3.activity 2 differentiating between applied research and basic research
3.activity 2  differentiating between applied research and basic research3.activity 2  differentiating between applied research and basic research
3.activity 2 differentiating between applied research and basic researchNazrin Nazdri
 
A New Framework For Managing IT-Enabled Business Change
A New Framework For Managing IT-Enabled Business ChangeA New Framework For Managing IT-Enabled Business Change
A New Framework For Managing IT-Enabled Business ChangeJulie Davis
 
ORGANISATIONAL EFFECTIVENESS ASSESSMENT SLIDES (1).pptx
ORGANISATIONAL EFFECTIVENESS  ASSESSMENT SLIDES (1).pptxORGANISATIONAL EFFECTIVENESS  ASSESSMENT SLIDES (1).pptx
ORGANISATIONAL EFFECTIVENESS ASSESSMENT SLIDES (1).pptxssusera9dc04
 
Implementation of a decision support process for evaluating the correlation ...
Implementation of a decision support process for evaluating the  correlation ...Implementation of a decision support process for evaluating the  correlation ...
Implementation of a decision support process for evaluating the correlation ...IJECEIAES
 
Enablers of TMT support fr integrated management control systems innovations
Enablers of TMT support fr integrated management control systems innovationsEnablers of TMT support fr integrated management control systems innovations
Enablers of TMT support fr integrated management control systems innovationsJessica Lee
 
Application of OD interventions.pdf
Application of OD interventions.pdfApplication of OD interventions.pdf
Application of OD interventions.pdfUtkarshSingh600554
 
In Chapter 8.4 of the text, the author lays out several action items.docx
In Chapter 8.4 of the text, the author lays out several action items.docxIn Chapter 8.4 of the text, the author lays out several action items.docx
In Chapter 8.4 of the text, the author lays out several action items.docxrochellscroop
 
Running Head ANNOTATED BIBLIOGRAPHY – APPLICATION 31ANNOTATED .docx
Running Head ANNOTATED BIBLIOGRAPHY – APPLICATION 31ANNOTATED .docxRunning Head ANNOTATED BIBLIOGRAPHY – APPLICATION 31ANNOTATED .docx
Running Head ANNOTATED BIBLIOGRAPHY – APPLICATION 31ANNOTATED .docxSUBHI7
 

Semelhante a Outsourcing (20)

Research articleFactors affecting the successful realisati.docx
Research articleFactors affecting the successful realisati.docxResearch articleFactors affecting the successful realisati.docx
Research articleFactors affecting the successful realisati.docx
 
Modeling and Application of a Modified Attributional Psychometric Instrument...
Modeling and Application of a Modified Attributional  Psychometric Instrument...Modeling and Application of a Modified Attributional  Psychometric Instrument...
Modeling and Application of a Modified Attributional Psychometric Instrument...
 
A0330107
A0330107A0330107
A0330107
 
Organization effectiveness assesment of cocacola using the goals approach mod...
Organization effectiveness assesment of cocacola using the goals approach mod...Organization effectiveness assesment of cocacola using the goals approach mod...
Organization effectiveness assesment of cocacola using the goals approach mod...
 
Research writing technique
Research writing techniqueResearch writing technique
Research writing technique
 
1820-02141300020S.pdf
1820-02141300020S.pdf1820-02141300020S.pdf
1820-02141300020S.pdf
 
Shared objective versus collaboration
Shared objective versus collaboration Shared objective versus collaboration
Shared objective versus collaboration
 
IRJET - Bankruptcy Score Indexing
IRJET - Bankruptcy Score IndexingIRJET - Bankruptcy Score Indexing
IRJET - Bankruptcy Score Indexing
 
Mutinda bernadette, gakenia judith, kangu maureen and kamau stephen what ma...
Mutinda bernadette, gakenia judith,  kangu maureen and kamau stephen  what ma...Mutinda bernadette, gakenia judith,  kangu maureen and kamau stephen  what ma...
Mutinda bernadette, gakenia judith, kangu maureen and kamau stephen what ma...
 
CHAPTER-1 Discussion 11) DiscussionCOLLAPSEIT value Infor.docx
CHAPTER-1 Discussion 11) DiscussionCOLLAPSEIT value Infor.docxCHAPTER-1 Discussion 11) DiscussionCOLLAPSEIT value Infor.docx
CHAPTER-1 Discussion 11) DiscussionCOLLAPSEIT value Infor.docx
 
Tam &amp; toe
Tam &amp; toeTam &amp; toe
Tam &amp; toe
 
3.activity 2 differentiating between applied research and basic research
3.activity 2  differentiating between applied research and basic research3.activity 2  differentiating between applied research and basic research
3.activity 2 differentiating between applied research and basic research
 
A New Framework For Managing IT-Enabled Business Change
A New Framework For Managing IT-Enabled Business ChangeA New Framework For Managing IT-Enabled Business Change
A New Framework For Managing IT-Enabled Business Change
 
seo training in hyderabad
seo training in hyderabadseo training in hyderabad
seo training in hyderabad
 
ORGANISATIONAL EFFECTIVENESS ASSESSMENT SLIDES (1).pptx
ORGANISATIONAL EFFECTIVENESS  ASSESSMENT SLIDES (1).pptxORGANISATIONAL EFFECTIVENESS  ASSESSMENT SLIDES (1).pptx
ORGANISATIONAL EFFECTIVENESS ASSESSMENT SLIDES (1).pptx
 
Implementation of a decision support process for evaluating the correlation ...
Implementation of a decision support process for evaluating the  correlation ...Implementation of a decision support process for evaluating the  correlation ...
Implementation of a decision support process for evaluating the correlation ...
 
Enablers of TMT support fr integrated management control systems innovations
Enablers of TMT support fr integrated management control systems innovationsEnablers of TMT support fr integrated management control systems innovations
Enablers of TMT support fr integrated management control systems innovations
 
Application of OD interventions.pdf
Application of OD interventions.pdfApplication of OD interventions.pdf
Application of OD interventions.pdf
 
In Chapter 8.4 of the text, the author lays out several action items.docx
In Chapter 8.4 of the text, the author lays out several action items.docxIn Chapter 8.4 of the text, the author lays out several action items.docx
In Chapter 8.4 of the text, the author lays out several action items.docx
 
Running Head ANNOTATED BIBLIOGRAPHY – APPLICATION 31ANNOTATED .docx
Running Head ANNOTATED BIBLIOGRAPHY – APPLICATION 31ANNOTATED .docxRunning Head ANNOTATED BIBLIOGRAPHY – APPLICATION 31ANNOTATED .docx
Running Head ANNOTATED BIBLIOGRAPHY – APPLICATION 31ANNOTATED .docx
 

Outsourcing

  • 1. IT OUTSOURCING SUCCESS: A MULTI-DIMENSIONAL, CONTEXTUAL PERSPECTIVE ON OUTSOURCING OUTCOMES Sara Cullen Department of Information Systems The University of Melbourne scullen@cullengroup.com.au Peter B. Seddon Department of Information Systems The University of Melbourne p.seddon@unimelb.edu.au and Leslie P. Willcocks London School of Economics L.P.Willcocks@lse.ac.uk Submitted to the Second information Systems Workshop on global Sourcing: Service, Knowledge and Innovation Copyright ©Cullen, Seddon, and Willcocks January 2008. All Rights Reserved
  • 2. IT OUTSOURCING SUCCESS: A MULTI-DIMENSIONAL, CONTEXTUAL PERSPECTIVE ON OUTSOURCING OUTCOMES ABSTRACT This paper proposes and demonstrates the usefulness of a new conceptualization of information technology outsourcing (ITO) success. Based on results from three ITO surveys conducted during 1994-2000, a review of the literature, and data from 49 in-depth ITO cases, it is argued that although some organizations may, at times, seek outcomes from outsourcing similar to other organizations, fundamentally what each firm seeks from outsourcing is different. Accordingly, it is argued, studies that recognize the idiosyncratic and changing nature of outcomes sought are likely to offer greater insight into what comprises successful outsourcing. Developing this idea, the paper proposes an ITO outcomes framework consisting of a list of 25 goals that organizations frequently pursue when outsourcing IT. The list reflects most goals pursued by most organizations, but only some of these goals are expected to be applicable to any given organization at any given time. The key argument in this paper is that ITO success should be assessed by, first, asking organizations to nominate the outcomes that were/are most important to them at various times in the life of the contract, then second, gauging the extent to which each organization has achieved its nominated outcomes during the period when those outcomes were being pursued. The usefulness of the framework is assessed using seven in-depth case studies and a 2007 survey with responses from 56 large organizations. The results from these 63 organizations show that (a) all 25 goals were considered “applicable” by at least 20% of these organizations, (b) no organization set out to achieve all 25 goals, (c) the goals pursued changed with time, and (d) no important goals were missing (except, perhaps, relationships). It is therefore suggested that the instrument presented in Appendix A is a useful tool for future research into ITO success. 2
  • 3. INTRODUCTION Pervasive adoption has made information technology outsourcing (ITO) a growing multi-billion dollar industry Dibbern et al, (2004). The market is ever maturing, suppliers and their offerings ever expanding, and technology advancements are increasingly enabling the separation of management, delivery, and operations. Furthermore, with “offshore outsourcing” attracting increasing attention, the level of ITO activity seems set to grow even larger. However, despite over decade of research into ITO, the dependent variable for much ITO research, ITO success, is surprisingly under-researched. In their comprehensive reviews of the literature, Hui and Beath (2002) and Dibbern et al. (2004) attribute disparate conclusions on ITO success, at least in part, to the lack of an accepted success construct. Supporting this view, Lee et al. (2004)—who used the Grover et al. (1996) instrument to measure ITO Success—suggest that metrics of success need further development: “As outsourcing grows in complexity, researchers need to develop more sophisticated metrics to assess the success of outsourcing ventures”. One of the key issues concerning the ITO success construct is whether a certain outcome, e.g., cost savings, is desirable and therefore applicable to every outsourcing initiative, or whether ITO success is so idiosyncratic that one must assess it against each organization’s own, different, criteria. Dibbern et al. (2004), for instance, argue that ITO is such a complex phenomenon that context plays a much more significant role in ITO than in other areas of IS success measurement. They further argue that expectations, and their realization, are critical to any research into ITO success and are more closely tied to predefined criteria and actual results. Echoing this view, Lacity et al. (1996) report that the criteria that drove an organization’s perception of success varied between organizations, and elsewhere Lacity and Willcocks (2001) explicitly recognize that outcomes are more appropriately assessed relative to each organization’s goals rather than assuming that all organizations want the same things to the same degree (e.g., cost savings). Unrecognized in most of the literature is that outcomes sought from outsourcing have a temporal dimension, as well as varying from organization to organization. Only two studies by King and 3
  • 4. Malhotra (2000) and Hui and Beath (2002) explicitly recognize the temporal nature of an organization’s outsourcing goals. In both these studies, short-term outcomes were defined as operational, mid-term as tactical and learning, and long-term as strategic. However, associating a particular outcome to a time-period for benefit realization does not recognize the fact that organizations’ operational, tactical, and even strategic goals for outsourcing may change over the life of the contract. In response to these three concerns, i.e., prior researchers’ arguments that (a) further work is required to refine the ITO success construct, (b) what constitutes ITO success may differ from organization to organization, and (c) organizational goals for ITO change over time, the objective of this study is to provide a comprehensive framework for conceptualizing and assessing ITO success. To demonstrate the contribution of our framework, we compare it to what we regard as the best instrument currently available for measuring ITO success, namely that of Grover et al. (1996) 1. We identify some difficulties with their framework and provide a solution to those difficulties in the form of the new instrument in Appendix A. The contributions of this study are the new conceptual framework; the evidence that different organizations do seek different outcomes from outsourcing; the evidence that these goals change over time; the insight that satisfaction is a valid perceptual measure of ITO success because it draws on the respondent’s goals, not on some researcher’s pre-defined list; and the ITO Success measurement instrument presented in Appendix A that is constructed around these insights. Use of the new conceptual framework proposed in this study will, we hope, help future researchers build better theories to explain why some outsourcing projects are more successful than others. New conceptual frameworks correspond to what Gregor (2006) calls Analysis theories. Gregor’s criteria for evaluating Analysis theory are as follows: ‘If any classification system is developed, implicit claims are that the classification system is useful in aiding analysis in some way, that the category labels and groupings are meaningful and natural, and that hierarchies of classification are appropriate (most important divisions are shown at the highest level). The logic for the placement of phenomena into categories 1 In July 2007, Google Scholar reported 164 citations to the Grover et al. (1996) paper. 4
  • 5. should be clear, as should the characteristics that define each category. In addition, important categories or elements should not be omitted from the classification system, that is, it should be complete and exhaustive. A previous classification system could be revised as new entities come to light, or some preferable way of grouping or naming categories is identified. A judgement as to the degree to which the theory satisfies these criteria allows one to assess the contribution to knowledge’. (p.264) In this study, we attempt to satisfy all the above criteria for making a successful contribution to an Analysis theory of ITO Success measurement. In addition, however, the current study offers more than just a taxonomy of different possible types of outcome from IT outsourcing. Our framework also embodies the important insight that not all organizations pursue all possible outcomes listed in the framework. This means that in assessing ITO success, each respondent must first indicate which goals were important to his/her organization at the time of interest, then ITO success should be evaluated in terms of the achievement of those goals, not the achievement of all possible goals. To present our case for the validity and usefulness of this new ITO success framework, the paper proceeds as follows. First, the framework is presented and justified in Section 2. Second, in Section 3, the usefulness of the framework is assessed using data from (a) seven in-depth case studies conducted during 2003 and 2004, and (b) 56 responses from a 2007 survey of large organizations with ICT outsourcing contracts. Finally, some further justification of the framework is presented in the Discussion section, Section 4, along with a discussion of the generalizability of the empirical findings from Section 3. A FRAMEWORK FOR ASSESSING IT OUTSOURCING SUCCESS Table 1 contains what we claim is a comprehensive (25-point) list of the most commonly intended outcomes from ITO. It represents a collective view of the goals of many organizations (as opposed to any single organization). As mentioned earlier, a research instrument for assessing ITO success based on this framework is presented in Appendix A. 5
  • 6. The method proposed for using this instrument is to: a. ask interviewees or survey respondents which of the 25 possible outcomes are (i) applicable to their organization, (ii) initial primary intended outcomes, (iii) current primary intended outcomes, and (iv) future primary intended outcomes; b. ask them to identify any other primary intended outcomes not in the list of 25; c. ask them to score on a Likert scale the extent to which those outcomes have been achieved; and d. if comparison with ICTO success in other organizations is intended, calculate an average score for intended outcomes at the relevant time in the life of the contract. Table 1: ITO Outcomes and References2 Value for Money Other research studies that have discussed this goal 1. Demonstrable value for money Fowler and Jeffs (1998), McAulay et al. (2002), Hui and Beath (2002) Mylott (1995), Apte and Sobol (1997), Klepper and Jones (1998), 2. Market price under internal cost Fowler and Jeffs (1998), Lacity and Willcocks (2001), McAulay et al. (2002),Dibbern et al. (2004) Improved Financial Results Apte and Sobol (1997), Lacity and Willcocks (2001), McAulay et al. 3. Ongoing cost reduction (2002), Lee et al. (2004) Mylott (1995), Grover et al. (1996) Q.6, Apte and Sobol (1997), 4. Stabilise and predict costs Klepper and Jones (1998), Hurley and Costa (2001) 5. Means of financing assets Apte and Sobol (1997), Klepper and Jones (1998) Cross (1995), Mylott (1995), Klepper and Jones (1998), Lacity and 6. Convert capital to operating expense Willcocks (2001), Hurley and Costa (2001), Lee et al. (2002) Mylott (1995), Grover et al. (1996) Q.4&5, Klepper and Jones 7. Aggregate total demand for economies (1998), Fowler and Jeffs (1998) Mylott (1995), McFarlan and Nolan (1995), Klepper and Jones 8. Cash for sale of assets (1998), Lee et al. (2002) 9. Reduce staff numbers Mylott (1995), Fowler and Jeffs (1998), McAulay et al. (2002) 10. Rationalise/consolidate assets Fowler and Jeffs (1998), Lacity and Willcocks (2001) 11. Remedy for poor performance [Anon3] Improved Operations Other research studies that have discussed this goal Fowler and Jeffs (1998), Domberger et al. (2000), Lacity and 12. Improve service Willcocks (2001), Hurley and Costa (2001), McAulay et al. (2002), Dibbern et al. (2004) 13. Obtain services not available internally Klepper and Jones (1998), McAulay et al. (2002) 14. Improve discipline/ accountability Lacity and Willcocks (2001) 2 Items in bold correspond to those in Grover et al.’s (1996) ITO success measure, discussed later. 6
  • 7. Improved Operations Other research studies that have discussed this goal Mylott (1995), Grover et al. (1996) Q.2&3, Apte and Sobol (1997), Klepper and Jones (1998), Fowler and Jeffs (1998), Lacity and 15. Obtain better/more expertise Willcocks (2001), Hurley and Costa (2001), McAulay et al. (2002), Lee et al. (2002) 16. More flexible work practices Fowler and Jeffs (1998), McAulay et al. (2002) 17. Align resource supply to demand/ Cheon et al. (1995), Mylott (1995), Apte and Sobol (1997), Klepper minimize capacity gap and Jones (1998), Hurley and Costa (2001), Lee et al. (2002) Mylott (1995), Grover et al. (1996) Q.7&8, Apte and Sobol (1997), 18. Obtain better/more technology Klepper and Jones (1998), Fowler and Jeffs (1998), Hurley and Costa (2001), McAulay et al. (2002), Lee et al. (2002) Grover et al. (1996) Q.5, Lacity and Willcocks (2001), McAulay et 19. Standardize technology al.(2002) 20. Standardize services Lacity and Willcocks (2001), McAulay et al. (2002) Strategic Outcomes Other research studies that have discussed this goal Quinn and Hilmer (1994), Mylott (1995), Grover et al. (1996) Q.1, 21. Concentrate on core business Fowler and Jeffs (1998), Quinn et al. (1990), Klepper and Jones (1998), Hurley and Costa (2001), Lee et al. (2004) Grover et al. (1996) Q.1, Apte and Sobol (1997), Klepper and Jones 22. Refocus internal IT staff on high (1998), Fowler and Jeffs (1998), Lacity and Willcocks (2001), value/strategic activities McAulay et al. (2002), Lee et al. (2004) Klepper and Jones (1998), Hurley and Costa (2001), Lacity and 23. Contribute to business Willcocks (2001), Hui and Beath (2002) Mylott (1995), Klepper and Jones (1998), Grover et al. (1996) 24. Access to best practices, new Q.3&8, Fowler and Jeffs (1998), Lacity and Willcocks (2001), developments McAulay et al. (2002) 25. Industry development Lacity and Willcocks (2001) The rationale for using the above method for measuring ITO success is that the success of an organization’s outsourcing endeavors should be assessed against its own goals for the project, not in terms of some researcher-assumed goals. By contrast, our benchmark nine-item instrument from Grover et al. (1996) (a) assumes that its nine items are applicable in all situations, and (b) does not ask about outcomes such as obtaining value for money, cost savings, and improved service quality, that (i) have been argued by authors such as Domberger (1998) Domberger et al. (2000) and to be fundamental reasons for outsourcing, and (ii) are the goals most frequently checked by respondents to our survey (reported below) as goals applicable to their organizations. Since a respondent’s Satisfaction with ITO will be assessed against whichever goals are important to that respondent, we accept that any sensible question about satisfaction with ITO, such as Grover et al.’s question 9: “We are satisfied with our overall benefits from outsourcing”, will always yield a valid perceptual indication of ITO success (no matter which goals the organization has decided to pursue, nor how much such goals have changed since the inception of the deal). What distinguishes our measure is that we do not 7
  • 8. accept that it is valid to assume that the eight remaining questions in the Grover et al. (1996) instrument are always applicable to all respondents. Developing the 25-point list of possible intended outcomes The following process was used for developing the list of possible intended outcomes in Table 1. First, the framework builds on answers to questions on ex ante goals and ex post outcomes from outsourcing in a series of three surveys on ITO conducted in 1994, 1997, and 2000 [Anon. 1,2,3]. During the course of those surveys, the list of outcomes evolved from seven in the 1994 survey, to 15 in 1997, to 21 in 2000. Each successive survey incorporated lessons from open items from the prior surveys (e.g. respondents were always invited to suggest additional outcomes sought not in the lists provided) and new ideas from the literature. For instance, the 2000 survey had been compared and reconciled with the twelve goals from the Lacity and Willcocks (2002a) survey. Second, the list of 21 commonly pursued ITO outcomes from the 2000 survey [Anon. 3] was refined into 25 by the lead author, based on (a) a review of the literature, and (b) a thorough analysis of 49 case studies of ITO projects. With respect to these case studies, the lead author had participated as a senior outsourcing consultant in 49 ITO projects spanning 51 countries during 1994-2002, and had detailed first-hand knowledge of the 49 cases. (A list of the types of organization and year of each project is documented in [Anon. 4].) Working documents reviewed for each project included plans, contracts, reports, evaluations, correspondence, presentations, minutes, reviews, and audit reports. The process involved scanning these documents for each of the 49 projects looking for additional outsourcing goals not already covered in the framework. Third, to ensure that we built on the insights of prior researchers, the 25 outcomes were compared to goals and outcomes reported in the ITO literature. For each of the 25 possible outcomes identified in this study, prior studies that have discussed that outcome are summarized in the right-hand column in Table 1. Not all studies used the same terms, so there is not an exact one-to-one mapping, but the underlying concepts are similar. In particular, we tried to identify 8
  • 9. indicators of ITO success that were not in our list. As one might expect, Table 1 shows that although no prior study has reported all 25 outcomes, each outcome other than the eleventh (remedy for poor performance) has been discussed in at least one study by prior researchers. Finally, as with the Grover et al. (1996) study which grouped items into the three categories, the 25 outcomes were grouped into what we think are four conceptually distinct categories. According to Gregor (2006) in an Analysis-theory paper: “The logic for the placement of phenomena into categories should be clear, as should the characteristics that define each category”. We compare our categorization scheme to that of Grover et al. (1996) in Table 2. Grover et al.’s three categories correspond almost exactly to the three most important “primary reasons for outsourcing” reported by Saunders et al. (1997) (p.70), namely, technological considerations, cost savings, and strategic considerations. The reason for advancing our alternative to Grover et al.’s and Saunders et al.’s categorization is that, as Domberger (1998) suggests, outsourcing is only worth doing if the net cost to the client organization drops as a result of outsourcing, subject to the proviso that there is no drop in service quality. This suggests that two key constructs in assessing ITO success are service quality and cost. In our framework, the first construct, success in meeting the client organization’s service goals is assessed using the group of questions headed “Improved Operations” in Table 1. Meeting such service goals seems to be a more fundamental objective than achieving Grover et al.’s and Saunders et al.’s “Technological benefits”, which are (one hopes) a source of improved service outcomes (Grover et al., 1996; Saunders et al., 1997). Second, success in meeting the client organization’s cost goals is assessed using the group of questions headed “Improved Financial Results” in Table 1. This is similar to Grover et al.’s (1996) Economic success category (and Saunders et al.’s (1997) Cost Savings), but it also includes the notion of improved financial control, which does not necessarily imply cost savings. Third, our “Value for money” category then assesses the organization’s success in balancing these service and cost objectives. There is no counterpart for this “value for money” construct in the Grover et al. instrument, but it has been mentioned by Fowler and Jeffs (1998), McAulay et al. (2002), and Hui and Beath (2002). If one wanted a single measure of ITO success, Value for money would seem to be a good candidate. Finally, our “Strategic” category is very similar to that of Grover et al. (1996); it is 9
  • 10. concerned with whether outsourcing helps the client organization to focus on its core business. Table 2: Comparing success categories in this study with those from Grover et al. (1996) Outcome categories proposed in this study Grover et al.’s (1996) ITO Success categories Category Definition Category* Definition (p.93) Value for money Value for money Economic “utilize expertise and Improved Cost reduction and stability economies of scale” “to Financial Results manage its cost structure” Improved Improved service, including Technological “gain access to leading-edge Operations access to new and better IT” technology Strategic Focus on the core business Strategic “enable a firm to focus on its core business” *Note: This is a conceptual classification, not one backed by empirical evidence. In Grover et al.’s factor analysis, reported in their Table 3, p.102, all eight factors loaded on the one construct. In short, based on the process summarized above, it is argued that the 25-point ITO outcomes framework in Table 1 provides a comprehensive summary of most types of benefits that organizations have typically sought to achieve from ITO. The final list is not intended to represent all possible goals that every organization may have for ITO - only those that were observed regularly. For example, excluded from the framework was the possible desired outcome of transferring public-sector staff to the private sector. This was a unique and infrequent government-specific goal. Another example possible desired outcome also excluded from the framework was obtaining non-unionized labor. This was only applicable to organizations in a troubled unionized environment. Different organizations pursue different outcomes from IT Outsourcing In assessing ITO success, it is important to understand that only some of the 25 goals from Table 1 are likely to be pursued in any given outsourcing deal. This is particularly apparent when one examines results from the 2000 survey [Anon. 3] (which had 235 responses from large organizations) where 17 goals from the 25 in Table 1 were included in that survey. As shown in 10
  • 11. Table 3, each of the 17 goals from the 2000 survey was a primary reason for outsourcing for some organizations whilst being not applicable for others. In short, based on results from both the 2000 survey (and the 49 case studies), it is clear that ITO success measurement must recognize that different organizations pursue different goals in different deals. This is why using a “one size fits all” approach to ITO success measurement is inappropriate. According to Gregor (2006) the contribution of an Analysis-theory paper is assessed by considering the extent to which its new classification scheme is different to, and more helpful than, the old one. To enable such a comparison, the first eight items from the Grover et al. (1996) instrument are also shown in column 6 in Table 3. (The ninth question, quoted earlier, which asked about overall satisfaction is not considered further because it does not appear in Grover et al.’s subsequent analysis, e.g., see their Table 3.) Comparing columns 1 and 6 in our Table 3 it is apparent that there is no clear match in the Grover et al. instrument for thirteen questions in column 1, yet as shown in columns 2 and 3, considerable numbers of respondents indicated that these outcomes were of primary or secondary interest to their organizations. For example, there is no clear match in the Grover et al. (1996) instrument for question 3 “Ongoing cost reduction”, or question 12 “Improve service”, or question 13 “Obtain services not available internally”, yet as shown in column 2, many respondents indicated that these were primary reasons that their organizations entered into outsourcing contracts. In addition, there are some questions in the Grover et al. instrument that are not relevant to some organizations. For example, in response to question 18 “Obtain better/more technology”, 41 of 185 organizations that answered this question indicated in column 4 that this was not a primary or secondary goal for their organization, yet Grover et al. ask two questions (7 and 8) about this outcome. Likewise, in response to question 21 “Concentrate on core business”, 44 of 190 organizations indicated that this was not a primary or secondary goal for their organization. In proposing the new framework in this paper, our argument is simply that if an organization does not set out to achieve a particular goal, it does not make sense to evaluate ITO success by asking if they have achieved a good outcome in respect of that non-desired goal. 11
  • 12. Table 3: Desired ITO Outcomes from the lead author’s Survey [Anon 3] matching Table 1 and items from the Grover et al.’s (1996) ITO Success Instrument Second Outcome (numbered to Primary -ary Not Grover et al. (1996) correspond to Table 1) reason reason applic. Total (Column 1) (Col. 2) (Col. 3) (Col. 4) (Col.5) (Col. 6) 3. Ongoing cost reduction 52 57 81 190 4. Stabilise and predict 6. We have increased control of costs* IS expenses 6. Convert capital to operating expense 24 45 112 181 4. We have enhanced economies of scale in human 7. Aggregate total demand resources for economies* 5. We have enhanced economies of scale in technological resources 8 Cash for sale of assets 3 17 161 181 9 Reduce staff numbers 25 57 100 182 10 Rationalise/consolidate assets 29 40 112 181 11. Remedy for poor performance 6 21 154 181 12 Improve service 64 65 56 185 13 Obtain services not available internally 94 44 54 192 14 Improve discipline/ accountability 25 69 89 183 15. Obtain better/more 2. We have enhanced our IT expertise competence 3. We have increased access 115 61 17 193 to skilled personnel 16 More flexible work practices 40 54 88 182 17 Align resource supply to demand/ minimize capacity gap 71 60 53 184 18 Obtain better/more 7. We have reduced the risk of technology technological obsolescence 8. We have increased access to key information 69 75 41 185 technologies 21 Concentrate on core 1. We have been able to business 83 63 44 190 refocus on our core business 22 Refocus internal IT staff 1. We have been able to on high value/strategic refocus on our core business activities 66 69 51 186 23. Contribute to business 31 61 87 179 24. Access to best 3. We have increased access practices, new to skilled personnel developments* 8. We have increased access to key information 12
  • 13. technologies 25 Industry development 18 30 130 178 * Item from Table 1 not included in the 2000 survey, but which matches a question from Grover et al. (1996) It is this conditional nature of the various possible outcomes from Table 1 that creates difficulties for conventional approaches to instrument development. For example, column 4 in Table 3 shows that not all items apply to all organizations. This means it is not possible to use conventional first- or second-generation factor-analytic techniques to refine the list of 25 items into an instrument for measuring ITO success or even to help in grouping them as we have done in Table 2. Instead, we had to rely on human judgment to group items that seemed similar under the four headings in Table 1, i.e., Value for money, Improved Financial Results, Improved Operations, and Strategic outcomes. Desired outcomes also change over time In addition to recognizing that different organizations pursue different goals for ITO in different deals, it is also important when assessing ITO success to understand that the outcomes sought from ITO change over time, even for the one deal. Management may start out with quite ambitious goals for an outsourcing project, encounter problems, then focus on some more targeted, but more achievable, goals for their ITO deal. Since perceptions of success will normally be gauged relative to current goals, it is suggested that in asking managers to identify intended outcomes, care should be taken to distinguish between at least three types of intended outcome, namely: (1) initial primary intended outcomes – the focus at the outset of the deal; (2) current primary intended outcomes – the current focus of the deal; and (3) future primary intended outcomes – the future focus of the deal. ASSESSING THE COMPLETENESS OF THE FRAMEWORK The preceding section has presented a framework that corresponds to what Gregor (2006) describes as an Analysis theory of ITO success measurement. The framework is the list of 25 types of outcome shown in Table 1, grouped into four categories as defined in Table 2, plus the 13
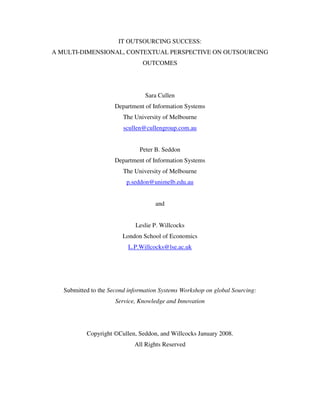
  • 14. argument that because different organizations pursue different goals at different times, ITO success should normally be assessed against the currently sought goals of each individual organization. The usefulness of this theory is assessed empirically in this section. The first half of this section uses seven in-depth case studies as its source of data. The second half uses 56 responses from a survey (plus results from the seven case studies) to extend that assessment to a broader range of organizations. The Cases A case-study methodology was the technique chosen for our first assessment of both the completeness of the framework in Table 1, and the extent to which outcomes sought had changed over time. The questions were: (a) Were any common objectives missing from the list in Table 1? (b) Which objectives motivated your organization to engage in outsourcing? and (c) Are those objectives still relevant today? For these case studies, in 2003 we invited 14 of the 100 largest IT-using organizations in one State (anonymized for reviewing), to participate in the study. Seven of the 14 organizations accepted; each became the subject of a case study. Unlike the 49 ITO case studies used in constructing the ITO-outcomes framework in Table 1, the lead author had no prior association with any of the organizations in these cases. The seven participating organizations were from five different industries comprising communications and transport services, manufacturing, mining, government and conglomerates of multiple industries. The size of the seven organizations ranged from US$ 2B to US$ 22B in per annum revenue and from 7,800 to 51,000 employees as shown in Figure 1 14
  • 15. Figure 1: Test Cases - Organization Size Size - Annual Reve nue Size - FTEs 25 60,000 20 50,000 Revenue (A$B) 40,000 15 FTEs 30,000 10 20,000 5 10,000 0 0 1 2 3 4 5 6 7 1 2 3 4 5 6 7 Case Case Guided by Lacity and Hirschheim’s (1993) observation that much of the ITO literature tends to be over optimistic because the evaluation is often too early in the agreement, i.e., during the “honeymoon period”, it was decided to focus on a major contract in each of these seven organizations that had been in operation for at least two years. After discussions with the CIOs at the seven organizations, seven contracts were selected. With the exception of Case 6 for which the contract was completed in one year, the contracts had been in operation for no less than two years, and up to five years, at the time of the interviews. Overall, as documented later in Figure 2, cases 1 and 7 would probably be called failures. Their average ITO success scores as measured by our instrument were 1.9 and 2.8 out of five, respectively. By contrast, cases 4 and 5 would be considered successes. Their average ITO success scores were 4.1 and 4.5, respectively. The seven cases involve contracts signed between 1999 and 2001, ranging from US$1 million to $133 million per annum. Using the guidelines of [Anon. 5] for describing key features of these contracts, these contracts are summarized in Table 4. Service scope ranged from whole-of-IT to selective services; geographic scope from state-based to global; supplier grouping from panels to sole suppliers; financial scale from large to small; pricing from fixed to unit-based; duration from long to short-term; resource ownership from the supplier owning all the service delivery resources to the supplier providing purely the labor component; and commercial relationship structures from arms-length to co-sourcing. 15
  • 16. Table 4: Configurations of the Seven Test Cases Case 1: Case 2: Case 3: Case 4: Case 5: Case 6: Case 7: MAN1 SERV1 MIN1 GOV1 GOV2 CON1 MAN2 Apps Single Note All IT except Data center Whole of develop- Whole of app Service book networks & facility, ops, IT ment and IT develop- mgmt apps & equip (1) Scope support ment Grouping Parent, all All units, Parent, Parent and All Parent and Recipient units, all all spin Parent subsidiaries subsidiaries schools subsidiaries subsidiaries offs optional Geographic National National Global State State National National Best of (2) Supplier Grouping Sole Prime Prime Sole Sole Sole Breed (3) Not Relative 80% 15% 33% 26% 23% 25% Financial tracked Scale Absolute $40M $30M $133M $31M $1M $16M $10M (4) Pricing Framework Fixed Unit Hybrid Unit Fixed Fixed Fixed Rollover Rollover Rollover Rollover (5) Duration (years) Fixed (5) Fixed (5) Fixed (1) (7+1+1) (3+3) (6+ TBD) (3+2) Supplier - Supplier – Supplier Supplier Supplier Supplier – Supplier – (6) Resource ownership all labor – all – labor – labor all all (7) Commercial Arms Co- Value Arms Co- Arms Value-add Relationship length sourcing add length sourcing length Detailed semi-structured interviews totaling 34 hours were conducted with the CIO and the top contract manager by the lead author at the headquarters of each firm. As explained earlier, the interview questions are attached in Appendix A. Two senior managers per organization were interviewed to reduce reliance on a single source of evidence. The interviews were digitally recorded, manually recorded on the instrument form (Appendix A), and then coded into a database. In addition, documents such as contracts, correspondences, and performance evaluations were used to substantiate each interviewee’s statements and perceptions. To explore the extent to which intended outcomes for outsourcing change, interviewees at each case organization were first asked to identify which of the 25 ITO outcomes in Table 1 (a) were applicable to their organization (as potential outcomes that could have been sought), and (b) their organization had pursued as desired outcomes. In addition, they were asked if any desired outcomes were missing from the list. In response to this last question, one additional outcome mentioned in two of the seven cases, was “good relationships with suppliers”. This outcome, which is an outcome driver rather than a desired outcome per se, is discussed in more detail in 16
  • 17. the Discussion section below. As required by the instrument, three timeframes were used for classifying outcomes sought: 1 initial primary intended outcome – the focus at the outset of the deal, 2 current primary intended outcome – the current focus of the deal, and 3 future primary intended outcome – the future focus of the deal. The degree to which each desired outcome was achieved was assessed on a five-point Likert- type scale: 1 = very poor outcome against expectations 2 = poor outcome against expectations 3 = no perceptible outcome against expectations 4 = good outcome against expectations 5 = very good outcome against expectations Case-study findings Table 5 summarizes outcomes that were judged by the managers in the case study organizations to be applicable to their organization (heading “AO”), initial primary outcomes sought (“IPO”), current primary outcomes sought (“CPO”), and future primary outcomes sought “FPO”). A tick/check in the AO column means that the interviewees said that outcome was applicable to their organization. In other words, it would have been meaningful for their organization to try to achieve that goal. A tick/check in any of the three columns to the right of the AO column indicates that the interviewees said that this was a goal of interest to their organization either in the past, now, or in the future. The blacked-out cells indicate outcomes that were judged to be not applicable to the organization in question. They had no tick in the AO column. 17
  • 18. Table 5: Applicable and Intended Outcomes per Case Case 1 Case 2 Case 3 Case 4 Case 5 Case 6 Case 7 Outcome Attributes AO IPO CPO FPO AO IPO FPO AO IPO CPO FPO AO IPO CPO FPO AO IPO AO IPO CPO FPO AO IPO CPO Value for Money 01. Value for money 02. Price under internal cost Improved Financial Results 03. Ongoing cost reduction 04. Cost stability 05. Finance assets 06. Convert to operating expense 07. Aggregate demand 08. Cash from asset sales 09. Reduce staff 10. Rationalize assets 11. Remedy for poor performance Other Improved Operations 12. Improve service 13. Obtain services not available internally 14. Improve discipline/ accountability 15. Obtain better/more expertise 16. Flexible work practices 17. Scalability 18. Obtain better/more technology 19. Standardize technology 20. Standardize services Other Strategic Outcomes 21. Focus on core business 22. Refocus internal IT staff 23. Contribute to business 24. Access best practice, developments 25. Industry development Other Total attributes 24 23 2 8 14 4 7 27 10 4 3 22 5 7 5 9 7 23 10 9 9 25 4 5 Notes: 1. AO = Applicable outcome, IPO = initial primary outcome sought, CPO=current primary outcome sought, FPO=future primary outcome sought. Blacked-out cells mean “outcome not applicable”. 2. Case 2 had no current goals. The Case 5 contract had ended, thus had only initial goals. Case 7 had not identified any future goals at the time of the study. 3. “Other” comprises: Case 3: financial – “utility purchasing form” and strategic – “use of the innovation fund”; Case 4: strategic – “technology adoption by users”; Case 5: operational – “risk management”; and Case 6 strategic -“partnering-style relationship”, Case 7 strategic – “controlled relationship”. 18
  • 19. As shown in the “Total attributes” row at the bottom of Table 5, all 25 outcomes were judged to be applicable to at least one of the seven case organizations, all 25 had been sought by at least one of them, all seven case organizations had changed and reduced the number of outcomes sought, and no two firms had the same portfolio of applicable, initially sought, or outcomes sought now. Furthermore, although the list of 25 possible outcomes is not intended to be fully comprehensive, none of the interviewees at the seven case organizations identified any common goals that were missing from the list other than “good relationships with suppliers” (discussed in more detail in the Discussion section below). These findings support our argument that (a) the list of 25 potential outcomes is quite comprehensive, and (b) no single set of outcomes is applicable to all organizations. In observing the changes to intended outcomes over time in Table 5, two trends appear. First, firms more experienced with outsourcing had fewer intended outcomes at the outset. The “first generation” deals (first-time outsourcing) comprised of Cases 1, 3, 4, 6, and 7 had an average of 10.5 initial intended outcomes at the outset, nearly twice that of the “second generation” firms which had an average of 5.5. Second, all organizations became more focused over time. As shown in Table 5, after the first few years of each deal, there was a general trend to reduce intended outcomes over time. The number of intended outcomes reduced to an average of 4.5 current goals and 6.5 future goals. This suggests that an organization can focus on relatively few outcomes at any given time. It appears that organizations in first-generation deals may be unrealistic at the outset; however within a few years they develop more realistic expectations. Finally, as reported in [Anon. 2; 3], Figure 2 shows that outcomes that were initial intended primary outcomes were generally achieved to a greater extent than the outcomes that were not primary goals. 19
  • 20. Figure 2: Outcomes Achieved – Primary Goals versus Non-primary Outcomes achieved Prim ary Initial Outcom es Primary Sought vs. Non-prim ary Non primary 5 Average Score 4 3 2 1 1 2 3 4 5 6 7 Case A Survey to assess the applicability of the framework In addition to the above seven case studies, we also used a survey to assess the applicability of the items in the framework in a wide variety of organizations. The questions addressed by the survey were: (a) Is it correct to assume that only some of the outcomes in Table 1 are applicable to any one organization, or are some questions applicable to all organizations?, (b) What are the most frequent goals for outsourcing in large organizations in Australia, and (c) Do outcomes sought change over time? To answer these questions we sent e-mails containing the URL for a survey to senior IT managers in 1,000 of the country’s largest IT-using organizations inviting them to complete a detailed on-line survey on ICT outsourcing in October 2006. Job titles of these 1,000 senior managers were IT Manager, Director IT, or similar (56%), CIO (18%), General Manager IT (12%). Many of those e-mails were deleted without being read, so we followed up in late October 2006 with a hard-copy version of the survey, then during December 2006 and January 2007 individually telephoned over 900 organizations that had not responded. The questionnaire included the instrument in Appendix A along with many other questions related to another study. It took approximately 30 minutes to complete. All respondents were 20
  • 21. offered free copies of a report based on the survey if they completed the questionnaire. Our records indicate that by March 2007, 102 people had started to complete the on-line version of the survey. However, only 56 completed the full survey. The completed-survey response rate is thus only 56/960 = 6%. A response rate of 6% is not as high as we would have liked, but the opinions of these 56 senior IT managers about the outcomes from their largest ICTO contract provide a lot of valuable information, discussed in sections 3.5 and 3.6. The generalizability of these findings is discussed in Section 4 below. Contextual information In order to make transferability judgments based on the analysis that follows (as suggested by Palmquist et al. (2004)) it is important to understand more about the respondent firms. For that reason, details of the respondents’ industries, organization sizes, IT budgets, and degree of involvement with IT outsourcing (which was often substantial) are provided in Tables 6 and 7. From these tables it is evident that respondent organizations (a) are from a wide range of industries and firm sizes, (b) operate in a wide range of different geographic regions, (c) have very different percentages of ICT budget outsourced (both in the country under study and offshore), and (d) typically have fewer than five ICT contracts. Table 6: Respondents by industry Industry Count Industry Count Industry Count Agriculture, forestry & fishing 1 Government - Federal 5 Media 2 Car Hire 1 Government – State 9 Minerals processing 1 Health & community Construction 1 services 1 Mining 1 Education 3 Health Insurance 1 Trade - Retail 3 Electricity, gas & water 3 Hospitality 1 Transport & storage 3 Finance & insurance 5 Law and Legal 3 Total 56 Government - City/local 4 Manufacturing 8 21
  • 22. Table 7: Characteristics of organizations in the sample Organization Attribute Count Percentage Organizational Attribute Count Percentage al attribute Range (of the 56 attribute Range (of the 56 orgs.) orgs.) Revenue $<100M 4 7 Percent ICT <10% 12 22 $100-499M 22 40 spend 10-49% 34 62 $500-999M 7 13 outsourced 50-90% 8 15 $1-4.9B 15 27 No answer 1 2 $5-20B 7 13 Percent ICT 0% 39 71 Employees <1000 12 22 spend offshore 1-9.9% 9 16 1000-4999 32 58 10-20% 4 7 5000-40000 11 20 100% 1 2 Geographic Local 5 9 No answer 2 4 coverage State 19 35 Number of 1 10 18 National 21 38 ICTO 2-4 29 53 Asia Pacific 2 4 contracts* 5-15 11 20 Global 7 13 20-120 4 7 No answer 1 2 0? 1 2 Annual ICT $<10M 21 38 Number of 1 10 18 Spend $10-99M 28 51 ICTO 2-4 29 53 $100-999M 6 11 suppliers* 5-15 11 20 20-100 4 7 * Number of contracts not equal to number of suppliers 0? 1 2 Outcomes Applicable, Initially sought, and Currently sought Respondents to the survey were presented with the instrument in Appendix A and asked to indicate goals that were applicable, initially sought, sought now, and to be sought, as well as to score outcomes achieved on the five-point Likert scale in Appendix A. Results for the 56 respondent firms have been combined with those from the seven case-study organizations (to give a total sample size of 63) and are reported in Table 83. 3 There appears to have been some respondent fatigue at this stage of the survey, because only 31 of 56 respondents actually checked any outcomes as “currently sought”. 22
  • 23. Table 8: ICT Outsourcing Outcomes applicable and sought (N=63: 56 responses from the 2007 survey combined with those from the 7 cases) Number of Mean respondents Outcome Initial Current who scored achieved Primary Primary their on a Outcome Outcome success in scale of Applicable sought Sought achieving 1=low to Outcome % (IPO) (CPO)* the outcome 5=high (Column 1) (Col. 2) (Col. 3) (Col. 4) (Col. 5) (Col. 6) Value for money 1. Demonstrable value for money 97% 44 19 60 3.52 2. Market price under internal cost 70% 33 8 40 3.53 Improved Financial Results 3. Obtain ongoing cost reduction 79% 32 17 47 3.30 4. Stabilise and predict costs 86% 34 15 50 3.77 5. Means of financing assets 35% 11 3 18 3.78 6. Convert capital to operating expense 37% 12 3 15 3.93 7. Aggregate total demand for economies 59% 23 9 30 3.63 8. Obtain cash for sale of assets 21% 6 1 6 3.32 9. Reduce staff numbers 51% 24 5 27 3.67 10. Rationalize/consolidate assets 40% 12 8 19 3.38 11. Get remedy for poor performance 57% 22 5 34 3.49 Improved Operations 12. Improve service 94% 42 18 55 3.64 13. Obtain services not available internally 84% 38 13 50 3.77 14. Improve discipline/ accountability 63% 20 12 34 3.12 15. Obtain better/more expertise 84% 40 11 50 3.42 16. Allow more flexible work practices 48% 15 7 25 3.12 17. Align resource supply to demand/ minimize capacity gap 55% 21 7 26 3.73 18. Obtain better/more technology 70% 29 6 40 3.62 19. Standardize technology 65% 27 7 35 3.88 20. Standardize services 71% 32 8 41 3.82 Strategic 21. Concentrate on core business 79% 38 10 44 3.61 22. Refocus internal IT staff on high value /more strategic activities 73% 29 14 42 3.50 23. Contribute to business (i.e. joint R&D, joint commercialisation) 43% 11 8 20 3.04 24. Access to best practices, new developments 70% 29 11 36 3.31 25. Industry development 48% 13 7 21 3.10 * Possibly due to respondent fatigue, only 31 of 56 survey respondents answered this question 23
  • 24. Lessons from Table 8 are as follows. First, all outcomes from Table 1 were considered “applicable” to at least some organizations. Three outcomes in particular, namely “Demonstrable value for money” (97%), “Improved Operations” (94%), and “Stabilize and predict cost” (86%), were applicable to almost all organizations. Frequent selection of these three items is consistent with the argument presented in the justification of the categories in Table 2 that outsourcing is fundamentally a question about value for money. Second, based on the scores in column 6, some outcomes, such as “standardizing technology”, “standardizing services”, and even “concentrating on the core business” appear to be much more achievable than others, such as “accessing best practices” and “obtaining ongoing cost reduction”. The value of working with the list of outcomes presented in this paper (Table 1 and Appendix A) is that it opens the researchers’ and respondents’ minds to this range of possible benefits. Without the list, many of these possible benefits may not be considered. Finally, the scatterplot in Figure 3 (which only shows the 26 organizations that reported non-zero numbers of both initial and current primary outcomes sought) shows that the number of reported primary outcomes sought by these 26 organizations certainly changed with time. If the number of primary outcomes sought had not changed, the dots in Figure 3—each representing a single organization—would all lie on the straight line shown sloping upwards from the origin. They don’t. Figure 3: Current Primary Outcomes (CPO) sought compared to Initial Primary Outcomes (IPO) sought for the survey respondents that reported non-zero CPO and IPO 24
  • 25. 25 Count of Current Primary Outcomes sought 20 15 10 5 0 0 5 10 15 20 25 Count of Initial Primary Outcomes sought Averaged Outcomes-achieved Scores Compared to Overall Satisfaction Although the scores on the individual items are often of more interest than any overall average measure, researchers often seek to compare ITO success across organizations. If one has access to data like that summarized in Table 8, the best way to compare overall ITO success would seem to be to compare averages of perceived success in achieving intended outcomes. The question is, “Are such averages useful for comparing ITO success across organizations?” As indicated earlier, overall satisfaction is likely to be a valid measure of ITO success because each respondent will intuitively compare success against the goals relevant to his/her organization. This means that one way to assess the validity of average outcomes-achieved scores is to compare them to overall measures of satisfaction. For that reason, two questions related to satisfaction were included in Appendix A. 25
  • 26. Table 9 reports average overall satisfaction (Overall Satisfaction), satisfaction with the service provider/s (Sat. with supplier), applicable outcome scores (Mean Outcome), primary outcome initially sought scores (Mean IPO), and primary outcomes currently sought as reported by the 63 respondents. As noted earlier, only 31 of the 56 survey respondents checked any outcomes as “currently sought”. Their mean Outcomes-achieved scores for outcomes currently sought are considerably lower than those for outcomes overall, which could explain why they have become a focus of management attention. Spearman correlation coefficients between the various measures are shown on the right of Table 9 (together with the number of observations used for calculating each correlation coefficient). No statistical tests of significance have been calculated because it is not clear that the sample is representative of the population of all large organizations in the country with ITO contracts. The correlation coefficients show that the first five measures are highly correlated4. These high correlations suggest that all five measures are tapping similar constructs. This, in turn, provides preliminary evidence that averages of the outcomes-achieved measures for individual items selected by the respondents (i.e., Mean Outcome and Mean IPO) are likely to be useful measures of ITO success. The lower mean score for Mean Primary Outcomes currently sought (CPO) and lower correlations between this and the other measures suggests that there is something different about outcomes currently sought that could be worth investigating in future research. Table 9: Means and Spearman correlation coefficients for Satisfaction with IT Outsourcing, Value for Money, and mean Outcomes scores (N=63: 56 responses from the 2007 survey combined with those from the 7 cases) Std. Spearman Correlation Coefficients (and number of observations) Overall Sat with Value for Mean Mean Mean Mean Dev Satisfaction supplier money Outcome IPO CPO Overall Satisfaction 3.42 0.96 1.000 .830 .689 .768 .752 .576 N 61 61 58 61 56 30 Sat with supplier 3.43 1.02 .830 1.000 .716 .687 .765 .430 4 If the sample were judged to be representative, SPSS says that all correlations reported in Table 9 are significantly different from zero at p<0.001, except for the correlations with Mean CPO, two of which are only “significant” at p<0.05. 26
  • 27. N 61 62 59 62 57 31 Value for money 3.56 1.01 .689 .716 1.000 .767 .723 .631 N 58 59 59 59 55 30 Mean Outcome 3.65 0.69 .768 .687 .767 1.000 .913 .725 N 61 62 59 62 57 31 Mean IPO 3.75 0.72 .752 .765 .723 .913 1.000 .458 N 56 57 55 57 57 26 Mean CPO 3.26 0.99 .576 .430 .631 .725 .458 1.000 N 30 31 30 31 26 31 Overall Satisfaction: Overall, how satisfied is your organization with this contract? Sat. with supplier: How satisfied is your organization with the outsourcing suppliers(s)? Value for money: Outcome-achieved score for Demonstrated value-for-money Mean Outcome: Mean of all the respondent’s outcome-achieved scores, equally weighted Mean IPO: Mean of outcome-achieved scores for primary outcomes initially sought, equally weighted Mean CPO: Mean of outcome-achieved scores for primary outcomes currently sought, equally weighted DISCUSSION Idiosyncratic Nature of Outcomes Sought As suggested in section 2.2, the results in the previous section demonstrate that organizations outsource for different reasons. Future discussions of outsourcing success or outcomes must recognize this fact. For example, it is not valid to assume that all organizations seek cost savings when they outsource. As shown in Table 8, row 3, cost saving was not an applicable objective for 21% of organizations studied. For such organizations, it does not make sense to assess ITO success by asking about cost savings. Consequently, any study of ITO success at the firm level requires a more detailed deconstruction of what success means for that organization. Furthermore, as demonstrated in the case studies (see Figure 2), intended outcomes are achieved to a greater degree than those that were not. This emphasizes, again, that understanding the unique nature of an organization’s desired outcome portfolio is vital for assessing ITO success. As explained in section 3.2 and Figure 3, not only did each firm have its own suite of desired outcomes, but these changed over time. In other words, an organization’s definition of success is not static. The goal posts are always moving. The original intent of the deal may not reflect the 27
  • 28. current or future intent. Any discussion regarding success must therefore also be explicit about periods during which specific outcomes were sought. Techniques Driving Success and Failure of IT Outsourcing The fact that any one firm has achieved any given outcome or group of outcomes, does not automatically mean that that same outcome or group of outcomes is achievable by any other firm that outsources its IT. Various explanations were offered by managers in the case-study organizations for their outcomes, both successes and failures. These explanations provide quite rich insights into the case organizations and the way managers in those organizations think about both outsourcing success and failure. For example, case organizations 2, 4, 5, and 6 reported that they had realized good value for money, but each attributed it to a different reason. Case 2’s management attributed their success to offering suppliers a “take it or leave it” deal “give me as much labor as I need for an hourly rate of 10% more than what it costs me inhouse”, Case 4’s to competitive tendering, Case 5’s to the fixed-price nature of the contract, and Case 6’s to the long-term duration of the contract. One might infer then, that such techniques represent successful methods for achieving value for money. However, the techniques that worked for these organizations were also identified as reasons for failure in other cases. For example, Case 5’s fixed-price configuration was also adopted by Case 1. However, in Case 1, this action caused the supplier to go bankrupt and was a poor value-for-money outcome, “we didn’t know the risk of the supplier not getting additional clients and the sustainability of their business”. Case 6’s long-term duration solution was also adopted by Case 7. However, Case 7 had a poor value-for-money outcome because the price for services in this case was higher than market rates (the second-generation deals with three new suppliers, not just one, achieved 70% cost savings over the first-generation deal). Exploring the causes of poor outcomes led to a similar conclusion about the variability of reasons for those outcomes. Cases 1 and 4 which realized very poor results in terms of being able to refocus internal IT staff on strategic activities again attributed their outcomes to different causes. In an excellent example of Kern et al.’s Winner’s Curse (2002), Case 1’s management 28
  • 29. had chosen a new-entrant supplier that had priced its services too cheaply to make a profit and Case 1’s CIO and IT team became focused on managing disputes with the service provider rather than managing IT, “I was not the CIO for nine months, three days and four hours”. This was not the reason for Case 4’s inability to refocus IT staff. Case 4 became focused on “micro- management of the users” in helping the users adopt the purchased technology because management had under-scoped the work outsourced and left out key areas that were not assigned to either party. IT staff had to carry out these activities on a reactive basis, meaning that desired refocusing was not achieved. Do these two cases mean that choosing a vendor that is not going to make money on the deal, or under-scoping the work and the retained IT organization, are causes of failure? In these two cases is the answer yes, but in other cases the answer is no. For example, like Case 1, Case 5 also chose a supplier that underbid the fixed price. However, Case 5’s supplier was able to absorb the cost overruns and deliver a successful application, thereby winning substantial future work and becoming “our number one preferred developer”. Case 5 never set out to refocus IT staff, so that outcome was not relevant to it, but nor did it have to reallocate any staff to the “firefighting” as did Case 1 and 4. Finally, as stated earlier, Case 4 did not fully scope the work nor design carefully the retained organization. Neither did Case 3, but management there have been able to rescope and reshape the contract every day since signing, and it has been able to refocus IT staff well, “we have no worker bees anymore, we focus on strategy, business analysis, architecture, and relationship management”. In short, single-factor explanations of success as well as failure are too simplistic. In different contexts, techniques that drove successful outcomes in some cases led to failure in other cases. In addition, factors that led to failed outcomes in some cases yielded good results in others. For these reasons, the wide range of success advice and prescriptions appearing throughout the literature must be viewed as highly conditional – not only in terms of the success constructs the author/s have adopted, but also in terms of the contextual situation of each of the organizations involved. 29
  • 30. Is “Relationship with Supplier” an Outcome? As mentioned earlier, a question that arose during the conduct of the case studies was whether the relationship between the parties is an outcome or a means to obtain desired outcomes. The framework in Table 1 does not explicitly recognize quality of the relationship as an outcome, yet many practitioners and researchers argue that the key to success in outsourcing is good working relationships (see for example Alborz, 2005; Kern and Willcocks, 2002; Lacity and Willcocks, 2000b). In terms of specific studies: Dibbern et al. (2004) note that success might only occur if accompanied by partnering-style behaviors; Grover et al. (1996) report that what they called “partnership”—a combination of two behaviors (supplier problem notification and the parties helping each other) and two perceptions (supplier is trustworthy and the working relationship is happy) by the client organization—was a major factor in explaining variance in perceptions of outsourcing success; and Corbett (2005) argues that outsourcing relationships replace many of an organization’s traditional assets – people, technologies, facilities, methods, and know-how, and that the relationship becomes a asset itself requiring ongoing investment. Based on these and similar studies, the importance of the relationship in achieving ITO success is indisputable. The question is, however, whether relationship goals should be treated as, say, a fifth category of outcomes in Tables 1 and 2 or as, say, a variable moderating or mediating other factors such as use of selective sourcing that are posited to be drivers of ITO success. Within this study, at least two of the seven case-study organizations had made achieving a better relationship a distinct goal, albeit not at the outset of the deal. An example goal from one organization was as follows: “better change management and communications, recognize and manage the fact that different businesses and countries have different relationships, having the vendor take a decision and take a risk”. Further, in the survey, respondents were asked “What importance to you attach to the relationship between the parties in this contract?” All 56 respondents chose to answer this question. On a scale from 1=low to 5=high, their mean score for the Importance of the Relationship was a very high 4.70 (s.d. 0.60). Thus although relationship goals are not benefits from outsourcing per se, future studies should at least consider the merit of adding relationship- type goals to the 25-point list. 30
  • 31. Generalizability of the findings from this study The response rate for the survey discussed in Section 3 was very low, so it is important to assess the extent to which the results from this study are generalizable to (a) all large organizations in the country studied, and (b) the rest of the world. Seddon and Scheepers (2006) argue that the key to drawing generalizable conclusions from any survey with less than a 100% response rate is to demonstrate—through argument—that the sample is representative, in terms of the factors of interest in the study, of the population of interest. As explained earlier, 46 of 102 respondents started but did not complete the on-line survey. Their initial responses (captured on the survey website) are compared to the 56 organizations that completed the survey in Table 10. The independent-samples t-test (equal variances not assumed) shows that ICT spend and the percentage of ICT expenditure outsourced are significantly higher for the firms that completed the survey5. Assuming that non-respondent firms are more like those who failed to complete the survey, this suggests that managers of organisations more involved in outsourcing were more motivated to complete the time-consuming survey (it took many respondents 30 minutes to complete). The inference we draw from Table 10 is that the findings reported in this study are likely to be more representative of organisations that make more intense use of ICT and of ICT outsourcing than those that do not. 5 Inferential statistics (p-values) are meaningful here because the question is whether these two samples could be random samples drawn from the same population. For average % of the ICT budget outsourced, the tests show that this is highly unlikely. 31
  • 32. Table 10: Key statistics for organizations that completed the survey compared to those that did not The 56 The 46 firms that Difference in Significance complete started but did means, (2-tailed) responses to not complete the independent the survey survey samples t-statistic Average Revenue $2.0 billion $2.1 billion 0.375 0.709 Average Employment 3,600 4,600 0.776 0.442 Average ICT spend $44 million $41 million -2.177 0.033* Average % of ICT budget 29% 14% -3.047 0.003** outsourced Average % of outsourcing 3.2% 1.6% -0.775 0.440 budget offshore Average number of 7.5 3.8 -1.365 0.176 outsourcing contracts Average number of 6.5 5.4 -0.268 0.790 outsourcing suppliers *=p<0.05; **p<0.01 Armed with this information, how generalizable are the claimed contributions of this study, first, to all large organizations in the country studied, and second, to other large organizations in the Western world? The five claimed contributions of this study and comments on their generalizability are summarized in Table 11. The analysis in Table 11 suggests that the results from this study are likely to hold true for all large organizations that outsource ICT in country X (country not specified to preserve anonymity during the review process). Further, since <other continents> (again, not specified to preserve anonymity) have similar institutional settings, we would also expect the claimed contributions of this study to apply there as well. Table 11: Generalizability of claimed contributions of this study from the 63 organizations studied to all large organizations within Country X* Claimed contribution Comment on generalizability 1. The new conceptual framework. Generalizable: It seems unlikely that other organizations with fewer outsourcing contracts would have more or very different desired outcomes. 32
  • 33. 2. The evidence that different Generalizable: If these 63 organizations have such organizations do seek different different mixes of goals it seems unlikely that outcomes from outsourcing. organizations with fewer outsourcing contracts would all have similar goals. 3. The evidence that these goals Generalizable: If the goals of the 7 case study change over time. organizations have changed, and the outcome scores for the 31 organizations scoring current primary intended outcomes in Table 9 are so different, it seems unlikely that other organizations’ goals would not also change. 4. The insight that satisfaction is a Generalizable: This was an insight based on logic, not valid perceptual measure of ITO data. It does not depend on the sample of data collected. success because it draws on the It provides the justification for the argument that the respondent’s goals, not on some correlation tests reported in Table 9 provide useful researcher’s pre-defined list. information. 5. The ITO Success measurement This contribution is generalizable because the instrument based on the above contributions above are generalizable. insights. * Country name suppressed to maintain anonymity during the review process CONCLUSIONS AND DIRECTIONS FOR FUTURE RESEARCH This paper has focused on the measurement of outsourcing success. Its primary contribution is the evidence that different organizations seek different outcomes from outsourcing and that these change over time. It follows that although ITO success may validly be assessed by asking questions about overall satisfaction6—and possibly about achievement of the four broad sub- goals in Table 1 (Value for money, Improved Financial Results, Service delivery, and Strategic outcomes), which seem to apply to most organizations—any attempt to assess ITO success in terms of more detailed criteria, such as cost savings or focusing on core business, requires identification of the different criteria relevant to each organization for each different contract at the time of the study. The 25 outcomes proposed in Table 1 represent a convenient catalog of frequently sought outcomes from ITO. Questions about the achievement of those that are relevant can be framed 6 As explained earlier, satisfaction is an acceptable measure because the respondent in each organization may be assumed to use his or her organization’s own set of goals when assessing satisfaction. 33
  • 34. in terms of past, present, and future outcomes sought as well as assessed in terms of negative, null, and positive outcome realization as shown in Appendix A. In using such an instrument it is important to understand that organizations refine their desired outcomes from their ITO deals over time. Thus while original outcomes sought may be met, longitudinal studies need to consider the achievement of different outcomes at different times. Looking forward, future research might seek to explain why organizational goals for ITO change, and whether there is merit in including questions about the relationship between ITO client and vendor as an indicator of ITO success. Further progress in understanding outsourcing and the drivers of ITO success also seems likely through studying interdependences between intended outcomes. Although Dibbern et al. (2004) did not find any study in this area, preliminary work carried out by Rouse et al. (2001) found associations between cost reduction and strategic benefits, and service and strategic benefits. In addition, Dibbern et al. called for intensive research in the area of balancing multiple outsourcing outcomes and multiple stakeholder expectations. Assessments of success are also likely to be different depending on who is surveyed and their expectations - in this study, CIOs, IT managers, and contract executives. What happens when different stakeholders are examined (i.e. users, business managers, supplier personnel) and the conflicting expectations that may surface, offers an interesting research path. Hirschheim and Lacity (1998; 2000) found that achieving multiple stakeholder goals is elusive, if not unrealistic, and involves many trade offs. These and many more research opportunities can be explored on a consistent and comparable manner once a reasonably complete ITO success construct becomes sufficiently tested and adopted. It is hoped that this research has contributed to that goal. 34
  • 35. REFERENCES [Anon 1-5] Anonymous References withheld for anonymous refereeing. Alborz, S., Seddon, P.B. and Scheepers, R. (2005) The Quality of Relationship Construct in IT Outsourcing, Proceedings of the Ninth Pacific Asia Conference on Information Systems (PACIS), pp. 1118-1131. Apte, U. and Sobol, M. (1997) “IS outsourcing practices in the USA, Japan and Finland: a comparative study”, Journal of Information Technology, 12, (4) 289-304. Cheon, M.J., Grover, V. and Teng, J.T.C (1995) “Theoretical Perspectives on the Outsourcing of Information Services”, Journal of Information Technology, 10 (4) 209-210. Corbett, M. (2005) “Outsourcing: Just the end of the beginning” in Brudenall, P. (ed) Technology and Offshore Outsourcing Strategies, London: Palgrave Macmillan, x-xiii Cross, J. (1995) “IT Outsourcing at British Petroleum”, Harvard Business Review, May-June, 94-102. Dibbern, J., Goles, T., Hirschheim, R, and Jayatilaka, B. (2004) “Information Systems Outsourcing: A Survey and Analysis of the Literature”, ACM Data Base, 35 (4) 6-102. Domberger, S. (1998) The Contracting Organization: A Strategic Guide to Outsourcing, Oxford: Oxford University Press Domberger, S., Fernandez, P. and Fiebeg, D. (2000) “Modelling the price, performance and contract characteristics of IT Outsourcing”, Journal of Information Technology, 15 (2) 107-118. Fowler, A. and Jeffs, B. (1998) “Examining information systems outsourcing: a case study from the United Kingdom”, Journal of Information Technology, 13, 111-126. Gregor, S. (2006) The Nature of Theory in Information Systems, MIS Quarterly, 30(3) 611-642 Grover, V., Cheon M.Y. and Teng J. (1996) “The Effect of Service Quality and Partnership on the Outsourcing of Information Systems Functions”, Journal of Management Information Systems, 12 (4) Spring 89-116. Hirschheim, R.A. and Lacity, M.C. (1998) “Reducing Information Systems Costs through Insourcing: Experiences from the Field”, Proceedings of the 31st International Conference on System Sciences, Hawaii, 644-653. Hirschheim, R.A and Lacity, M.C., (2000) “The Myths and Realities of Information Technology Outsourcing”, Communications of the ACM, 43 (2) 99-107. 35
  • 36. Hui, P.P. and Beath, C.M. (2002) “The IT Sourcing Process: A Framework for Research”. Working Paper, Austin: University of Texas at Austin. Hurley, M. and Costa, C. (2001) The Blurring Boundary of the Organisation: Outsourcing Comes of Age, Sydney: KPMG Consulting. Kern, T. and Willcocks, L.P. (2002) “Exploring Relationship in Information Technology Outsourcing: The Interaction Approach”, European Journal of Information Systems, 11(1) 3-19. Kern, T., Willcocks, L., and Heck, E. (2002) “The Winner’s Curse in IT Outsourcing: Strategies for Avoiding Relational Trauma”, California Management Review, 44(2) 47-69. King, W.R and Malhotra, Y. (2000) “Developing a Framework for Analyzing IS Outsourcing”, Information & Management, 37 323-334. Klepper, R. and Jones, W. O. (1998) Outsourcing Information Technology Systems & Services, NJ: Prentice Hall. Lacity, M.C. and Hirschheim, R.A. (1993) Information Systems Outsourcing: Myths, Metaphors, and Realities, Chichester: Wiley. Lacity M.C. and Willcocks, L.P. (1998) An empirical investigation of information technology sourcing practices: Lessons from Experience, MIS Quarterly 22(3) 363-408. Lacity, M.C. and Willcocks, L.P. (2002a) Inside Information Technology Outsourcing: A State of the Art Report, Templeton College, Oxford: Templeton Research. Lacity, M.C. and Willcocks, L.P. (2000b) “Relationships in IT Outsourcing: A Stakeholder Perspective”, in Zmud, R. (ed.) Framing the Domains of IT Management Research: Glimpsing The Future through The Past, California: Pinnaflex. Lacity, M.C. and Willcocks, L.P. (2001) Global Information Technology Outsourcing: Search for Business Advantage, Chichester: Wiley. Lacity, M.C., Willcocks, L.P. and Feeny, D.(1996) “The Value of Selective Sourcing”, Sloan Management Review, Spring 13-25 Lee, J.-N., and Kim, Y.-G. (1999) “Effect of Partnership Quality on IS Outsourcing Success: Conceptual Framework and Empirical Validation”, Journal of MIS, 15(4) 29-61. Lee, J-N, Miranda, S.M. and Kim, Y-M. (2004) “IT Outsourcing Strategies: Universalistic, Contingency, and Configurational Explanations of Success”, Information Systems Research, 15(2) 110–131. McAulay, M., Doherty, N. and Keval, N. (2002) “The stakeholder dimension in information systems evaluation”, Journal of Information Technology. 17 241-255. 36
  • 37. McFarlan, F.W and Nolan, R. (1995) “How to Manage an IT Outsourcing Alliance”, Sloan Management Review, Winter 9-23. Mylott, T.R. (1995) Computer Outsourcing: Managing the Transfer of Information Systems, NJ: Prentice Hall. Palmquist, M. et al. (2004). “Introduction to Generalizability and Transferability”. Website: http://writing.colostate.edu/guides/research/gentrans/pop2a.cfm (viewed June 2007) Quinn, J.B., Doorley, T. and Paquette, P. (1990) “Beyond Products: Services-Based Strategy”, Harvard Business Review, March-April 58-67. Quinn, J.B. and Hilmer, F.G. (1994) “Strategic Outsourcing”, Sloan Management Review, 35(4) 43-55. Rouse, A., Corbitt B. and Aubert, B. (2001) “Perspectives on IT Outsourcing Success: Covariance Structure Modelling of a Survey of Outsourcing in Australia”, Working Paper, Montreal: Ècole des Hautes Ètudes Commericales de Montrèal, March. Saunders, C., Gebelt, M. and Hu, Q. (1997) “Achieving Success in Information Systems Outsourcing”, Californian Management Review. 39(2) 63–79. Seddon, P.B. and Scheepers, R. (2006) Other-settings Generalization in IS Research, Proceedings of the 27th International Conference on Information Systems, pp. 1141-1158. 37