SlideShare uma empresa Scribd logo
1 de 17
CET – TÉCNICAS DE GERONTOLOGIA


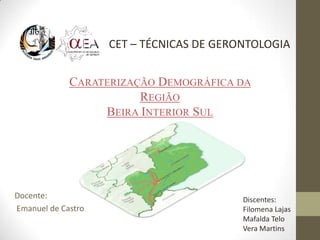
             CARATERIZAÇÃO DEMOGRÁFICA DA
                        REGIÃO
                  BEIRA INTERIOR SUL


Docente:                                  Discentes:
Emanuel de Castro                         Filomena Lajas
                                          Mafalda Telo
                                          Vera Martins
OBJETIVOS

       Análise
                                    Dinâmica
                                   Dinâmica populacional
     estática da
                                   populacional
     população


                   Caraterização
                   demográfica
                     da região
NUT III - Beira Interior Sul.
      Aspectos geográficos


       N
Dinâmicas demográficas actuais: análises comparativas

                 População residente                        Variação populacional


    Unidade      Anos     Anos         Anos      Anos       1981_199   1991_200
                                                                                    2010
    Geográfic    1981     1991         2001      2010       1          1
    a
    Portugal                           1032934
                          9965315                10636970   9276       72682        -734
                                       0
    Beira
    Interior     86138    81015        78123     71644      -5123      -2892        -827
    Sul
    Castelo
                 54908    54310        55708     53270      -598       1398         -356
    Branco
    Idanha-a-
                 16101    13630        11659     9703       -2471      -1971        -249
    Velha
    Penamac
                 9524     8118         6658      5376       -1406      -1460        -146
    or
    Vila Velha
                 5605     4960         4098      3295       -645       -862         -78
    de Ródão
Evolução taxas de natalidade, mortalidade e mortalidade infantil
     %
40


35


30


25


20


15


10


 5


 0
         2001   2005     2010   2001   2005    2010   2001   2005   2010   2001   2005   2010   2001   2005   2010   2001   2005   2010

                Centro           Beira Interior Sul     Castelo Branco       Idanha-a-Nova         Penamacor         Vila Velha de Ródão
Taxa bruta    Taxa bruta
                                                                                      de            de
                                                                                  natalidade    mortalidad
                                                                                    (‰) por      e (‰) por
                                                                                   Local de      Local de
                                                                                  residência;   residência;
                                                                                     Anual         Anual
                                                                          2001           8,2           16
                                        Beira Interior Sul                2005           7,8          17,7
                                                                          2010           7,4          16,8
20
18
16                                                                                 Taxa mortalidade
14                                                                                 muito superior
12                                                                                 à taxa de natalidade
10                                               Taxa bruta de natalidade (‰)
8                                                por Local de residência; Anual
                                                 Taxa bruta de mortalidade (‰)
6
                                                 por Local de residência; Anual     valores do
4
                                                                                   crescimento natural
2
                                                                                   negativos
0
     2001         2005           2010

            Beira Interior Sul

                                                                                   estamos perante a
                                                                                   5ª fase da TTD
Taxa de crescimento
                                                            Taxa de crescimento
                                         efectivo (%) por
                                                            natural (%) por Local
                        Período de     Local de residência;
                                                            de residência; Anual
Local de residência   referência dos          Anual
                          dados
                                                %                     %


                          2010                -0,22                 -0,34
      Centro              2005                 0,26                 -0,25
                          2001                 0,62                  -0,2
                          2010                -1,15                 -0,95
 Beira Interior Sul       2005                 -0,8                 -0,99
                          2001                -0,29                 -0,78
                          2010                -0,67                 -0,47
  Castelo Branco          2005                -0,37                 -0,55
                          2001                 0,31                 -0,33
                          2010                -2,53                 -2,33
  Idanha-a-Nova           2005                -1,89                 -2,05
                          2001                -1,62                 -1,84
                          2010                -2,68                  -2,2
    Penamacor             2005                -1,82                 -1,74
                          2001                -1,95                  -1,8
                          2010                -2,28                 -2,58
Vila Velha de Ródão       2005                 -2,4                 -3,03
                          2001                -2,04                 -2,19
Problemática de envelhecimento e os impactos
                 produzidos
                                                                                    Taxa de
                                                                     Índice de
                                                   Índice de                       crescimen         Saldo
                                                                    longevida
                                                 envelhecimen                           to        migratório
                                                                      de (N.º)
                                  Período de      to (N.º) por                     migratório      (N.º) por
                                                                     por Local
          Local de residência   referência dos     Local de                          (%) por       Local de
                                                                         de
                                    dados         residência;                       Local de      residência
                                                                    residência
                                                     Anual                         residência       ; Anual
                                                                      ; Anual
                                                                                     ; Anual
                                                      N.º               %              %             N.º
                                2010                    152,90           50,10             0,12        2889
   Centro                       2005                        140,1           45,9           0,51        7027
                                2001                        132,3           43,9           0,82       19131
                                2010                    233,30           57,50          -0,20           -143
   Beira Interior Sul           2005                        236,8           51,6           0,18            102
                                2001                        233,6            48            0,49            378
                                2010                    179,30           53,20          -0,20           -107
   Castelo Branco               2005                        174,2           48,8           0,18             76
                                2001                        172,3           45,6           0,65            356
                                2010                    448,30           65,80          -0,20              -20
   Idanha-a-Nova                2005                        492,3           57,6           0,16             13
                                2001                        470,1           51,9           0,23             26
                                2010                    538,70           65,20          -0,48              -26
   Penamacor                    2005                        504,8           54,1        -0,08               -7
                                2001                        435,4           50,3        -0,15              -10
                                2010                    511,50           61,50             0,30             10
   Vila Velha de Ródão          2005                        551,7           53,3           0,64             20
                                2001                        519,5           51,4           0,15              6
Características territoriais das dinâmicas demográficas
     observadas na Região da Beira Interior Sul :
                       Análise da Projetiva


 O ritmo de crescimento tem a      Projeção da população:
 seguinte expressão:

       r = (Pn/P0) 1/n -1
                                      Pn= P0 (1+r)n
 Em que:

 r = ritmo de crescimento,         Em que:
 Pn- população absoluta no
                                   Pn- população projectada
 tempo 1
                                   P0 – população de partida
 P0 - é população no ano de        r – ritmo de crescimento
 partida (tempo 0)                 n – número de anos
 n- diferença temporal entre       projectado
 PN e P0.
Resultados:


                        Ritmo de Crescimento
       Concelhos            < 14 anos    15 a 64 anos   > 65 anos
     Castelo Branco            0,12          0,12          0,12
   Idanha - a - Nova           0,11          0,11          0,10
       Penamacor               0,08          0,11          0,10
  Vila Velha de Ródão          0,09          0,11          0,09
Projeção
                                     2011
                      < 14 anos   15 a 64 anos   > 65 anos
  Castelo Branco       7711,41     38095,85      13891,64
 Idanha - a - Nova      960,59      5488,39       4287,13
    Penamacor           434,39      3117,91       2382,43

Vila Velha de Ródão    248,26       2123,16       1268,32


                        2020
                                   15 a 64
                      < 14 anos     anos    > 65 anos
 Castelo Branco       21111,93    105786,99 39579,66
Idanha - a - Nova      2416,54    13924,90 10354,57
   Penamacor           892,25      7822,32   5755,85
  Vila Velha de
      Ródão            555,64      5580,43       2810,56
http://www.ine.pt/xportal/xmain?xpid=INE&xpgid=i
ne_p_etarias&menuBOUI=13707095&contexto=p
e&selTab=tab4
Conclusão:
Os condicionalismos naturais e a inexistência de uma
política de desenvolvimento específico, levam a um
desequilíbrio na estrutura social e produtiva dos
concelhos que integra a Beira Interior Sul, conduzindo
à sua dinâmica demográfica.
Em termos genéricos esta área apresenta uma
dependência funcional centrada no concelho de
Castelo Branco, tendo em conta que os outros
concelhos (Idanha- a- Nova; Penamacor e Vila Velha
de Ródão) dependem da sua subsistência, o turismo.
Esta dependência contribuiu para o enfraquecimento
da população jovem e ativa residente e um aumento
do envelhecimento.
Também se verifica que a beira interior sul está
desertificada por falta de incentivos empreendedores.

Mais conteúdo relacionado

Destaque

Everything You Need To Know About ChatGPT
Everything You Need To Know About ChatGPTEverything You Need To Know About ChatGPT
Everything You Need To Know About ChatGPTExpeed Software
 
Product Design Trends in 2024 | Teenage Engineerings
Product Design Trends in 2024 | Teenage EngineeringsProduct Design Trends in 2024 | Teenage Engineerings
Product Design Trends in 2024 | Teenage EngineeringsPixeldarts
 
How Race, Age and Gender Shape Attitudes Towards Mental Health
How Race, Age and Gender Shape Attitudes Towards Mental HealthHow Race, Age and Gender Shape Attitudes Towards Mental Health
How Race, Age and Gender Shape Attitudes Towards Mental HealthThinkNow
 
AI Trends in Creative Operations 2024 by Artwork Flow.pdf
AI Trends in Creative Operations 2024 by Artwork Flow.pdfAI Trends in Creative Operations 2024 by Artwork Flow.pdf
AI Trends in Creative Operations 2024 by Artwork Flow.pdfmarketingartwork
 
PEPSICO Presentation to CAGNY Conference Feb 2024
PEPSICO Presentation to CAGNY Conference Feb 2024PEPSICO Presentation to CAGNY Conference Feb 2024
PEPSICO Presentation to CAGNY Conference Feb 2024Neil Kimberley
 
Content Methodology: A Best Practices Report (Webinar)
Content Methodology: A Best Practices Report (Webinar)Content Methodology: A Best Practices Report (Webinar)
Content Methodology: A Best Practices Report (Webinar)contently
 
How to Prepare For a Successful Job Search for 2024
How to Prepare For a Successful Job Search for 2024How to Prepare For a Successful Job Search for 2024
How to Prepare For a Successful Job Search for 2024Albert Qian
 
Social Media Marketing Trends 2024 // The Global Indie Insights
Social Media Marketing Trends 2024 // The Global Indie InsightsSocial Media Marketing Trends 2024 // The Global Indie Insights
Social Media Marketing Trends 2024 // The Global Indie InsightsKurio // The Social Media Age(ncy)
 
Trends In Paid Search: Navigating The Digital Landscape In 2024
Trends In Paid Search: Navigating The Digital Landscape In 2024Trends In Paid Search: Navigating The Digital Landscape In 2024
Trends In Paid Search: Navigating The Digital Landscape In 2024Search Engine Journal
 
5 Public speaking tips from TED - Visualized summary
5 Public speaking tips from TED - Visualized summary5 Public speaking tips from TED - Visualized summary
5 Public speaking tips from TED - Visualized summarySpeakerHub
 
ChatGPT and the Future of Work - Clark Boyd
ChatGPT and the Future of Work - Clark Boyd ChatGPT and the Future of Work - Clark Boyd
ChatGPT and the Future of Work - Clark Boyd Clark Boyd
 
Getting into the tech field. what next
Getting into the tech field. what next Getting into the tech field. what next
Getting into the tech field. what next Tessa Mero
 
Google's Just Not That Into You: Understanding Core Updates & Search Intent
Google's Just Not That Into You: Understanding Core Updates & Search IntentGoogle's Just Not That Into You: Understanding Core Updates & Search Intent
Google's Just Not That Into You: Understanding Core Updates & Search IntentLily Ray
 
Time Management & Productivity - Best Practices
Time Management & Productivity -  Best PracticesTime Management & Productivity -  Best Practices
Time Management & Productivity - Best PracticesVit Horky
 
The six step guide to practical project management
The six step guide to practical project managementThe six step guide to practical project management
The six step guide to practical project managementMindGenius
 
Beginners Guide to TikTok for Search - Rachel Pearson - We are Tilt __ Bright...
Beginners Guide to TikTok for Search - Rachel Pearson - We are Tilt __ Bright...Beginners Guide to TikTok for Search - Rachel Pearson - We are Tilt __ Bright...
Beginners Guide to TikTok for Search - Rachel Pearson - We are Tilt __ Bright...RachelPearson36
 
Unlocking the Power of ChatGPT and AI in Testing - A Real-World Look, present...
Unlocking the Power of ChatGPT and AI in Testing - A Real-World Look, present...Unlocking the Power of ChatGPT and AI in Testing - A Real-World Look, present...
Unlocking the Power of ChatGPT and AI in Testing - A Real-World Look, present...Applitools
 

Destaque (20)

Everything You Need To Know About ChatGPT
Everything You Need To Know About ChatGPTEverything You Need To Know About ChatGPT
Everything You Need To Know About ChatGPT
 
Product Design Trends in 2024 | Teenage Engineerings
Product Design Trends in 2024 | Teenage EngineeringsProduct Design Trends in 2024 | Teenage Engineerings
Product Design Trends in 2024 | Teenage Engineerings
 
How Race, Age and Gender Shape Attitudes Towards Mental Health
How Race, Age and Gender Shape Attitudes Towards Mental HealthHow Race, Age and Gender Shape Attitudes Towards Mental Health
How Race, Age and Gender Shape Attitudes Towards Mental Health
 
AI Trends in Creative Operations 2024 by Artwork Flow.pdf
AI Trends in Creative Operations 2024 by Artwork Flow.pdfAI Trends in Creative Operations 2024 by Artwork Flow.pdf
AI Trends in Creative Operations 2024 by Artwork Flow.pdf
 
Skeleton Culture Code
Skeleton Culture CodeSkeleton Culture Code
Skeleton Culture Code
 
PEPSICO Presentation to CAGNY Conference Feb 2024
PEPSICO Presentation to CAGNY Conference Feb 2024PEPSICO Presentation to CAGNY Conference Feb 2024
PEPSICO Presentation to CAGNY Conference Feb 2024
 
Content Methodology: A Best Practices Report (Webinar)
Content Methodology: A Best Practices Report (Webinar)Content Methodology: A Best Practices Report (Webinar)
Content Methodology: A Best Practices Report (Webinar)
 
How to Prepare For a Successful Job Search for 2024
How to Prepare For a Successful Job Search for 2024How to Prepare For a Successful Job Search for 2024
How to Prepare For a Successful Job Search for 2024
 
Social Media Marketing Trends 2024 // The Global Indie Insights
Social Media Marketing Trends 2024 // The Global Indie InsightsSocial Media Marketing Trends 2024 // The Global Indie Insights
Social Media Marketing Trends 2024 // The Global Indie Insights
 
Trends In Paid Search: Navigating The Digital Landscape In 2024
Trends In Paid Search: Navigating The Digital Landscape In 2024Trends In Paid Search: Navigating The Digital Landscape In 2024
Trends In Paid Search: Navigating The Digital Landscape In 2024
 
5 Public speaking tips from TED - Visualized summary
5 Public speaking tips from TED - Visualized summary5 Public speaking tips from TED - Visualized summary
5 Public speaking tips from TED - Visualized summary
 
ChatGPT and the Future of Work - Clark Boyd
ChatGPT and the Future of Work - Clark Boyd ChatGPT and the Future of Work - Clark Boyd
ChatGPT and the Future of Work - Clark Boyd
 
Getting into the tech field. what next
Getting into the tech field. what next Getting into the tech field. what next
Getting into the tech field. what next
 
Google's Just Not That Into You: Understanding Core Updates & Search Intent
Google's Just Not That Into You: Understanding Core Updates & Search IntentGoogle's Just Not That Into You: Understanding Core Updates & Search Intent
Google's Just Not That Into You: Understanding Core Updates & Search Intent
 
How to have difficult conversations
How to have difficult conversations How to have difficult conversations
How to have difficult conversations
 
Introduction to Data Science
Introduction to Data ScienceIntroduction to Data Science
Introduction to Data Science
 
Time Management & Productivity - Best Practices
Time Management & Productivity -  Best PracticesTime Management & Productivity -  Best Practices
Time Management & Productivity - Best Practices
 
The six step guide to practical project management
The six step guide to practical project managementThe six step guide to practical project management
The six step guide to practical project management
 
Beginners Guide to TikTok for Search - Rachel Pearson - We are Tilt __ Bright...
Beginners Guide to TikTok for Search - Rachel Pearson - We are Tilt __ Bright...Beginners Guide to TikTok for Search - Rachel Pearson - We are Tilt __ Bright...
Beginners Guide to TikTok for Search - Rachel Pearson - We are Tilt __ Bright...
 
Unlocking the Power of ChatGPT and AI in Testing - A Real-World Look, present...
Unlocking the Power of ChatGPT and AI in Testing - A Real-World Look, present...Unlocking the Power of ChatGPT and AI in Testing - A Real-World Look, present...
Unlocking the Power of ChatGPT and AI in Testing - A Real-World Look, present...
 

Análise demográfica da região Beira Interior Sul

  • 1. CET – TÉCNICAS DE GERONTOLOGIA CARATERIZAÇÃO DEMOGRÁFICA DA REGIÃO BEIRA INTERIOR SUL Docente: Discentes: Emanuel de Castro Filomena Lajas Mafalda Telo Vera Martins
  • 2. OBJETIVOS Análise Dinâmica Dinâmica populacional estática da populacional população Caraterização demográfica da região
  • 3. NUT III - Beira Interior Sul. Aspectos geográficos N
  • 4. Dinâmicas demográficas actuais: análises comparativas População residente Variação populacional Unidade Anos Anos Anos Anos 1981_199 1991_200 2010 Geográfic 1981 1991 2001 2010 1 1 a Portugal 1032934 9965315 10636970 9276 72682 -734 0 Beira Interior 86138 81015 78123 71644 -5123 -2892 -827 Sul Castelo 54908 54310 55708 53270 -598 1398 -356 Branco Idanha-a- 16101 13630 11659 9703 -2471 -1971 -249 Velha Penamac 9524 8118 6658 5376 -1406 -1460 -146 or Vila Velha 5605 4960 4098 3295 -645 -862 -78 de Ródão
  • 5. Evolução taxas de natalidade, mortalidade e mortalidade infantil % 40 35 30 25 20 15 10 5 0 2001 2005 2010 2001 2005 2010 2001 2005 2010 2001 2005 2010 2001 2005 2010 2001 2005 2010 Centro Beira Interior Sul Castelo Branco Idanha-a-Nova Penamacor Vila Velha de Ródão
  • 6. Taxa bruta Taxa bruta de de natalidade mortalidad (‰) por e (‰) por Local de Local de residência; residência; Anual Anual 2001 8,2 16 Beira Interior Sul 2005 7,8 17,7 2010 7,4 16,8 20 18 16 Taxa mortalidade 14 muito superior 12 à taxa de natalidade 10 Taxa bruta de natalidade (‰) 8 por Local de residência; Anual Taxa bruta de mortalidade (‰) 6 por Local de residência; Anual valores do 4 crescimento natural 2 negativos 0 2001 2005 2010 Beira Interior Sul estamos perante a 5ª fase da TTD
  • 7. Taxa de crescimento Taxa de crescimento efectivo (%) por natural (%) por Local Período de Local de residência; de residência; Anual Local de residência referência dos Anual dados % % 2010 -0,22 -0,34 Centro 2005 0,26 -0,25 2001 0,62 -0,2 2010 -1,15 -0,95 Beira Interior Sul 2005 -0,8 -0,99 2001 -0,29 -0,78 2010 -0,67 -0,47 Castelo Branco 2005 -0,37 -0,55 2001 0,31 -0,33 2010 -2,53 -2,33 Idanha-a-Nova 2005 -1,89 -2,05 2001 -1,62 -1,84 2010 -2,68 -2,2 Penamacor 2005 -1,82 -1,74 2001 -1,95 -1,8 2010 -2,28 -2,58 Vila Velha de Ródão 2005 -2,4 -3,03 2001 -2,04 -2,19
  • 8.
  • 9. Problemática de envelhecimento e os impactos produzidos Taxa de Índice de Índice de crescimen Saldo longevida envelhecimen to migratório de (N.º) Período de to (N.º) por migratório (N.º) por por Local Local de residência referência dos Local de (%) por Local de de dados residência; Local de residência residência Anual residência ; Anual ; Anual ; Anual N.º % % N.º 2010 152,90 50,10 0,12 2889 Centro 2005 140,1 45,9 0,51 7027 2001 132,3 43,9 0,82 19131 2010 233,30 57,50 -0,20 -143 Beira Interior Sul 2005 236,8 51,6 0,18 102 2001 233,6 48 0,49 378 2010 179,30 53,20 -0,20 -107 Castelo Branco 2005 174,2 48,8 0,18 76 2001 172,3 45,6 0,65 356 2010 448,30 65,80 -0,20 -20 Idanha-a-Nova 2005 492,3 57,6 0,16 13 2001 470,1 51,9 0,23 26 2010 538,70 65,20 -0,48 -26 Penamacor 2005 504,8 54,1 -0,08 -7 2001 435,4 50,3 -0,15 -10 2010 511,50 61,50 0,30 10 Vila Velha de Ródão 2005 551,7 53,3 0,64 20 2001 519,5 51,4 0,15 6
  • 10.
  • 11. Características territoriais das dinâmicas demográficas observadas na Região da Beira Interior Sul : Análise da Projetiva O ritmo de crescimento tem a Projeção da população: seguinte expressão: r = (Pn/P0) 1/n -1 Pn= P0 (1+r)n Em que: r = ritmo de crescimento, Em que: Pn- população absoluta no Pn- população projectada tempo 1 P0 – população de partida P0 - é população no ano de r – ritmo de crescimento partida (tempo 0) n – número de anos n- diferença temporal entre projectado PN e P0.
  • 12. Resultados: Ritmo de Crescimento Concelhos < 14 anos 15 a 64 anos > 65 anos Castelo Branco 0,12 0,12 0,12 Idanha - a - Nova 0,11 0,11 0,10 Penamacor 0,08 0,11 0,10 Vila Velha de Ródão 0,09 0,11 0,09
  • 13. Projeção 2011 < 14 anos 15 a 64 anos > 65 anos Castelo Branco 7711,41 38095,85 13891,64 Idanha - a - Nova 960,59 5488,39 4287,13 Penamacor 434,39 3117,91 2382,43 Vila Velha de Ródão 248,26 2123,16 1268,32 2020 15 a 64 < 14 anos anos > 65 anos Castelo Branco 21111,93 105786,99 39579,66 Idanha - a - Nova 2416,54 13924,90 10354,57 Penamacor 892,25 7822,32 5755,85 Vila Velha de Ródão 555,64 5580,43 2810,56
  • 14.
  • 15.
  • 17. Conclusão: Os condicionalismos naturais e a inexistência de uma política de desenvolvimento específico, levam a um desequilíbrio na estrutura social e produtiva dos concelhos que integra a Beira Interior Sul, conduzindo à sua dinâmica demográfica. Em termos genéricos esta área apresenta uma dependência funcional centrada no concelho de Castelo Branco, tendo em conta que os outros concelhos (Idanha- a- Nova; Penamacor e Vila Velha de Ródão) dependem da sua subsistência, o turismo. Esta dependência contribuiu para o enfraquecimento da população jovem e ativa residente e um aumento do envelhecimento. Também se verifica que a beira interior sul está desertificada por falta de incentivos empreendedores.