

Recomendados
Recomendados
Mais conteúdo relacionado
Mais procurados
Mais procurados (18)
Semelhante a Ee395 lab 2 - loren - victor - taylor
Semelhante a Ee395 lab 2 - loren - victor - taylor (20)
Mais de Loren Schwappach
Mais de Loren Schwappach (20)
Último
Último (20)
Ee395 lab 2 - loren - victor - taylor
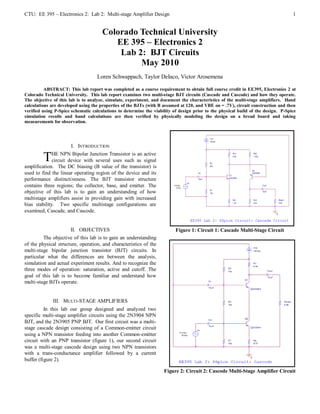
- 1. CTU: EE 395 – Electronics 2: Lab 2: Multi-stage Amplifier Design 1 Colorado Technical University EE 395 – Electronics 2 Lab 2: BJT Circuits May 2010 Loren Schwappach, Taylor DeIaco, Victor Arosemena ABSTRACT: This lab report was completed as a course requirement to obtain full course credit in EE395, Electronics 2 at Colorado Technical University. This lab report examines two multi-stage BJT circuits (Cascade and Cascode) and how they operate. The objective of this lab is to analyze, simulate, experiment, and document the characteristics of the multi-stage amplifiers. Hand calculations are developed using the properties of the BJTs (with B assumed at 120, and VBE on = .7V), circuit construction and then verified using P-Spice schematic calculations to determine the viability of design prior to the physical build of the design. P-Spice simulation results and hand calculations are then verified by physically modeling the design on a bread board and taking measurements for observation. I. INTRODUCTION T HE NPN Bipolar Junction Transistor is an active circuit device with several uses such as signal amplification. The DC biasing (B value of the transistor) is used to find the linear operating region of the device and its performance distinctiveness. The BJT transistor structure contains three regions; the collector, base, and emitter. The objective of this lab is to gain an understanding of how multistage amplifiers assist in providing gain with increased bias stability. Two specific multistage configurations are examined, Cascade, and Cascode. II. OBJECTIVES Figure 1: Circuit 1: Cascade Multi-Stage Circuit The objective of this lab is to gain an understanding of the physical structure, operation, and characteristics of the multi-stage bipolar junction transistor (BJT) circuits. In particular what the differences are between the analysis, simulation and actual experiment results. And to recognize the three modes of operation: saturation, active and cutoff. The goal of this lab is to become familiar and understand how multi-stage BJTs operate. III. MULTI-STAGE AMPLIFIERS In this lab our group designed and analyzed two specific multi-stage amplifier circuits using the 2N3904 NPN BJT, and the 2N3905 PNP BJT. Our first circuit was a multi- stage cascade design consisting of a Common-emitter circuit using a NPN transistor feeding into another Common-emitter circuit with an PNP transistor (figure 1), our second circuit was a multi-stage cascode design using two NPN transistors with a trans-conductance amplifier followed by a current buffer (figure 2). Figure 2: Circuit 2: Cascode Multi-Stage Amplifier Circuit
- 2. CTU: EE 395 – Electronics 2: Lab 2: Multi-stage Amplifier Design 2 IV. DESIGN APPROACHES/TRADE-OFFS The performance of this lab will depend on how well the circuits are developed. If the circuit is developed correctly the results showed should be similar to the hand calculation and PSpice simulation results. PSpice will be used to provide a rough estimate of what should be expected in the circuit measurements; however, the PSpice model transistor B tends to vary by the model, so the PSpice simulations could have a much larger error margin than the expected. The performance of the lab also depends on how well the equipment is calibrated and accurate the components tolerance is. This is not a very cost effective lab except for the development and time it took to construct the lab components. But to save money for a lab project, whether it’s the testing or developing phase of a new design, depending on what the schematic is, a circuit can be reduced, if done correctly. V. HAND CALCULATIONS The scanned hand calculations used for this lab can be found below. Figure 4: Circuit 2, Cascode Amplifier Hand Calculations. VI. CIRCUIT SCHEMATICS The final circuit schematics below were built in PSpice and allowed our team to analyze the circuit digitally before performing the physical build. However, since the B value of the transistor used is rarely the exact B of the transistor there is a margin of percentage error attributed. Figure 3: Circuit 1, Cascade Amplifier hand calculations. Figure 5: Circuit 1: Cascade Amplifier Voltages
- 3. CTU: EE 395 – Electronics 2: Lab 2: Multi-stage Amplifier Design 3 Figure 6: Circuit 1: Cascade Amplifier Currents Figure 9: Circuit 2: Cascode Amplifier Currents Figure 7: Circuit 1: Cascade Amplifier Power Figure 10: Circuit 2: Cascode Amplifier Power In this lab we were also asked to find the frequency response and gain of the cascade and cascode multi-stage amplifier circuits. The PSpice results for both circuit designs follows.. Figure 8: Circuit 2: Cascode Amplifier Voltages
- 4. CTU: EE 395 – Electronics 2: Lab 2: Multi-stage Amplifier Design 4 Figure 11: Circuit 1: Cascade Amplifier Bode Plot. Note lower (high pass) corner frequency is 2.4 Hz, higher (low pass) corner frequency is 1.25 MHz. Center frequency is 1.59 kHz which is what was used in this lab. Figure 13: Circuit 1: Cascade Amplifier Bode Plot. Note Stage 1 gain is 5.16, Stage 2 is 1.82, total gain is 9.4. Figure 12: Circuit 2: Cascode Amplifier Bode Plot. Note lower (high pass) corner frequency is 4 Hz, higher (low pass) corner frequency is 25 MHz. Center frequency is 12.6 kHz which is what was used in this lab. Figure 14: Circuit 2: Cascode Amplifier Bode Plot. Note gain is 5.42.
- 5. CTU: EE 395 – Electronics 2: Lab 2: Multi-stage Amplifier Design 5 VII. COMPONENT LIST Hand The following is a list of components that were used in Calculated Pspice Actual constructing the BJT switch / inverter. Component values Results Results Results were selected by the professor. Vcc 10 V 10 V 10.02 V Vb1 2.17 V 2.063 V 2.086 V A digital multimeter for measuring circuit voltages, resistor resistances, and capacitor Vb2 1.09 V 1.007 V 1.023 V capacitance. Ve2 390 mV 354.1 mV 363 mV A power supply capable of delivering a constant Vc2 1.47 V 1.411 V 1.426 V Vcc = 10V. Vce2 1.08 V 1.057 V 1.063 V Two 2N3904 NPN Transistor Vc1 5.47 V 5.877 V 5.898 V One 2N3905 PNP Transistor Applicable resisters for both multi-stage designs of Vce1 4V 4.466 V 4.472 V values approx 82k, 10k*2, 6.8k*3, 1.82k, 1.2k, Ib1 6 uA 4.669 uA 4.6 uA 72k, 575. Ic1 666 uA 621.9 uA 621.9 uA Bread board with wires. Ie1 672 uA 626.5 uA 626.5 uA NOTE: Resistors can normally provide around +/- 5%-25% difference between actual and designed Ib2 4 uA 4.8 uA 4.8 uA values while Capacitors generally provide around Ic2 672 uA 626.5 uA 626.5 uA 20%-50% difference between actual and designed Ie2 678 uA 631.3 uA 631.3 uA values. You can add resisters in series as (R1+R2) to closer approximate required resistance values Table 2: Circuit 2: Cascode Circuit: Comparison of Hand and you can add Capacitors in parallel as (C1+C2) Calculated, PSpice, and Measured Values. Notice all to closely approximate required capacitance. values are very close. This lab also asked for an analysis of the actual gain vs. VIII. EXPERIMENTAL DATA PSpice predicted. Results follow.. The following table illustrates the measurements taken at each stage of the lab. Pspice Actual Results Results Hand At Q1c 5.1647 4.88 Calculated Pspice Actual Cascade At Q2c 1.8195 1.85 Results Results Results Total Gain 9.397 9 Vcc 10 V 10 V 10.02 V At Q1c 5.41955 5 Vb1 1.087 V 1.062 V 1.058 V Cascode Total Gain 5.41955 5 Ve1 387 mV 425.4 mV 418 mV Vce1 7.437 V 7.2156 V 7.22 V IX. ANALYSIS/DATA COMPARISON Vc1 7.824 V 7.641 V 7.638 V Vce2 3.064 V 2.18 V 2.185 V The analysis/PSpice/Experimental data results were Ve2 8.524 V 8.342 V 8.35 V all accurate, but the results differed between the three. The reasons that the results were different is because the Vc2 5.46 V 6.162 V 6.165 V experimental results have equipment calibrations, component Ib1 3 uA 2.838 uA 2.6 uA tolerances, and actual measures values from the components. Ic1 320 uA 351.7 uA 347 uA The PSpice were less accurate than hand calculation because the PSpice B. All three results were not in total agreement Ie1 323 uA 354.5 uA 350 uA however, the results were close to each other. Ib2 7 uA -4.697 uA -6 uA Ic2 803 uA 906.2 uA 901 uA X. CONCLUSIONS Ie2 810 uA 910.9 uA 907 uA The discrepancies between the actual results, hand Table 1: Circuit 1: Cascade Circuit: Comparison of Hand calculated and simulated result is that they were all extremely Calculated, PSpice, and Measured Values. Notice all close (<20%) from the P-Spice results, however these results values are very close. could differ depending upon the error provided by the passive and active components, factors such as component tolerances, equipment calibrations and measurements fluctuations by the observer can contribute to results being slightly off from the
- 6. CTU: EE 395 – Electronics 2: Lab 2: Multi-stage Amplifier Design 6 P-Spice calculations. It is always good to start with P-Spice to understand what is happening prior to build, and even more important to know the characteristics (B value) of the transistor. In conclusion, this lab was a great demonstration on the powerful features of multistage BJTs and their use in electronics. REFERENCES [1] D. A. Neamen, “Microelectronics: circuit analysis and design - 3rd ed.” McGraw-Hill, New York, NY, 2007. pp. 1-107.