
Recomendados
Recomendados
Mais conteúdo relacionado
Destaque
Destaque (20)
Semelhante a Platou monthly 12 2012
Semelhante a Platou monthly 12 2012 (20)
Platou monthly 12 2012
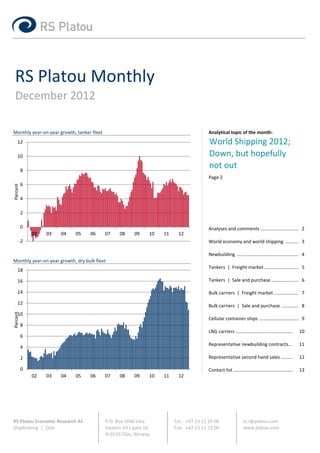
- 1. RS Platou Monthly December 2012 Monthly year‐on‐year growth, tanker fleet Analytical topic of the month: 12 World Shipping 2012; 10 Down, but hopefully 8 not out Page 2 6 Percent 4 2 0 Analyses and comments ………………………….. 2 02 03 04 05 06 07 08 09 10 11 12 ‐2 World economy and world shipping ……….. 3 Newbuilding ……………………………………………. 4 Monthly year‐on‐year growth, dry bulk fleet Tankers | Freight market ……………………….. 5 18 16 Tankers | Sale and purchase ………………….. 6 14 Bulk carriers | Freight market ………………… 7 12 Bulk carriers | Sale and purchase ………….. 8 Percent 10 Cellular container ships …………………………… 9 8 LNG carriers ………………………………………… 10 6 Representative newbuilding contracts… 11 4 2 Representative second hand sales ………. 12 0 Contact list ………………………………………….. 13 02 03 04 05 06 07 08 09 10 11 12 RS Platou Economic Research AS P.O. Box 1604 Vika Tel.: +47 23 11 20 00 ecr@platou.com Shipbroking | Oslo Haakon VII's gate 10 Fax: +47 23 11 23 00 www.platou.com N‐0119 Oslo, Norway
- 2. RS Platou Monthly December 2012 Analyses and comments World Shipping 2012 – Down, but hopefully not out 2012 turned out to be just as difficult for the commodity initial assumption. Volume and distance both expanded, the shipping markets as we feared it would be. The world latter markedly, as OPEC production increased to near an all‐ economy performed even weaker than reflected in time high. While a repeat of this cannot be excluded this year downbeat expectations at the start of the year, while fleet it seems highly unlikely. A broad consensus among oil market growth remained above any reasonably sustainable long‐ forecasters calls for a shrinking market for OPEC oil and that term trend for the fourth consecutive year. Despite another is likely to weigh on ton‐mile growth for both crude and stellar performance from the LNG market and a modest clean tankers. While fleet growth should drop to around 3 tightening of the tanker market, capacity utilization for the percent, less than half the rate seen last year, this will world’s merchant fleet fell by an estimated 0.5 percentage probably not be enough to yield any improvement in average point to 84 percent, the lowest level since the Financial Crisis fleet capacity utilization. Owners looking for positive hit in full in 2009. surprises will closely be watching recent encouraging signs of accelerating oil demand growth from China. Still, the year that went by was not without bright spots despite the very challenging market conditions for many The dry bulk market in 2013; segments. Most obvious, the fact that both tanker and dry Slower fleet growth, but still limited upside bulk freight markets saw periodic rallies through the year is a At the start of this year we stated more downside risk than clear indication that the level of overcapacity is relatively upside potential for the dry bulk market in 2012. The risk of moderate compared to what was seen in the 1970s and ‘80s. lower than predicted world economic growth was the main This is partly due to tonnage demand having enjoyed a concern, and this also turned out to be what happened. surprisingly strong year despite an overall weak world economy, as the increased weight of the commodity Nevertheless, seaborne dry bulk trade increased between 5 intensive non‐OECD economies offset weakness in the OECD. and 6 percent thanks to China which utilized huge arbitrage in iron ore and coal prices and raised its dry bulk imports Another important development was the continued sharp much stronger than the underlying demand for raw materials decline in the fleet orderbook which fell from 20 percent to should indicate. However, ton‐mile growth increased less 12 percent of the total fleet, a decade low, as new orders than volumes because Brazil lost market share in the Asian plunged to a level even below what was seen during the iron ore market. This was in particular negative for the financial crisis. Whatever the reason – more prudent owners, Capesize sector. insufficient cash flow, continued challenging financial conditions – the fact that fleet capacity is responding In 2013, a combination of significantly lower deliveries, rationally to market conditions raises hope that the industry continued arbitrage in iron ore and coal prices and a will avoid a repeat of the protracted structural downturn moderate improvement in the world economy should bound seen in the past. for a more balanced growth in the supply and demand parameters. Fairly small changes in the yearly average The tanker market in 2013; capacity utilization should therefore be expected. Falling Repeat of last year’s demand boom is unlikely fleet growth trend during the course of the year should A year ago we identified an oil restocking scenario as the create some upside potential for freight rates in the second biggest upside “risk” in the tanker market. While we were half after a likely poor first part of the year. correct on this assumption we widely underestimated the actual development as tonnage demand grew by an estimated 8 percent, a near‐record and twice as fast as our RS Platou Economic Research RS Platou Economic Research AS Shipbroking | Oslo 2
- 3. RS Platou Monthly December 2012 World economy and world shipping The United States postponed the financial cliff when lawmakers In the Euro zone, PMI showed that economic decline spread approved a deal to prevent huge tax hikes and spending cuts that further into the core members, suggesting the overall economy would have pushed the economy into recession. Earlier in the may have slipped deeper into recession at the end of 2012. In month, the Fed announced a new round of monetary stimulus, China, the PMI index held steady in December at 50.6, matching taking the unprecedented step to indicate interest rates would November's seven‐month high, as growth in new orders was remain near zero until unemployment falls to at least 6.5 percent. unchanged and the pace of output softened marginally. World economy ‐ YoY change in % Forecasts for world GDP, monthly revisions YoY change in % GDP growth 2011 2012 2013 4.75 US 1.8 2.2 1.9 Euro area 1.5 ‐0.5 ‐0.2 (0.0) 4.50 China 9.3 7.7 (7.8) 8.3 (8.4) 4.25 Japan ‐0.7 1.8 (2.0) 0.7 (0.9) 4.00 India 7.1 5.7 6.5 (6.6) 3.75 World 3.8 3.2 3.4 World trade 5.8 3.2 4.5 3.50 Various sources ( ) previous month, if changed 3.25 3.00 Jan 2011 Jul 2011 Jan 2012 Jul 2012 Jan 2013 World merchant fleet ‐ YoY change in % 2010 2011 2012E 2011 2012 2013 Tonnage demand 11.0 7.7 7.0 Fleet growth 7.0 8.2 7.8 Utilization rate 85.1 84.6 84.1 Seaborne trade YoY change in % 40 Market indicators ‐ YoY change in % 30 Seaborne trade 2Q/2012 3Q/2012 2012‐10m 20 Oil ‐0.3 ‐1.1 ‐0.1 Dry bulk 9.1 0.7 5.9 10 Oil Oct 2012 Nov 2012 2012‐11m 0 Oil consumption World 1.5 1.3 1.2 US 0.9 1.5 ‐1.1 ‐10 China 7.8 4.2 3.7 ‐20 Crude imports US ‐13.2 ‐11.1 ‐8.6 2008 2009 2010 2011 2012 China 13.8 3.0 6.4 Dry bulk Oct 2012 Nov 2012 2012‐11m Dry bulk Oil China imports Total 8.4 ‐4.8 14.2 Iron ore 12.6 2.5 7.9 Steel production China 6.0 13.7 2.9 Newcastle steam coal USD/ton US ‐3.3 ‐4.8 3.2 200 Container Oct 2012 Nov 2012 2012‐11m US imports 4.1 3.2 3.3 175 150 125 Commodity prices Dec 2011 Nov 2012 Dec 2012 100 Brent oil ‐ spot USD/bbl 109.2 111.0 111.6 75 Bunkers ‐ Singapore USD/t 699.0 597.0 606.0 50 Indian iron ore USD/t 141.5 117.5 141.5 25 Steam coal USD/t 109.8 83.3 90.7 Steel ‐ HRC B. Sea USD/t 607.0 535.0 540.0 0 02 03 04 05 06 07 08 09 10 11 12 13 For details on sources and methods, visit www.platou.com/dnn_site/LinkClick.aspx?fileticket=CodSYdx5lSM%3d&tabid=536 RS Platou Economic Research AS Shipbroking | Oslo 3
- 4. RS Platou Monthly December 2012 Newbuilding December was this year’s most active month in terms of vessels, one VLGC, and one car carrier. In the bulk segment, newbuilding activity. Sinokor ordered a total of 20 MR tankers at Thenamaris converted one VLCC contract into two Capesizes at Hyundai Mipo with long‐term charter to Shell attached. BP ordered Shanghai Waigaoqiao, while Chengxi Shipyard secured eight new ten Aframaxes and three Suezmaxes at STX. Nine LNG carriers were contracts with three different owners. added to the orderbook, along with two dual‐fueled container Newbuilding prices in mill USD Building prices for tankers Mill USD Dec 2011 Nov 2012 Dec 2012 175 VLCC 97/98 89 89 150 Tank* Suezmax 60 57 57 Aframax 49/50 46 45/46 125 MR Clean 35 32/33 32 100 Capesize 49/50 45 45 Bulk* 75 Kamsarmax 30/31 26 26 Supramax 27 24 24 50 * Tankers from Korean yards, bulk carriers from Chinese yards 25 0 Order book in no. / mill dwt 02 03 04 05 06 07 08 09 10 11 12 13 Total 2013 2014 2015+ VLCC 64 20.3 47 15.0 16 5.0 1 0.3 VLCC Suezmax Aframax MR Clean Suezmax 85 12.8 54 8.3 10 1.5 21 2.9 Tank * Aframax 39 4.4 27 3.1 12 1.4 0 0.0 Smaller 284 13.4 172 8.0 81 3.9 31 1.5 Building prices for bulk carriers Mill USD Total 472 50.9 300 34.3 119 11.8 53 4.7 100 Capesize 179 38.4 145 31.1 33 7.1 1 0.2 Post Panamax 73 7.0 57 5.5 10 1.0 6 0.5 75 Bulk * Pan./Kamsarmax 386 30.7 299 23.7 76 6.1 11 0.9 Handy/Supramax 340 19.0 272 15.1 59 3.4 9 0.5 Handysize 328 11.1 217 7.2 74 2.5 37 1.3 50 Total 1306 106.2 990 82.7 252 20.1 64 3.4 25 New orders in no. / mill dwt 0 2011 2012 Dec 2012 02 03 04 05 06 07 08 09 10 11 12 13 VLCC 7 2.2 13 4.0 2 0.6 Suezmax 19 2.8 19 2.5 13 1.7 Capesize Kamsarmax/Panamax Supramax Tank * Aframax 11 1.2 7 0.8 0 0.0 Smaller 80 3.4 127 6.0 35 1.8 Total 117 9.6 166 13.4 50 4.1 Exchange rates Left: CNY/USD | Right: KRW/USD Capesize 46 9.8 18 3.3 6 1.1 10 1,600 Post Panamax 16 1.5 4 0.4 0 0.0 Bulk * Pan./Kamsarmax 103 8.1 52 4.1 0 0.0 9 1,400 Handy/Supramax 96 5.3 99 5.6 0 0.0 Handysize 94 3.2 131 4.3 0 0.0 Total 355 28.0 304 17.7 6 1.1 8 1,200 7 * For tonnage definitions, visit www.platou.com/dnn_site/LinkClick.aspx?fileticket=CodSYdx5lSM%3d&tabid=536 1,000 6 800 02 03 04 05 06 07 08 09 10 11 12 13 CNY/USD KRW/USD RS Platou Economic Research AS Shipbroking | Oslo 4
- 5. RS Platou Monthly December 2012 Tankers | Freight market December fixing in the crude tanker market brought more of the The clean markets remained relatively well supported through same as markets have not displayed the normal seasonality. December, continuing on the tailwind of seasonally rising demand Without a fuel oil push going east from Americas, VLCC/Suezmax as well as after effects from the trade disruptions of hurricane rates in the Atlantic basin have remained mostly depressed. AG Sandy. Strong import demand from West Africa, Europe and South markets have lost the same flow as rates hover within a 5 WS point America helped sustain rates at relatively high levels. LR1 and LR2 average for the month. As the 2013 flat rates are filtered in to all rates from the Middle East to Japan came off their highs during the markets in January, watch for an 8‐9 percent decrease in WS rates. month. Average freight rates in 1,000 USD/day Weekly spot rates for crude carriers# 1,000 USD/day 2011 2012 Nov 2012 Dec 2012 35 VLCC 14.9 20.9 21.7 23.3 Suezmax 16.7 14.7 9.4 16.4 30 Aframax 12.9 15.4 18.3 17.1 25 Spot LR2 Clean 12.5 14.3 27.1 24.8 20 LR1 Clean 10.7 16.7 24.6 28.7 15 MR Clean 11.3 13.0 20.2 20.3 VLCC 24.3 19.9 21.0 20.0 10 Suezmax 19.6 16.2 16.0 16.0 5 12m T/C Aframax 14.6 13.3 14.0 13.8 0 LR2 Clean 14.9 13.5 14.0 15.5 2‐Nov 16‐Nov 30‐Nov 14‐Dec 28‐Dec LR1 Clean 14.1 12.2 13.5 13.3 MR Clean 13.5 13.1 13.0 13.0 VLCC Suezmax Aframax # World‐wide averages For weekly freight rates, visit www.platou.com/dnn_site/EconomicResearch/WeeklyFreightRates.aspx Weekly spot rates for clean carriers# 1,000 USD/day 35 Tanker fleet development in mill dwt * Deliveries Removals Fleet end YoY 2012 2012 Dec 2012 in % 30 VLCC 15.1 3.4 187.3 6.7 Suezmax 7.4 3.1 72.2 6.4 25 Aframax 4.7 3.5 98.8 1.2 Smaller 4.9 2.2 98.2 2.9 20 Total tanker fleet 32.1 12.1 456.5 4.6 * For tonnage definitions, visit www.platou.com/dnn_site/LinkClick.aspx?fileticket=CodSYdx5lSM%3d&tabid=536 15 2‐Nov 16‐Nov 30‐Nov 14‐Dec 28‐Dec Oil market in mill bpd MR Clean LR1 LR2 2011‐11m 2012‐11m YoY in % # World‐wide averages Demand OECD 46.4 46.2 ‐0.5 Non‐OECD 42.3 43.6 3.1 Removals of tankers, 10,000+ dwt Mill dwt World demand 88.7 89.8 1.2 25 Middle East 23.0 23.5 2.4 Africa 8.1 8.7 7.8 20 Latin America 10.6 10.6 0.1 North America 12.4 13.6 9.7 Supply 15 Western Europe 3.9 3.5 ‐10.6 Asia 7.7 7.7 0.4 10 FSU 13.6 13.7 0.4 Others 9.2 9.6 5.2 5 World supply 88.4 90.9 2.9 2010 2011E 2012E 0 World seaborne oil trade 44.6 44.6 45.2 02 03 04 05 06 07 08 09 10 11 12 RS Platou Economic Research AS Shipbroking | Oslo 5
- 6. RS Platou Monthly December 2012 Tankers | Sale and purchase December followed the path of November with relatively few by nearly 40 percent. Fewer transactions, lower average size and crude transactions and somewhat higher activity on the higher average age of the ships sold will explain part of the value clean/chemical tanker arena. Most noticeable were the sales of drop, but there is also a strong component of distress situations two 2010‐built Korean LR2s, each in the low $30 millions, versus a behind several of the transactions in the aforementioned statistics. newbuilding contract for similar tonnage estimated at high $40 The general picture is less dramatic with tankers 0‐5 year old millions. While the total transaction volume for tankers dropped having lost less than 15 percent of their fair market value during only marginally from 2011 to 2012, total transaction value dropped 2012. Estimated values in mill USD Second hand values, 5 years old Mill USD Dec 2011 Oct 2012 Nov 2012 Dec 2012 175 310,000 dwt resale 92.0 87.0 85.0 85.0 305,000 dwt 5 years 62.0 60.0 60.0 60.0 150 300,000 dwt 10 years 34.0 38.0 35.0 35.0 125 160,000 dwt resale 58.0 58.0 58.0 56.0 100 160,000 dwt 5 years 45.0 45.0 45.0 44.0 75 150,000 dwt 10 years 30.0 30.0 30.0 29.0 105,000 dwt resale 50.0 45.0 43.0 41.0 50 105,000 dwt 5 years 35.0 30.0 28.0 28.0 25 105,000 dwt 10 years 20.0 18.0 18.0 18.0 0 C 75,000 dwt resale 44.0 38.0 38.0 38.0 02 03 04 05 06 07 08 09 10 11 12 13 C 75,000 dwt 5 years 33.0 28.0 28.0 28.0 C 50,000 dwt resale 35.0 33.0 33.0 33.0 VLCC Suezmax Aframax C 47,000 dwt 5 years 27.0 24.0 24.0 24.0 C 47,000 dwt 10 years 18.0 16.0 15.0 15.0 C 37,000 dwt 5 years 24.0 21.0 21.0 21.0 Second hand values for clean carriers, 40/45,000 dwt Mill USD 60 Baltic Sale & Purchase Assessments in mill USD 50 Average Baltic panel assessments 10 Dec 24 Dec 40 VLCC ‐ 5 years old 305,000 dwt 54.7 53.9 Aframax ‐ 5 years old 105,000 dwt 26.7 26.7 30 MR Prod. ‐ 5 years old 45,000 dwt 21.0 21.1 20 10 Demolition prices in USD/ldt 0 Dec 2011 Oct 2012 Nov 2012 Dec 2012 02 03 04 05 06 07 08 09 10 11 12 13 Far East 445 380 380 390 Sub continent * 480/490 440 420 425 10 years DB 10 years DH 5 years * India/Bangladesh/Pakistan 5 years second hand values in percent of newbuilding prices Sold for scrapping and other removals* in no. / mill dwt 120 2011 2012 Dec 2012 VLCC ‐ double hull 4 1.1 8 2.3 0 0.0 110 Suezmax ‐ double hull 4 0.6 17 2.5 0 0.0 100 Aframax ‐ double hull 21 2.0 32 3.0 3 0.3 Smaller ‐ double hull 33 1.2 28 1.1 0 0.0 90 Total ‐ double hull 62 4.9 85 9.0 3 0.3 80 Single hull 92 9.8 44 3.1 1 0.3 Total 154 14.8 129 12.1 4 0.6 70 * Including total loss/conversion/reclass 60 For tonnage definitions, visit www.platou.com/dnn_site/LinkClick.aspx?fileticket=CodSYdx5lSM%3d&tabid=536 02 03 04 05 06 07 08 09 10 11 12 13 VLCC Suezmax Aframax RS Platou Economic Research AS Shipbroking | Oslo 6
- 7. RS Platou Monthly December 2012 Bulk carriers | Freight market A significant slowdown in iron ore transportation from Brazil to In other segments earnings remained more or less unchanged Asia caused a sharp drop in freight rates for Capesize tonnage over compared with the month before, supported by high Chinese the last month. The Panamax market also weakened, mainly due to imports of minor bulk commodities. slower activity in coal and grain trade. Average freight rates in 1,000 USD/day Weekly spot rates 1,000 USD/day 2011 2012 Nov 2012 Dec 2012 25 Capesize 15.9 9.7 18.6 9.4 Panamax 14.6 8.1 6.9 6.8 Spot 20 Supramax 14.4 9.4 7.3 7.8 Handysize 10.5 7.6 6.2 6.6 15 Capesize 16.1 11.4 13.0 10.0 12m T/C Panamax 14.1 9.4 8.5 7.3 10 Supramax 13.7 9.9 9.0 8.5 Handysize 11.1 7.6 7.0 6.8 5 0 For weekly freight rates, visit www.platou.com/dnn_site/EconomicResearch/WeeklyFreightRates.aspx 2‐Nov 16‐Nov 30‐Nov 14‐Dec 28‐Dec Capesize Panamax Supramax Handysize Dry bulk fleet development in mill dwt Deliveries* Removals Fleet end YoY 2012 2012 Dec 2012 in % 12 months T/C rates 1,000 USD/day Capesize 38.6 12.4 267.7 10.8 175 Post Panamax 10.4 0.8 44.1 27.7 Panamax/Kamsarmax 20.1 4.1 140.0 12.9 150 Handymax/Supramax 19.0 7.9 136.7 8.8 125 Handysize 9.2 6.5 85.6 3.3 100 Total dry bulk fleet 97.3 31.7 674.1 10.8 75 * Including conversions 50 25 Industrial production, YoY in % 0 2011 2012E 2013F 02 03 04 05 06 07 08 09 10 11 12 13 USA 4.1 3.6 1.9 Euro area 3.5 ‐2.1 ‐0.1 Capesize Panamax Supramax Handysize Japan 2.4 ‐0.6 ‐0.5 China 13.9 10.1 11.1 Other Asia 3.4 2.9 5.0 World steel production Mill tons/month 140 Steel production in mill tons 120 2011‐11m 2012‐11m YoY in % 100 USA 78.9 81.4 3.2 80 Japan 99.2 98.7 ‐0.5 EU27 165.4 157.3 ‐4.8 60 China 641.4 660.1 2.9 40 Other Asia 150.8 152.3 1.0 Total world 1384.6 1397.3 0.9 20 0 07 08 09 10 11 12 Total world China Rest of the world RS Platou Economic Research AS Shipbroking | Oslo 7
- 8. RS Platou Monthly December 2012 Bulk carriers | Sale and purchase During 2012 sales of both Capesize and Kamsarmax/Panmax As a result of the vast number of deliveries of newbuildings, tonnage almost doubled compared to the previous year, whereas leading to a poor freight market, values took a negative turn during sales activity for Supramax/Handymax and Handysize remained 2012. Values for resale tonnage dropped 15‐20 percent whereas 5‐ fairly steady. Due to defaults as well as cancellations caused by 10 year old tonnage saw values decrease 20‐30 percent compared delays in construction of newbuildings it is worth noting that more to end of last year. Having said this, a number of resales from 2nd than 45 resales of the larger segments changed hands, most of tier Chinese yards have been concluded at heavily discounted which from Chinese shipyards. prices due to old/poor designs and questionable quality. Estimated values in mill USD Second hand values, 5 years old Mill USD Dec 2011 Oct 2012 Nov 2012 Dec 2012 160 180,000 dwt resale 48.0 41.0 41.0 41.0 172,000 dwt 5 years 38.0 31.0 31.0 31.0 170,000 dwt 10 years 29.0 21.0 21.0 21.0 120 82,000 dwt resale 33.0 27.0 26.5 26.5 74,000 dwt 5 years 26.0 19.5 19.0 19.0 80 72,000 dwt 10 years 20.0 13.5 13.5 13.5 56,000 dwt resale 31.5 26.0 25.5 25.5 40 52,000 dwt 5 years 25.0 19.5 19.0 19.0 50,000 dwt 10 years 19.0 14.5 14.5 14.5 0 32,000 dwt resale 25.0 21.0 21.0 21.0 02 03 04 05 06 07 08 09 10 11 12 13 28,000 dwt 5 years 20.0 15.5 15.5 15.5 28,000 dwt 10 years 15.0 11.5 11.5 11.5 Capesize Panamax Handymax Baltic Sale & Purchase Assessments in mill USD Second hand values, 10 years old Mill USD Average Baltic panel assessments 10 Dec 24 Dec 150 Capesize ‐ 5 years old 172,000 dwt 29.8 29.7 Panamax ‐ 5 years old 74,000 dwt 18.5 18.3 Super Handy ‐ 5 years old 52,000 dwt 18.1 18.1 100 Demolition prices in USD/ldt 50 Dec 2011 Oct 2012 Nov 2012 Dec 2012 Far East 425 360 360 375 Sub continent* 450/460 415 390 400 0 * India/Bangladesh/Pakistan 02 03 04 05 06 07 08 09 10 11 12 13 Capesize Panamax Handymax Sold for scrapping in no. / mill dwt 2011 2012 Dec 2012 Capesize 61 9.9 74 12.4 1 0.2 5 years second hand values in percent of newbuilding prices Post Panamax 6 0.6 9 0.8 1 0.1 Panamax/Kamsarmax 24 1.7 58 4.1 1 0.1 200 Handymax/Supramax 79 4.3 151 7.9 5 0.3 175 Handysize 186 4.8 220 6.5 5 0.2 150 Total 356 21.2 512 31.7 13 0.7 125 100 75 50 02 03 04 05 06 07 08 09 10 11 12 13 Capesize Panamax Handymax RS Platou Economic Research AS Shipbroking | Oslo 8
- 9. RS Platou Monthly December 2012 Cellular container ships Box rates were under continued downward pressure during generally unchanged or slightly weaker rates than in the previous December resulting from seasonal slower demand in the OECD month. Yearly average charter rates fell between 40 and 50 area and a continued inflow of new ships from yards. A couple of percent from 2011 to 2012. Box rates, however, were on a yearly ships which have been laid up were also reactivated and average basis between 20 and 25 percent higher than in 2011. This contributed thereby to a stronger fleet growth than demand was possible due to a strong recovery in the first half of the year, growth. In the charter market a couple of fixtures were noticed at which more than compensated for the drop in the second half. Average charter rates in 1,000 USD/day 12 month T/C rates 1,000 USD/day 2011 2012 Nov 2012 Dec 2012 60 1,000 TEU 8.1 5.5 5.3 5.3 1,700 TEU 10.4 6.5 6.2 6.0 50 3,000 TEU 14.0 8.1 7.8 7.5 40 4,500 TEU 20.3 10.0 10.0 10.0 30 20 Container fleet development in mill TEU Deliveries Removals Fleet end YoY 10 2012 2012 Dec 2012 in % 0 Below 1,000 TEU 0.01 0.02 0.68 ‐1.2 02 03 04 05 06 07 08 09 10 11 12 13 1,000 ‐ 1,999 TEU 0.06 0.09 1.75 ‐1.8 2,000 ‐ 3,999 TEU 0.04 0.19 2.67 ‐5.2 4,500 TEU 3,000 TEU 1,700 TEU 1,000 TEU 4,000 ‐ 5,999 TEU 0.21 0.00 4.63 4.6 6,000 ‐ 7,999 TEU 0.06 0.00 1.76 3.6 8,000 ‐ 9,999 TEU 0.23 0.00 2.72 9.2 Building prices Mill USD 10,000+ TEU 0.64 0.00 2.05 45.8 120 Total container fleet 1.25 0.30 16.26 6.2 100 80 Order book in no. / mill TEU TEU Total 2013 2014 2015+ 60 Below 1,000 2 0.00 2 0.00 0 0.00 0 0.00 40 1,000 ‐ 1,999 57 0.09 37 0.06 18 0.03 2 0.00 2,000 ‐ 3,999 78 0.25 54 0.18 8 0.02 16 0.05 20 4,000 ‐ 5,999 83 0.39 60 0.28 18 0.09 5 0.03 0 6,000 ‐ 7,999 31 0.20 29 0.19 2 0.01 0 0.00 8,000 ‐ 9,999 85 0.76 49 0.43 30 0.27 6 0.05 02 03 04 05 06 07 08 09 10 11 12 13 10,000+ 130 1.74 60 0.77 49 0.66 21 0.30 6,000 TEU * 4,500 * 3,000 1,700 1,000 Total 466 3.42 291 1.91 125 1.08 50 0.43 * Gearless Second hand values, 5 years old Mill USD New orders in no. / mill TEU 100 2011 2012 Dec 2012 Prices per end Oct 2011 * Below 1,000 TEU 3 0.00 8 0.00 0 0.00 80 1,000 ‐ 1,999 TEU 34 0.05 18 0.02 0 0.00 2,000 ‐ 3,999 TEU 26 0.08 20 0.06 6 0.02 60 4,000 ‐ 5,999 TEU 35 0.17 17 0.09 0 0.00 6,000 ‐ 7,999 TEU 19 0.13 3 0.02 0 0.00 40 8,000 ‐ 9,999 TEU 33 0.29 15 0.14 0 0.00 20 10,000+ TEU 74 1.00 10 0.14 0 0.00 Total 224 1.72 91 0.47 6 0.02 0 02 03 04 05 06 07 08 09 10 11 12 13 * Due to the market turbulence and an increaslingly complex sale and purchase market, no second hand price updates have been provided 4,500 TEU 3,000 TEU 1,700 TEU 1,000 TEU since October 2011 RS Platou Economic Research AS Shipbroking | Oslo 9
- 10. RS Platou Monthly December 2012 LNG carriers Cold weather in Asia and slightly dampening prices in Northern over the festive period, there is still some vessel availability as well Europe have widened the west‐east arbitrage so any excess as a few enquires, hence we may very well see fixtures in the near cargoes in the Atlantic not already committed to South America future. The market for 1st/2nd generation vessels may secure could head east. While little activity seems to have taken place more employment with the wider arbitrage. Average charter rates in 1,000 USD/day Freight rates, 155,000 cbm 1,000 USD/day 2011 2012 Nov 2012 Dec 2012 160 155k cbm ‐ Spot 93 125 105 100 140 155k cbm ‐ T/C 96 136 105 100 120 100 LNG carrier fleet development in no. / mill cbm 80 Deliveries Removals Fleet end YoY 60 1,000 cbm 2012 2012 Dec 2012 in % 40 10‐50 0 0.00 3 0.12 12 0.30 ‐28.3 20 50‐100 0 0.00 0 0.00 15 1.14 0.0 0 100‐200 2 0.30 0 0.00 302 43.01 0.7 05 06 07 08 09 10 11 12 13 200+ 0 0.00 0 0.00 45 10.37 0.0 Total 2 0.30 3 0.12 374 54.83 0.3 Spot 12m T/C Order book in no. / mill cbm Building price, 155,000 cbm Mill USD 1,000 cbm Total 2013 2014 2015+ 250 10‐50 1 0.02 1 0.02 0 0.00 0 0.00 50‐100 0 0.00 0 0.00 0 0.00 0 0.00 225 100‐200 92 14.99 21 3.40 37 5.97 34 5.62 200+ 0 0.00 0 0.00 0 0.00 0 0.00 200 Total 93 15.01 22 3.42 37 5.97 34 5.62 175 New orders in no. / mill cbm 150 1,000 cbm 2011 2012 Dec 2012 10‐50 0 0.00 0 0.00 0 0.00 125 50‐100 0 0.00 0 0.00 0 0.00 02 03 04 05 06 07 08 09 10 11 12 13 100‐200 51 8.21 33 5.45 9 1.52 200+ 0 0.00 0 0.00 0 0.00 Total 51 8.21 33 5.45 9 1.52 Natural gas prices USD/mmbtu 30 LNG imports in mill mt 2011 2012‐11m Nov 2012 25 Japan 77.26 79.48 6.66 20 Korea 36.75 32.07 3.03 China 12.13 12.87 1.08 15 10 5 0 02 03 04 05 06 07 08 09 10 11 12 13 Henry Hub NBP LNG spot Asia RS Platou Economic Research AS Shipbroking | Oslo 10
- 11. RS Platou Monthly December 2012 Representative reported newbuilding contracts Tank Capacity Shipyard Owner Reported price/unit Delivery 2 x 49,000 dwt Hyundai Vinashin Wilmar 28/29 mill USD 2014 2 x 50,000 dwt Hyundai Mipo D'Amico 2014 4 x 50,000 dwt SPP Shipbuilding Scorpio Tankers 31/32 mill USD 2014 4 x 50,000 dwt SPP Shipbuilding Ceres 31/32 mill USD 2014/2015 1 x 51,000 dwt STX Dalian Great Eastern Shipping 2015 2 x 52,000 dwt Hyundai Mipo Scorpio Tankers 2014 20 x 52,000 dwt Hyundai Mipo Sinokor 31/32 mill USD 2014‐2017 10 x 120,000 dwt STX Shipbuilding BP 2014/2015 3 x 157,000 dwt STX Shipbuilding BP 2015 2 x 308,000 dwt Dalian Shipyard COSCO Dalian 84/85 mill USD 2014 Bulk Capacity Shipyard Owner Reported price/unit Delivery 4 x 39,500 dwt Chengxi Shipyard China Navigation 22 mill USD 2013/2014 3 x 48,500 dwt Chengxi Shipyard Jiangsu Ligang Power 2014 2 x 63,000 dwt Hyundai Vinashin Joong Ang Shipping 25 mill USD 2014 1 x 65,000 dwt Chengxi Shipyard Guangzhou Maritime Transport 2014 2 x 181,000 dwt Shanghai Waigaoqiao Thenamaris 2014 Container Capacity Shipyard Owner Reported price/unit Delivery 2 x 3,100 TEU Nassco Totem 70 mill USD 2015/2016 LNG Capacity Shipyard Owner Reported price/unit Delivery 1 x 154,880 cbm Hyundai H.I. Brunei Gas 2015 2 x 160,000 cbm Samsung H.I. Chevron 2015/2016 2 x 173,400 cbm Daewoo Shipbuilding Teekay 2016 4 x 174,000 cbm Hyundai Samho Maran Gas 2015/2016 LPG Capacity Shipyard Owner Reported price/unit Delivery 1 x 84,000 cbm Hyundai H.I. Tomza 73 mill USD 2015 Car carriers Capacity Shipyard Owner Reported price/unit Delivery 1 x 7,290 CEU Hyundai Gunsan Eukor 2014 RS Platou Economic Research AS Shipbroking | Oslo 11
- 12. RS Platou Monthly December 2012 Representative second hand sales Tank Name Capacity Built Price Buyers Comments Mayfair 298,000 dwt 1995/Korea 23.5 mill USD Russia Champion Pride 100,000 dwt 1998/Korea 10.3 mill USD Greece SS/DD due Nov 2013 Katja 97,000 dwt 1995/Japan 8 mill USD Mid East Chemical/Product Name Capacity Built Price Buyers Comments Gan‐Destiny 113,000 dwt 2010/Korea 33.6 mill USD Greece Gan‐Dignity 113,000 dwt 2010/Korea 31.5 mill USD US/Greece Freja Dania 54,000 dwt 2007/Japan 20 mill USD Great Britain Haruna Express 46,000 dwt 2004/Japan 16.3 mill USD Hong Kong Seaexpress 46,000 dwt 2007/Japan 18 mill USD Greece Lihou 39,000 dwt 2005/China 12.5 mill USD Greece Auction Stolt Swazi 20,000 dwt 2007/Japan 21.8 mill USD China Bulk Name Capacity Built Price Buyers Comments Bulk Asia 171,000 dwt 2001/Japan 19.1 mill USD Greece Bulk Europe 170,000 dwt 2001/Japan 19.8 mill USD China Front Guider 169,000 dwt 1991/Korea 9.1 mill USD Undisclosed Ex. OBO Front Viewer 169,000 dwt 1992/Korea 9.1 mill USD Undisclosed Ex. OBO Vogebulker 169,000 dwt 1999/Korea 14.2 mill USD Greece Tsuneishi resale 82,000 dwt 2013/Japan 26.5 mill USD Greece Ikan Bayan 76,000 dwt 2005/Japan 15.5 mill USD Greece Freia 74,000 dwt 2003/Japan Rgn 14 mill USD Greece SS/DD due Tpc Arirang 72,000 dwt 1994/Japan 7.1 mill USD Korea Yong Jin 72,000 dwt 1995/Japan 6.8 mill USD China Mass Enterprise 70,000 dwt 1993/Japan 5.3 mill USD China Yangzhou Dayang 4022 64,000 dwt 2013/China 49.0 mill USD European Enbloc Yangzhou Dayang 4021 64,000 dwt 2013/China " " " Rosanna D 58,000 dwt 2012/China 20.2 mill USD Greece Ocean Queen 52,000 dwt 2003/Philippine 15.0 mill USD Far East Prabhu Jivesh 51,000 dwt 2002/Japan 14.1 mill USD Undisclosed Selandia 48,000 dwt 1996/Poland 6.5 mill USD Undisclosed Ks Express 46,000 dwt 1994/Japan 6.8 mill USD Indonesia Id Tide 45,000 dwt 1995/Japan 7.0 mill USD Undisclosed You Xuan 44,000 dwt 1990/Japan 4.5 mill USD Undisclosed Kerkini 34,000 dwt 2012/Korea 25.4 mill USD Chile Container Name Capacity Built Price Buyers Comments Cap Capricorn 2,824 TEU 2007/Korea 15.5 mill USD Undisclosed E.R. Santiago 2,226 TEU 1998/Taiwan 5.4 mill USD Undisclosed RS Platou Economic Research AS Shipbroking | Oslo 12
- 13. RS Platou Monthly December 2012 Contact list Oslo RS Platou ASA RS Platou Shipbrokers Haakon VII's gate 10 Sale and Purchase +47 2311 2500 snp@platou.com N‐0119 Oslo Newbuilding +47 2311 2650 new@platou.com Norway Tank +47 2311 2485 tnk@platou.com Tel: +47 2311 2000 Dry Cargo +47 2311 2450 dry@platou.com Fax: +47 2311 2300 Car +47 2311 2600 car@platou.com office@platou.com Economic Research +47 2311 2000 ecr@platou.com RS Platou Offshore RS Platou Markets AS RS Platou Finans AS Tel: +47 2311 2000 Tel: +47 2201 6300 Tel: +47 2311 2000 Fax: +47 2311 2388 Fax: +47 2201 6310 Fax: +47 2311 2327 off@platou.com office@platoumarkets.com finans@platou.com Geneva Houston London RS Platou Geneve SA Lone Star RS Platou Inc. RS Platou London 19, Rue de la Corraterie 363 N. Sam Houston Parkway E. Floor 38A, Tower 42 CH‐1204 Geneva Suite 125 25 Old Broad Street Switzerland Houston, Texas 77060 London EC2N 1HQ, United Kingdom Tel: +41 22 715 1800 USA Tel: +44 20 7448 7110 Fax: +41 22 715 1820 Tel: +1 281 445 5600 Fax: +44 20 7448 7111 dry@platou.ch Fax: +1 281 445 1090 snp@platoulondon.com tankers@lsrsp.com platoulng@platoulondon.com Melbourne Moscow Perth RS Platou Melbourne SA RS Platou ASA, Moscow RS Platou Perth SA Office 2, Level 10 Bronnaya Plaza, Bldg. 1, Floor 7 8/38 Colin St. 499 St. Kilda 32, Sadova‐Kudrinskaya St. West Perth 6005 Melbourne 3004 Moscow 123001, Russia WA, Australia Victoria, Australia Tel: +7 495 787 9922 Tel: +61 618 9226 0618 Tel: +61 613 9867 1466 Fax: +7 495 787 9929 Fax: +61 618 9486 8120 Fax: +61 613 9820 0106 moscow@platou.com drycargo.australia@platou.com drycargo.australia@platou.com Piraeus Shanghai Singapore RS Platou Hellas Ltd. RS Platou ASA Shanghai Repr. Office RS Platou (Asia) Pte. Ltd. 1‐3 Filellinon Str. Lippo Plaza, Unit 2212‐2213 3 Temasek Avenue 185 36 Piraeus 222 Huai Hai Zhong Road # 20‐01 Centennial Tower Greece Shanghai 200021, China Singapore 039190 Tel: +30 210 4294 070 Tel: +86 21 5396 5959 Tel: +65 6336 8733 Fax: +30 210 4294 071 Fax: +86 21 5396 5665 Fax: +65 6336 8740 snp@platou.gr pshang@platoushanghai.com snp@platou.com.sg dry@platou.gr dry@platou.com.sg offshore@platou.com.sg Sydney While care has been taken to ensure the information in this report is accurate, it is a general RS Platou Sydney SA guide and not intended to be relied upon for any specific purpose. RS Platou ASA, its Ground Floor, 174 Willoughby Road affiliates, directors and employees are not responsible or liable for any losses or conse‐ Crows Nest, Sydney 2065 quences, whatsoever, arising from any errors, lack of correctness, inaccuracy or NSW, Australia incompleteness of the information contained herein. Reproducing any materials from this Tel: +61 612 9937 8800 report without prior approval from RS Platou ASA is strictly forbidden. All matters relating to Fax: +61 612 9437 0036 this report shall be governed by the laws of Norway, and any dispute arising in respect of this drycargo.australia@platou.com presentation is subject to the exclusive jurisdiction of Norwegian courts with Oslo as legal venue. RS Platou Economic Research AS Shipbroking | Oslo 13