[Infographic] Four Efficiency Challenges Facing Financial Services Real Estate Teams
•
0 gostou•760 visualizações

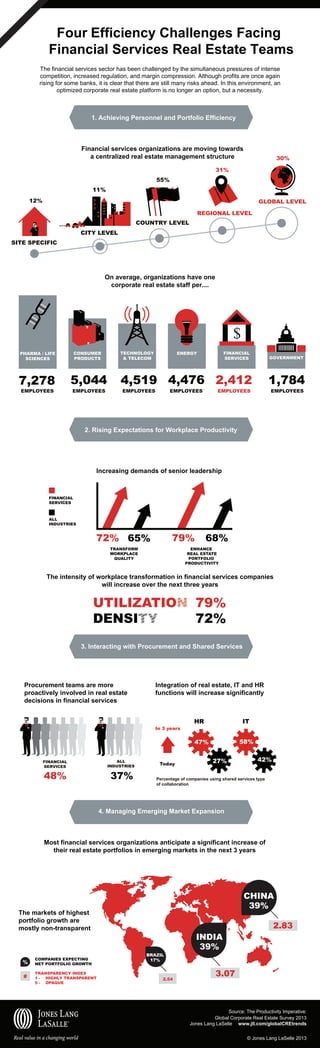
The financial services sector has been challenged by the simultaneous pressures of intense competition, increased regulation, and margin compression. Although profits are once again rising for some banks, it is clear that there are still many risks ahead. In this environment, an optimized corporate real estate platform is no longer an option, but a necessity.
Recomendados

Recomendados
Mais conteúdo relacionado
Semelhante a [Infographic] Four Efficiency Challenges Facing Financial Services Real Estate Teams
Semelhante a [Infographic] Four Efficiency Challenges Facing Financial Services Real Estate Teams (20)
Mais de JLL
Mais de JLL (20)
Último
Último (20)
[Infographic] Four Efficiency Challenges Facing Financial Services Real Estate Teams
- 1. Four Efficiency Challenges Facing Financial Services Real Estate Teams The financial services sector has been challenged by the simultaneous pressures of intense competition, increased regulation, and margin compression. Although profits are once again rising for some banks, it is clear that there are still many risks ahead. In this environment, an optimized corporate real estate platform is no longer an option, but a necessity. 1. Achieving Personnel and Portfolio Efficiency Financial services organizations are moving towards a centralized real estate management structure 30% 31% 55% 11% 12% GLOBAL LEVEL REGIONAL LEVEL COUNTRY LEVEL CITY LEVEL SITE SPECIFIC On average, organizations have one corporate real estate staff per.... $ CONSUMER PRODUCTS PHARMA / LIFE SCIENCES 7,278 EMPLOYEES 5,044 EMPLOYEES TECHNOLOGY & TELECOM FINANCIAL SERVICES ENERGY GOVERNMENT 4,519 4,476 2,412 EMPLOYEES EMPLOYEES 1,784 EMPLOYEES EMPLOYEES 2. Rising Expectations for Workplace Productivity Increasing demands of senior leadership FINANCIAL SERVICES ALL INDUSTRIES 72% 65% 79% TRANSFORM WORKPLACE QUALITY 68% ENHANCE REAL ESTATE PORTFOLIO PRODUCTIVITY The intensity of workplace transformation in financial services companies will increase over the next three years UTILIZATIO DENSI 79% 72% 3. Interacting with Procurement and Shared Services Procurement teams are more proactively involved in real estate decisions in financial services Integration of real estate, IT and HR functions will increase significantly In 3 years HR IT 58% 47% FINANCIAL SERVICES 48% ALL INDUSTRIES 37% Today 27% 42% Percentage of companies using shared services type of collaboration 4. Managing Emerging Market Expansion Most financial services organizations anticipate a significant increase of their real estate portfolios in emerging markets in the next 3 years CHINA 39% The markets of highest portfolio growth are mostly non-transparent % COMPANIES EXPECTING NET PORTFOLIO GROWTH # TRANSPARENCY INDEX 1 - HIGHLY TRANSPARENT 5 - OPAQUE BRAZIL 17% 2.54 INDIA 39% 2.83 3.07 Source: The Productivity Imperative: Global Corporate Real Estate Survey 2013 Jones Lang LaSelle www.jll.com/globalCREtrends © Jones Lang LaSelle 2013