Reveelium Technical Overview - Datasheet EN
•
0 gostou•67 visualizações

System requirements Backend requirements Minimal hardware requirements Etc.

Recomendados
Recomendados
Mais conteúdo relacionado
Destaque
Semelhante a Reveelium Technical Overview - Datasheet EN
Semelhante a Reveelium Technical Overview - Datasheet EN (20)
Mais de ITrust - Cybersecurity as a Service
Mais de ITrust - Cybersecurity as a Service (20)
Último
Último (20)
Reveelium Technical Overview - Datasheet EN
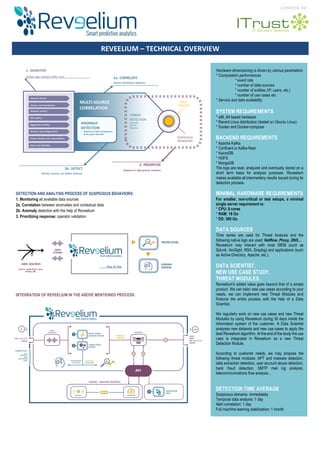
- 1. Created by: REVEELIUM – TECHNICAL OVERVIEW Hardware dimensioning is driven by various parameters: * Computation performances * event rate * number of data sources * number of entities (IP, users, etc.) * number of use cases etc. * Service and data availability SYSTEM REQUIREMENTS * x86_64 based hardware * Recent Linux distribution (tested on Ubuntu Linux) * Docker and Docker-compose BACKEND REQUIREMENTS * Apache Kafka * Confluent.io Kafka-Rest * KairosDB * HDFS * MongoDB The logs are read, analyzed and eventually stored on a short term basis for analysis purposes. Reveelium makes available all intermediary results issued during its detection process. MINIMAL HARDWARE REQUIREMENTS For smaller, non-critical or test setups, a minimal single server requirement is: * CPU: 8 cores * RAM: 16 Go * DD: 300 Go DATA SOURCES Time series are used for Threat Analysis and the following native logs are used: Netflow, Proxy, DNS… Reveelium may interact with most SIEM (such as Splunk, ArcSight, RSA, Graylog) and applications (such as Active Directory, Apache, etc.). DATA SCIENTIST. NEW USE CASE STUDY. THREAT MODULES. Reveelium's added value goes beyond that of a simple product. We can tailor new use cases according to your needs, we can implement new Threat Modules and finetune the entire process with the help of a Data Scientist. We regurlarly work on new use cases and new Threat Modules by using Reveelium during 30 days inside the information system of the customer. A Data Scientist analyses new datasets and new use cases to apply the best Reveelium algorithm. At the end of the study the use case is integrated in Reveelium as a new Threat Detection Module. According to customer needs, we may propose the following threat modules: APT and malware detection, data extraction detection, user account abuse detection, bank fraud detection, SMTP mail log analysis, telecommunications flow analysis… DETECTION TIME AVERAGE Suspicious domains: immediately Temporal data analysis: 1 day Alert correlation: 1 day Full machine learning stabilization: 1 month DETECTION AND ANALYSIS PROCESS OF SUSPICIOUS BEHAVIORS: 1. Monitoring all available data sources 2a. Correlation between anomalies and contextual data 2b. Anomaly detection with the help of Reveelium 3. Prioritizing response: operator validation INTEGRATION OF REVEELIUM IN THE ABOVE MENTIONED PROCESS:
- 2. Created by: HUMAN-MACHINE INTERFACE & REPORTING THREAT OBJECTS From the user's point of view, examining one by one the alerts raised by Reveelium may prove rather demanding, especially when the amount of alerts is large. In order to help the user detect quicker potentially malicious behaviors, Reveelium provides a threat analysis engine too. This attempts to correlate individual alerts to generic scenarios (i.e. specific behavioral patterns of events or sequence of events). Whenever the behavior of an entity matches (even partially) such a scenario, a threat object is created and shown to the user. A threat groups the alerts raised within the last 24 hours that have already (partially) matched the scenario. A threat level is assigned to this set of alerts, which loosely corresponds to the degree a given entity matches the scenario. As mentioned above, threat objects process the alerts raised by Reveelium during the last 24 hours. Therefore, the score of a threat object may evolve in time. If no more alerts will be signaled in the next 24 hours by Reveelium for that entity (i.e. alerts that are relevant to the specific scenario), the threat object will be marked as inactive and removed from the visualization lists. THREAT PROPERTIES Entity: IP of the analyzed machine Scenario: name of the scenario supposedly affecting the entity Last observation: last time when the threat object has been updated Next observation: next time when the update of the threat object is scheduled Score: numeric estimation of the risk level of an entity, between 0 and 100 (can be loosely interpreted as a percentage of the behavior of the entity matching the respective scenario) GUI COMPONENTS The Threats page displays three alternative views, an Entities list view which groups threatening scenarios per entity (i.e. when the entity's behavior matches multiple scenarios), a Threats list view, which lists threats individually, for each available entity and scenario and a Network view, which displays the graph of threats corresponding to a specific topology of the entities (here, the graph of subnetworks). All the three views are synchronized to show the same type of information whenever visualization filters are applied to the current threats set. See in the images below each of the three views of the threat objects. HOME VIEW Displays abnormal behaviour in time, with a priority warning score:
- 3. Created by: HUMAN-MACHINE INTERFACE & REPORTING DECISION TREE Enables perfoming an anomaly warning analysis. THREATS LIST Displays the simple list of threats (i.e. not grouped by their entities). ENTITIES LIST Displays the threats grouped per entity (i.e. IP address).
- 4. Created by: CONTACT ITrust, 55 avenue de l’Occitane www.itrust.fr/en +33 (0)567 346 780 HUMAN-MACHINE INTERFACE & REPORTING VISUALIZATION TOOLS In addition to the analytic tools described previously, Reveelium provides graphical tools aiming to help the user examine global-scale stats and eventually focus on specific items to further investigate in depth. For example, the screenshot of the Vision page displayed below shows the histogram of the number of alerts per entity (machine) in a specific time interval: Other graphs, also visible from the same menu show, the distribution of types of alerts raised by Reveelium, during a given time interval, or the evolution of the number of alerts per entity during that specific period. NETWORK VIEW Displays the graph of the network entities and their associated threat level. By default, the first and second views show the items sorted by their threat levels. However, the user can opt to sort the entities by IP or by threat score from the top-left option. The third option provides an integrated threat level view over the topology of the entire network. This intuitive tool helps figuring out very quickly which parts of the network may be infected. The user can filter for specific criteria the set of threats displayed by Reveelium, by using the search bar. Clicking on an item from each of the three views enumerated displays the set of alerts having (partially) matched the respective scenario. The details associated with the threat object are displayed on the right panel of the page.