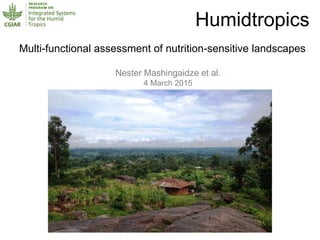
Multi-functional assessment of nutrition-sensitive landscapes
•Transferir como PPTX, PDF•
1 gostou•86 visualizações

Characterise the current landscape and determine landscape performance in terms of production, environmental outcomes and nutrition.

Recomendados
Recomendados
Mais conteúdo relacionado
Mais procurados
Mais procurados (20)
Destaque
Destaque (8)
Semelhante a Multi-functional assessment of nutrition-sensitive landscapes
Semelhante a Multi-functional assessment of nutrition-sensitive landscapes (20)
Mais de International Institute of Tropical Agriculture
Mais de International Institute of Tropical Agriculture (20)
Último
Último (20)
Multi-functional assessment of nutrition-sensitive landscapes
- 1. Multi-functional assessment of nutrition-sensitive landscapes Nester Mashingaidze et al. 4 March 2015 Humidtropics
- 2. Introduction • Vulnerable populations are often food insecure • Food security: – Sufficient calories – Diverse nutrients • Sources of food – farm production – market – Landscape • Nutrition-sensitive landscapes – optimise production, NRM and nutrition
- 3. Objectives 1. Characterise the current landscape and determine landscape performance in terms of production, environmental outcomes and nutrition. 2. Explore trade-offs and synergies of proposed interventions at landscape level. 3. Identify and test entry points for improvements in farming, diets and ecosystem services provided by the landscape
- 5. The case studies • Western Kenya – Densely populated (1 044 persons km-2) – Food crops (maize, beans) – Cash crops (tea, vegetables) – Food insecurity, land degradation, poverty • Northwest Vietnam – Low smallholder agricultural productivity – Degradation of natural resources – Low income and access to markets – Malnutrition
- 6. Site selection 1. Review of secondary sources & experts 2. Field visits to 10 sub-locations - Mambai: tea-based & Masana: maize-based 3. Participatory mapping 4. Transect Walk
- 7. Landscapes in Vihiga County • Mambai landscape - river + ‘forest’ - Impactlite survey to 10 households • Masana sub-location - circumcision forest -10 households surveyed
- 8. Preliminary results • Soil fertility Masana > Mambai • Majority of land holdings < 0.5 ha - Some Hhs had fields away from landscape Mambai (50%) & Masana (30%) • No major forests, nearby lakes or dams • Hh size: Masana 5(±2.5) and Mambai 4.5 (±1.4)
- 9. Crop production • Crop species: Mambai slightly > Masana • Masana: maize > banana > napier • Mambai: maize > tea > eucalyptus • Vegetables < 0.04% of cropped area
- 10. Food – produced and purchased • All farms produced food crops – Beans purchase Masana > Mambai – Banana purchase low – Low consumption of traditional vegetables?
- 11. Way forward • Building of farms into FarmDesign on-going • Farms to be aggregated in LandscapeIMAGES • Field visits for additional data collection • Modeling and community feed backs
- 13. Thank you Insert photo here . C. Timler 2014
Notas do Editor
- Carl Timler 2/27/2015 perhaps also include other comparisons such as agro ecologies, population densities, topography, access to main roads/markets
- In mambai – 4/5 away fields under maize-bean, 2/5 fields under tea including farmer 7, Masana all3 hh with away fields under maize, 1 sweetpotato, woodlot Mambai – without tea farmer 1: employed at school farmer 7: small area within landscape, away field under tea Masana: maize 55%) > banana (18%) > napier (12%) Mambai: maize (37%) > tea (28%) > eucalyptus (22%) - Area under banana in Mambai quite low cfd to Masana - Napier (12%) in both highlighting the importance of livestocks in both sub-locations!