SlideShare uma empresa Scribd logo
1 de 22
TPM Diagnostic4/15/2010 Rev BA. TPM OrganizationTraditional1234TPM5A.1 LeadershipVision – It is essential that top management have a strong commitment to TPM and understand what that commitment entails.  Establishing a favorable environment is management’s primary responsibility.  Top management must inform their employees of this decision and communicate enthusiasm for the program.A.1.1 Quality of TPM Vision1-2 Elements3-4 Elements5-6 Elements7-8 Elements9 ElementsThe TPM vision optimizes equipment effectiveness, eliminates breakdowns and promotes autonomous operator maintenance through day-to-day activities.Elements:Active commitment from director to shop floorA can-do approachUse OEE to promote achievement, pride and ownership.Increase the knowledge of TPMEliminate the six big losses and show reasons whyPromote and improve Small Group Activity teamworkUnderstand and use all equipment performance measurements.Achievable short, medium and long term goalsDevelop belief in TPM by using results communicated to all.A.1.2 Vision DeploymentManagement and the workforce have been educated/trained, understand and embrace the vision of lean production.Management has not communicated a vision of TPMLess than 10% of management and the workforce understands the vision.Less than 50% of management and the workforce understands the vision.Less than 70% of management and the workforce understands the vision.More than 71% of management and the workforce understands the vision.A.1.3 Basic Organization StructureThe concept of a TPM system is used to organize maintenance and support required to produce product Organization is process based (traditional functional organization structure).6 or 7 elements of authority are vested in the product-based organization.8 or 9 elements of authority are vested in the product-based organization.10 to 11 elements of authority are vested in the product-based organization.12 or more elements of authority are vested in the product-based organization.Elements of production system authority:Physical maintenance organizationPersonnel assignmentsCellularizationOrganization of factory teamsQuality polices and practicesSupplier/spares integrationInventory policiesMetrics and measurement (including waste)Reporting lines of support functionsContinuous process improvement approachGain sharing policies for workforceJob stability policies for workforceManufacturing practices and processes.<br />Page 1 of 3<br />TPM DiagnosticPage 2 of 3A. TPM OrganizationTraditional1234TPM5A.2  TPM StructureVision – The physical organization and layout of the factory should support the concept of a “Lean “ factory organization.  Production flow, status and problems should be readily apparent to the casual observer.  Maintenance operations within cells have been optimized to minimize wasted time and effort.A.2.1 Factory OrganizationThe factory is ideally organized into cells by product.  Maintenance may be based on group technology or parts family concepts.Less than 25% of factory organized product25-49% of factory50-74% of factory75-89% of factoryOver 90% of factoryA.2.2 Flow Between Product Cells and Maintenance AreasClear, visible workflow, and input and output for maintenance product cells.Less than 25% of factory has clear and well-defined input/output areas.25-49% of factory50-74% of factory75-89% of factoryOver 90% of factoryA.2.3 Internal Maintenance Cell Optimization1 Element3 Elements5 Elements7 Elements9 ElementsConcepts of cell optimization are used, understood and implemented in setting up maintenance areas.Elements:Minimized travelMinimized process stepsNecessary materials in placeNecessary tools in placeNecessary equipment in place Minimized inventory between processesClearly define input and outputMaterial, tools and equipment ergonomically arrangedCell organized for safetyA.2.4 Physical ResourcesThe cell business unit controls assets required to produce the product. (Laser alignment equipment, test equipment, etc).Less than 25% of assets required to produce the product are controlled within the cell or applicable business unit.25-49% of assets50-74% of assets75-89% of assetsOver 90% of assetsA.2.5 Production/Maintenance Status/CommunicationsA.2.5.1 External Communication of Production/Maintenance StatusProduction flow, status, and problems are apparent to the casual observer.Less than 25% of factory has clear production flow, status and problem visibility.25-49% of factory50-74% of factory75-89% of factoryOver 90% of factoryA.2.5.2 Internal Communication of Production/Maintenance StatusData for cell operations is available for all team members.  Each cell and business unit has easily visible facilities for communications (meeting areas, boards, etc.).Less than 25% of factory has data availability and good facilities for communications.25-49% of factory50-74% of factory75-89% of factoryOver 90% of factory<br />A.2.6    5S’s The 5S methods are the key to a quality work environment.  The underlying principle is a place for everything and everything in its place, clean and ready for use (Score using Levels of Excellence Sheet.) Instructions:  Start at the bottom of each column and check the box(s) that reflect the maximum level achieved.SortSimplifySweepStandardizeSelf-disciplineLevel 5:  Focus on PreventionEmployees are continually seeking improvement opportunitiesA dependable, documented method has been developed to provide continual evaluation, and a process is in place to implement improvements.Area employees use a dependable, documented method of preventative cleaning & maintenance.Everyone is continually seeking the elimination of waste with changed documented and information sharedThere is a general appearance of a confident understanding of and adherence to 5S principles.Level 4: Focus on ConsistencyA dependable, documented method is established to keep the work area free of unnecessary items.A dependable, documented method has been established to recognize in a visual sweep if items are out of place or exceed quantity limits.5S agreements are understood and practiced continually.Substantial process documentation is available and followed.Follow-through with 5S agreements and safety practices is evident.Level 3:  Make it VisualUnnecessary items are removed from the workplaceDesignated locations are marked to make organization more visible.Work/break areas & machines are cleaned daily.  Visual controls are established and well marked.Working environment changes are being documented.  Visual control agreements for labeling and quantity levels established.5S agreements and safety practices have been developed and are utilizedLevel 2: Focus on BasicsNecessary and unnecessary items are separated.A designated location has been established for items.Work/break areas & machines are cleaned on a regular schedule.  Key items to check are identified.Methods are improving, but changes haven’t been documentedA recognizable effort has been made to improve the condition of the workplace.Level 1:  Focus on StartingNeeded and not needed items are mixed throughout the workplace.Items randomly located throughout the work place.Work place areas are dirty, disorganized and key items not marked or identifiedWork place methods are not consistently followed and are undocumented.Work place checks are randomly performed and there is no visual measurement of 5S performance.<br />Page 3 of 3<br />TPM Diagnostic4/15/2010 Rev BB. TPM  Metrics Vision – What gets measured gets done.Traditional1234TPM5B.1 Management0-2 Elements3-4 Elements5-6 Elements7-9 ElementsAll 10 ElementsMeasuring maintenance effectiveness requires constant review and goal setting to focus and channel improvement activities and to attain standardization of metrics.Elements:Operating profitRatio of operating profit to gross capitalValue added productivity.Labor productivityCost reductionHeadcount reductionReduction in product stock valueReduction in work in process valueEquipment investment efficiencyPlant/Labor ratioB.2 Plant Effectiveness0-2 Elements3-4 Elements5-6 Elements7-9 ElementsAll 10 ElementsEnsures each department clearly understands their particular responsibilities and sets targets reflecting those responsibilities.Elements:Overall plant effectivenessOverall sub process effectivenessOverall effectiveness of critical equipmentOverall availabilityPerformance rateStandard production rateAverage actual production rateQuality rateNumber of equipment (plant) failuresNumber of process failuresB.3 Quality and Energy Savings0-3 Elements4-6 Elements7-9 Elements9-10 ElementsAll 11 ElementsThese savings are important performance indicators. Treat them as key unit consumption indicators that relate directly to production costs.Elements:Process defect rateCost of process defectsNumber of defects passed onNumber of warranty claimsValue of warranty claimsOverall YieldElectrical consumptionSteam consumptionFuel consumptionLubrication/Fluid consumptionAuxiliary Material consumptionB.4 Maintenance Reliability and Maintainability1-2 Element3 Elements4 Elements5 ElementsAll 6 ElementsEvaluate two aspects of maintenance. First assess improvements in equipment reliability and maintainability and see how these help to raise plant effectiveness and product quality.  Evaluate efficiency of manufacturing work.Elements:Failure frequencyFailure severity rateCost of stoppages due to failureNumber of idling and minor stoppagesMeantime between failuresEmergency maintenance rateB.5 Maintenance Efficiency1 Element2 Elements3 Elements4 ElementsAll 5 ElementsSystematize and speed up Preventive Maintenance and Condition Based Maintenance to achieve quick turn around and achieve smooth rapid startup by eliminating startup problems.Elements:Reduction in number of shut down maintenance days (SMD)Vertical startup after shutdown maintenancePreventive Maintenance achievement rateCorrective Maintenance TrendMaintenance head count reduction rate<br />Page 1 of 3<br />TPM DiagnosticPage 2 of 3B. TPM  Metrics Traditional1234TPM5B.6 Maintenance Cost1 Element2-3 Elements4 Elements5-6 ElementsAll 7 ElementsIs the maintenance budget being utilized effectively?  Is the work using the most economical methods?  Reference reliability, maintainability, maintenance efficiency, maintenance cost, other maintenance indicators.Elements:Overall maintenance cost rateUnit maintenance costsMaintenance cost reduction rateUnexpected failure repair costMaintenance feesReduction in spares inventoryMaintenance cost rateB.7 Other maintenance indicators1 Element2 Elements3 Elements4 ElementsAll 5 ElementsElements:Contact maintenance rate – extent due to lack of technology and skillsContact maintenance rate – extent needed to absorb capacity (labor) shortagesRenovation rateIn house developmentFailure straight through rateB.8 Health/Safety Environment1 Element2 Elements3 Elements4 ElementsAll 5 ElementsEvery plant appoints managers and supervisors to be responsible for health, safety and environmental matters.  Develop countermeasures to prevent past accidents and disasters from recurring analyze the reasons for near misses and establish safety measures.Elements:Accident frequencyAccident severity rateNumber of accidents requiring time off workNumber of plant accidentsNumber of continuously accident free daysNumber of near misses detectedNumber of safety problems spotted by safety teamNumber of improvements made on unsafe itemsWork place noise levelsNumber of external complaints (noise, dust, odors, etc)Number of discharges to outside (waste, oil, sludge, etc)B.9 Training and Morale1 Element2 Elements3 Elements4 ElementsAll 5 ElementsThrough training and hands on practice, TPM aims to revolutionize the workforce and develop highly skilled, motivated and self-reliant people who know their equipment and processes intimatelyElements:Number of meetings or time spent on SGANumber of focused improvement topics documentedCost savings due to focused improvementsNumber of improvement suggestionsNumber of outside company presentationsNumber of single point lesson sheetsNumber of maintenance traineesNumber of official qualifications earned for both mechanics and technicians.B.10 Promotion Goals1-2 Element3-4 Elements4-6 Elements7-9 ElementsAll 10 ElementsEvaluating TPM involves assessing whether the company has achieved the policy and goals set at the introduction of TPM and realized the intended benefits.  It also involves judging how effectively priority topics, action items and quantitative targets have been pursued through improvement activitiesElements:Cost reduction compared with fiscal year (FY)Variable production cost compared with FY.Fixed production cost compared with FY.Labor productivity compared with FY. Number of major failures per periodNumber of failures monthly rates end of periodNumber of quality problems, claims per year.Number of accidents per yearNumber of accidents per year requiring time offNumber of accidents per year with no time off<br />TPM DiagnosticPage 3 of 3B. TPM  Metrics Traditional1234TPM5B.11 Autonomous Maintenance No visible signs of cleaning, inspection or lube routes presentMachine contamination apparent.5S Level < 1.9No small group activities5S Level > 2.0Equipment history is reviewed.Minimum visual management is present on assetSmall group activity meeting are held on emergency basis onlyManagement walkthrough checklist completed monthly5S Level> 3.0TPM information currentSmall group activity meetings taking place5S Level > 4.0Equipment is benefiting from root cause analysisPhysical evidence of Cleaning is Inspection on asset.Consumables are identified and stocked5S Level = 5.0Small group activities are self- directed. Equipment availability data is posted showing positive trend.Visual management is present.All steps of AM are being auditedB.12 Overall Equipment EffectivenessOEE means “the amount of productive service that equipment provides.”  OEE identifies pieces of equipment that present opportunities for improvement.Less than 10% of assets utilize OEE dataLess than 20% of assets utilize OEE dataLess than 40% of assets utilize OEE dataLess than 60% of assets utilize OEE dataLess than 80% of assets utilize OEE data<br />TPM Diagnostic4/15/2010 Rev BC. TPM PILLARSTraditional1234TPM5C.1 Planned MaintenanceVision – Equipment/process is operating such that zero breakdowns occur during production, and equipment/processes are available when required by the customer.C.1.1 Supplier/ Stores Management IntegrationVision – Supplier Management, Maintenance and Manufacturing personnel function as one cohesive team. In order to accomplish this, parts & materials from certified suppliers deliver directly to the point of use with minimal appropriate receiving inspection both in Operations and Maintenance.C.1.1.1  Source Inspection  DelegationMotors, oil, electrical components, etc.Delegation program not established. Static  Supplier base.Process established for delegation; 25% of suppliers approved.50% of suppliers have delegation authority.  Supplier base reduction underway.75% of suppliers have delegation authority.90% or > of suppliers have delegation authority.  Minimal supplier base.C.1.1.2 Supplier Management ResponsibilityMaterial resource buyers co-located with customers.Supplier Management is separate from Manufacturing.Supplier Management is coordinating with Manufacturing.Continuous & direct (face to face) communication between organizations.Supplier Management & Manufacturing view supplier management as joint responsibility.Shop floor personnel coordinate directly with suppliers for delivery. S/M&P manages the contract.C.1.1.3 JIT DeliveriesC.1.1.3.1 Raw Material Sheet stock, paint, wood, etc.No JIT contracts.JIT delivery on a minimum of 25% of raw materials.JIT delivery on a minimum of 50% of raw materials.JIT delivery on a minimum of 75% of raw materials.JIT delivery on >90% of raw materials.C.1.1.3.2  Detail PartsSpindles, power wire boards, light fixtures, etc.No JIT contracts.JIT delivery on a minimum of 25% of detail parts.JIT delivery on a minimum of 50% of detail parts.JIT delivery on a minimum of 75% of detail parts.JIT delivery on >90% of detail parts.C.1.1.3.3 Assemblies  Motors, gear box, boilers, high value components.No JIT contracts.JIT delivery on a minimum of 25% of assemblies.JIT delivery on a minimum of 50% of assemblies.JIT delivery on a minimum of 75% of assemblies.JIT delivery on 90% + of assemblies.C.1.1.3.4   Stores/Supplier “kitted” assemblies.No JIT contracts JIT delivery on a minimum of 25% of supplier kits.JIT delivery on a minimum of 50% of supplier kits.JIT delivery on a minimum of 75% of supplier kits.JIT delivery on 90% + of supplier kits.C.1.1.4  Inventory System Integration   Vision - Deliveries are based upon the shop floor need & delivered just prior to the need.C.1.1.4.1  Inventory System Integration With SupplierNo integration with supplier’s system.Developing some integration with supplier’s systems.Established EDI with some key suppliers as pilot.Most major suppliers are transmitted data via EDI.All major suppliers have EDI . All supplier problems are addressed prior to the next delivery.Page 1 of 4TPM DiagnosticPage 2 of 4C.1 Planned MaintenanceTraditional1234TPM5C.1.1.4.2  Internal Pull SystemAll deliveries are based on negotiated delivery schedule. Most deliveries are based on smaller sized lots. Kitting of parts to floor from stockrooms.Deliveries are based upon minimal inventory pads to the original need dates. Kits are delivered in logical work sizes.Kitting of parts by suppliers.Deliveries are based upon the shop floor need and delivered just prior to need. No large lot deliveries.C.1.1.4.3  Inventory TurnsNot measured.1 element.2 elements.3 elements.4 elements.Elements:1 . Measured at facility level3. Continuous improvement 2.  Measured at cell level 4. Benchmark data is used frequently over past 24 monthsC.1.1.5  Point of Use Stocking By External Suppliers C.1.1.5.1  Low value parts (standards & small details).100% traditional stocking.Point of use stocking negotiated with suppliers or implemented in pilot areas (under 20% of areas).Point of use stocking in 21% - 49% of areas.Point of use stocking in 50% - 89% of areas.Point of use stocking fully utilized.  Over 90% of areas.C.1.1.5.2 Mid-Value detail and assemblies100% traditional stocking.Point of use stocking negotiated with suppliers or implemented in pilot areas (under 20% of areas)Point of use stocking in 21% - 49% of areas.Point of use stocking in 50% - 89% of areas.Point of use stocking fully utilized.  Over 90% of areas.C.1.1.5.3  High Value Parts100% traditional stocking.Point of use stocking negotiated with suppliers or implemented in pilot areas (under 20% of areas)Point of use stocking in 21% - 49% of areas.Point of use stocking in 50% - 89% of areas.Point of use stocking fully utilized.  Over 90% of areas.C.1.1.5.4  Stores/Supplier “kitted” assemblies.100% traditional stocking.Point of use stocking negotiated with suppliers or implemented in pilot areas (under 20% of areas)Point of use stocking in 21% - 49% of areas.Point of use stocking in 50% - 89% of areas.Point of use stocking fully utilized.  Over 90% of areas.C.1.2  Maintenance & Production SchedulesVision – The scheduling system is horizontally integrated across the site.  Visual signals have been set up and utilized to drive the next need.C.1.2.1  Capacity Planning integrated with Maintenance SchedulesCapacity planning process not documented or considered when scheduling planned maintenance.Capacity is analyzed after maintenance order release. Final work scheduling made after order launched. Capacity is taken into account prior to  launching maintenance orders into the maintenance product team. User friendly capacity system accessible to all teams. Factory is level loaded and producing to customer demand. Planned maintenance products are treated the same as operations products for scheduling.TPM DiagnosticPage 3 of 4C.1 Planned MaintenanceTraditional1234TPM5C.1.2.2  Maintenance Work OrderMaterial & tooling position is unknown at time of release.Material & tooling position is unknown at time of release, but analyzed after release.Material & tooling are forecast and analyzed prior to order release.Orders are not released until all materials & tools are available.Orders not released until all materials, tools  & machines are available.C.1.2.3  Maintenance Activity/Cycle Time & Shop Floor ReductionNo formal plan for cycle time reduction.Formal plan exists. <24% progress to meeting objective.25-49% progress toward meeting  goal.50-74% progress toward meeting goal.75% or better % progress toward meeting goal.C.1.2.4  Parts Management - Impact of ShortagesManages the shop by shortages. 75%-100% of orders are expedited. A number of “Priority” lists exist.Critical shortage list is the priority list.  50% - 74% of orders are expedited.Shortage position known by all. Orders are accurately tracked. (system & manual lists)Focus on accurately forecasting needs via dispatch list.  No manual lists.Shortages are dealt with as an exception and system speeds up to accommodate requirements.C.1.3 QualityAny good or service provided to a downstream customer; i.e. painted room, installed machine, oil analyzed, completed work order, parts received,, etcC.1.3.1 Standardization of JobJob requirements have been standardized and simplified.  Qualified workers can produce product with little or no training.No plans in place to accomplish this.Written  plan developed and implementation is at less that 30%.30-49% of the jobs have been standardized and simplified.50-89% of the jobs have been standardized and simplified.90% or more of the jobs have been standardized and simplified.C.1.3.2  Advanced Maintenance Moving from reactive to proactive maintenance. <30% planned work.Moving from reactive to proactive maintenance. 30-50% planned work.Critical assets facilitized.Providing education and training on a pull basis.Moving from reactive to proactive maintenance. 50-80% planned work.Work planned and schedule using visual management tools.Facilities stores organized and support kitting for planned work.Moving from reactive to proactive maintenance. >80% planned work.Work planned and schedule using visual management tools.Root cause analysis and Maintenance prevention are systemic within enterprise.CBM implementedC.1.3.3  Set-up Reduction Development of a set-up reduction policy focusing on reducing non-value added time, motion and manpower while maintaining or decreasing variability in all aspects of maintenance. No plan in place to reduce set-up times.Written plan developed. Metrics displayed at the cell level with goals and performance to goals visible.Less than 50% of the teams are achieving set-up time reductions.50-89% of the teams are achieving set-up time reductions.90% or more of the teams are achieving set-up time reductions.<br />TPM DiagnosticPage 4 of 4C.1 Planned MaintenanceTraditional1234TPM5C.1.3.4  Process and Product Variation Reduction System Process and product Variation Reduction System is in place and applied effectively to a prioritized set of high cost/high waste problem areas.    No Variation Reduction System in placeVariation Reduction tools are applied sporadically, with minimal lasting gainsVariation Reduction  tools and activities are executed in a planned and effective manner, but are not yet widespread. Variation Reduction activities are executed in a planned and effective manner and are widespreadVariation Reduction activities are a way of doing daily business and their effectiveness is reflected in steady improvement in the supplier’s metric(s) for  Waste/Defects.C.1.3.5 Maintenance Quality SystemDeficient ProceduresAdequate procedures, check sheets exist for all procedures.Internal audit and corrective action process effectively resolves deficiencies.No deficiencies are identified by the internal audit.The internal audit includes their supporting business systems.C.1.3.6  Intolerance for DefectsSystems and Processes are in place.  Use of mistake proofing and AQS tools/data driven processes and systems.No system or process is in place.The system of in-process checks allows > 10% of internal defects to be passed on.The system of in-process checks allows 3 - 10% of internal defects to be passed on.The system of in-process checks allows 1 - 2% of internal defects to be passed on.The system of in-process checks allows < 1% of internal defects to be passed on.<br />TPM Diagnostic4/15/2010 Rev BC. TPM  PILLARSTraditional1234TPM5C.2 Autonomous  MaintenanceVision – Employee empowerment and team approaches are used for problem solving on the manufacturing floor.  Decision–making is pushed to the lowest appropriate level and managers are viewed as coaches and facilitators.C.2.1 Small Group Activity (SGA) TeamsC.2.1.1 SGA Teams –Factory and Maintenance work force labor organized according to respective product line.No written plan.  Teams may exist but have no self-direction authority.Written plan initiated. <10% of business organized by product line.10-49% of business organized by product line.50-89% of business organized by product line.90% or more of business organized by product line.C.2.1.2 Teams—Support PersonnelSupport people are part of Maintenance Product Teams and are accountable to the Product Organization.No written plan. Large centralized core support organization.Plan drawn up but no substantive implementation (<10%)10-49% of support function are part of Product Organization50-89% of support functions are part of Product Organization90% or more of support functions are part of Product Organization.C.2.1.3 Teams – External Customer/supplier Integration Maintenance Product Teams exercise “tactical” coordination with maintenance suppliers and contracted work, working planning, scheduling and quality issues.Not part of written team plan.Tactical supplier management in some Product Organizations (<10%)Tactical supplier management in some Product Organizations (10-49%)Tactical supplier management in some Product Organizations (50-89%)Tactical supplier management in most Product Organizations (90-100%)C.2.1.4 Empowerment of Teams0 Elements or No Plan1-4 Elements5-8 Elements9-12 Elements13-15 ElementsEmployee empowerment and team approaches are used for problem solving leading to significant productivity improvements and culture changes.Elements:Goal settingWork scheduleJob assignmentCell configurationTrainingMeetingsJob standardizationMeaningful input for new team member selectionLeader/Manager EvaluationPeer evaluation (job skills0Personnel requirements/manpowerRewardsProduct area budgeting/record keepingTactical supplier integrationContinuous product and process analysis and improvementsC.2.1.5 Multi-Skilled LaborMeasuring the ability of workers to perform a broad range of maintenance activities in support of their customer (respecting union negotiated contracts).Maintenance and Operators are not trained to care for different machines in their work area.25-49% of all Maintenance and Operators are trained.50-74% of all Maintenance and Operators are trained.75-89% of all Maintenance and Operators are trained.Over 90% of all Maintenance and Operators are trained to care for different machines in their work areas.<br />Page 1 of 4<br />TPM DiagnosticPage 2 of 4C.2 Autonomous MaintenanceTraditional1234TPM5C.2.1.6 Training1.46% or less of payroll for training OR0 elements or no plan.>1.46<1.90% of payroll for training OR2-3 elements.>1.9<2.35% of payroll for training OR4-5 elements.>2.35<3.14% of payroll for training OR6-7 elements>3.14<3.93% of payroll for training ORMore than 7 elementsTraining is provided to facilitate effective teaming, communication skills, and continuous improvement methods.REF: The ranking criteria is derived from the American Society for Training Development’s 1998 State of the Industry Report.Elements:Goal settingWork scheduleJob assignmentCell configurationTrainingMeetingsJob standardizationMeaningful input for new team member selectionLeader/Manager EvaluationPeer evaluation (job skills0Personnel requirements/manpowerRewardsCell budgeting/record keepingTactical supplier integrationContinuous product and process analysis and improvementsC.2.2  Small Group Activity (SGA) DeliverablesC.2.2.1 Autonomous Maintenance Team0 elements or no plan.1-2 elements.3-4 elements.5-6 elementsMore than 6 elementsElements:Individual Operators and Maintenance craft personnel take ownership in the reliability and effectiveness of their assigned asset.Roles and responsibilities are known Daily communication between AM team members is occurringWeekly AM meetings are conductedAM team is stable (i.e. long term assignment)Team members have skills & knowledge to participate in AMAM Team empoweredC.2.2.2 Environment0 elements or no plan.1-3 elements.4-5 elements.6-7 elementsMore than 7 elementsElements:Continuous follow up by Operations/Maintenance managementLockout-Tag-Tryout process is documented and usedEfficient use of energy resources is planned & implementedEfficient use of production resources is planned & implementedImprovement activities driven by facts & dataContinuous improvement is evidentUnexpected breakdowns are eliminatedThe work environment is safe Measures in placeC.2.2.3 Asset Maintenance 0 elements or no plan.1--4 elements.4-8 elements.9-13 elementsMore than 14 elementsElements:Asset is inspected using agreed upon routines and timetableChronic sources of contamination are eliminatedAsset is cleaned using agreed upon routines and timetablesPM routines, based on usage developed and followed Planned Maintenance schedules known, displayed and followedAutonomous Maintenance is a trigger for PM, PdM, and PJ activitiesOEE data is used to focus improvementsSpares are forecast and consumption rates trackedNon-labor resources availablePdM routines developed and followedLubrication routines developed and followedAll lube points are identifiedHard to reach places are eliminatedNo contamination at assetHigh usage parts at asset<br />TPM DiagnosticPage 3 of 4C.2 Autonomous MaintenanceTraditional1234TPM5C.2.3  Continuous Process Improvement (CPI) – Production and Maintenance Organization LevelC.2.3.1 Training for CPIMethods of problem solving, rootcause analysis, continuous improvement are understood and utilized by Team members.Methods of problem solving , root cause analysis, and continuous improvement are understood or utilized by <10% of Team members.10-24% of Team/Cell members25-49% of Team/Cell members50-89% of Team/Cell members90%+ of Team/Cell membersC.2.3.2 Data AvailabilityTeams use real-time data to assess Maintenance and Operations Product Teams performance, including total cost attributable to team, and assess CPI efforts.Data needed by SGA  teams to evaluate their performance has been identified.3 or less elementsData is visible to SGA teams.  SGA   teams makes input to data.At least 4 elementsData is visible in real time format to SGA teams.  SGA   teams understand data and it’s source.At least 5 elementsData includes a production efficiency measure.At least 6 elementsData is available to CPI teams including total cost attributable to each cell operations.At least 8 elements Elements:Production EfficiencyInventory LevelsSet-up Times (per part)Takt TimePerformance TargetsCycle Time (throughput)Performance StatusCostInventory TurnsNon-Value Added/Value added ratio QualityEquipment FailuresSet Up and AdjustmentIdling and Minor StoppagesQuality Defects and ReworkStart up/Yield lossesSpeed LossesC.2.3.3 Process ManagementProcesses are documented and managed using value stream mapping techniques.Techniques not used or understood.Higher level processes documented and metrics in place (defect rates, waste, CPK, etc.)Lower level processes identified and documented.Improvement plans initiated on all processes not performing to goal.Processes at all levels are being continually improved, based on a structured plan with a clear understanding of benefits.C.2.3.4 CPI Project ActivityAssigned CPI project members spend a measurable amount of time actively involved with Continuous Process Improvement.No time spent on CPI projects.SGA Teams involved with only CPI projects concerning corrective action for quality issues.SGA Teams spend 10% or more of their time on process CPI issues.SGA Teams spends 15% or more of their time on process CPI issues.SGA Teams spends 20% or more of their time on process CPI projects.C.2.3.5 Maintenance and Operations Product Level – Customer/Supplier InvolvementExternal suppliers and customers are integrated into CPI activity.Limited supplier/customer involvement.Supplier/customer participation exceeds 10%Supplier/customer participation exceeds 30%Supplier/customer participation exceeds  40%Supplier/customer participation exceeds  50%<br />TPM DiagnosticPage 4 of 4C.2 Autonomous MaintenanceTraditional1234TPM5C.2.4 Continuous Process Improvement (CPI) – Factory WideC.2.4.1 Training for Management and Core Support PersonnelMethods of problem solving, root cause analysis, continuous improvement are understood and utilized by CPI project members.Methods of problem solving, root cause analysis, and continuous improvement are understood or utilized by <10% of management and support personnel.10-24% of Management and Support Personnel25-49% of Management and Support Personnel50-89% of Management and Support Personnel90%+ of Management and Support PersonnelC.2.4.2 CPI Project SelectionManagement’s role is to assure execution of projects having the greatest impact on the enterprise goals and bottom line.No systematic approach to identify or prioritize projects has been developedA traditional (rejection based) systematic approach has been developed and implemented.A systematic approach utilizing Lean/AQS Manufacturing Practices and Principles has been developed and implemented.Level 3 and CPI projects are selected with participation of cell level teams.Level 4 and after CPI project implementation, results are analyzed and check for desired outcome.C.2.4.3 CPI Projects ActivitySupport personnel assigned to CPI projects having the greatest impact on the enterprise goals and bottom line.Less than 10% of support personnel time.At least 10% of support personnel timeAt least 20% of support personnel timeAt least 30% of support personnel timeAt least 40% of support personnel timeC.2.4.4 Autonomous MaintenanceAutonomous Maintenance is an Operations owned process in which they accept the responsibility for and perform specific daily maintenance activities/checks/inspections/etc.   Facilities role in the this process is to participate in the Autonomous Maintenance Workshops help in the decision making process that determine which duties should be part of the operator’s responsibilities and be a full time member of the sustaining AM team.No systematic approach to identify or prioritize Autonomous Maintenance has been developed.Development of Master Plan is focused on critical assets.AM SGA assumes ownership of reliability and efficiency of their asset.AM SGA are deployed in all areas of productionAM SGA are self sustaining, take ownership and responsibility for their asset(s), and initiate factory improvements based upon facts and data.<br />TPM Diagnostic4/15/2010 Rev BC. TPM PILLARSTraditional1234TPM5C.3 Attack the Six Big LossesVision – Overall equipment effectiveness is an internationally accepted measure for focusing improvement activities.  OEE measures Availability, Performance Efficiency, and quality.C.3.1 ApplicationEducation and training is provided on a pull basis. SGA team activity supports implementation of Lean concepts.SGA teams in early implementation areas meet regularly and continuously attack the ‘Six Big Losses’.OEE > 50% on all critical assets.SGA team focuses on continuous reduction of production losses based on facts and data OEE >70% on all critical production assets.The SGA team has ownership in the reliability and effectiveness of their assigned assetsOEE >85% on all critical production assets.Continuous improvement of production efficiency is driven by SGA team stakeholdersC.3.2 Speed losses Equipment specifications not well understoodNo speed standards (by product and machinery)Wide speed variations across shifts/operatorsProblems related to speed losses analyzed: mechanical problems, quality problems.Tentative speed standards set and maintained by productNecessary improvements being implementedSpeed is set by the product. Cause and effect relationship between the problem and the precision of the equipmentSmall speed lossesOperation speed increased to design speed or beyond through equipment improvements.Final speed standards set and maintained by product.Zero speed lossesC.3.3 Idling and Minor Stoppage LossesLosses from minor stoppages unrecognized and unrecorded.Unstable operating conditions due to fluctuation in frequency and location of losses.Minor stoppage losses analyzed quantitatively by: frequency and location of occurrence; volume lost.Losses categorized and analyzed; preventive measures taken on trial and error basis.All causes of minor stoppages analyzed; all solutions implemented.Operation speed increased to design speed or beyond through equipment improvements.Final speed standards set and maintained by product.Zero minor stoppages (unmanned operation possible)C.3.4 Quality Defect and Rework LossesChronic quality defect problems are neglectedMany reactive and unsuccessful remedial actions have been takenChronic quality problems quantified by: details of defect, frequency; volume lost.Losses categorized and reasons explained: preventive measures taken on trial and error basis.Causes of chronic quality defect analyzed, solutions implemented,Automatic in-process detection of defects under study.Quality  losses from 0.1% to zero<br />Page 1 of 2 <br />TPM DiagnosticPage 2 of 2C.3. Attack the Six big lossesTraditional1234TPM5C.3.5 Startup LossesStartup losses not recognized, understood or recordedStartup losses understood in terms of breakdowns and changeoversStart up losses measured.Process stabilization dynamics understood and improvements implementedCauses due to minor stops aligned with startup lossesRemedial actions on breakdowns, setups, minor stops and idling minimize startup losses.Startup losses minimized through process controlC.3.6 Breakdown LossesCombination of sporadic and chronic breakdownsSignificant breakdown lossesBM>PMNo operator asset careUnstable life spanEquipment weaknesses not recognizedChronic breakdownsBreakdown losses still significantBM=PMOperator asset care implementedParts life spans estimatedEquipment weaknesses well acknowledgedMaintainability improvement applied on above points.Time based maintenance establishedPM>BMBreakdown losses less than 1%Autonomous maintenance activities well establishedParts life spans lengthenedDesigners and engineers involved in higher level improvements.Condition-based maintenancePMAutonomous maintenance activities stable and refinedParts life spans predictedReliable and maintainable design developedBreakdown losses from 0.1% to zeroC.3.7 Setup and Adjustment LossesNo control: minimum involvement by operatorsWork procedures disorganized: setup and adjustment time varies widely and randomlyWork procedures organized, e.g. internal and external setup distinguishedSetup and adjustment time still unstableProblems to be improved are identified.Internal setup operations moved into external setup timeAdjustment mechanisms identified and well understoodError proofing introduced.Setup time less than 10 minutesImmediate product changeover by eliminating adjustment <br />BM  = Breakdown Maintenance<br />PM  = Preventive Maintenance<br />TPM DiagnosticC. TPM PILLARSTraditional1234TPM5C.4 Early Equipment DesignVision – Equipment must be flexible to respond to abrupt changes in market demand as well as be specialized to help the company remain competitive.  The following five conditions must be examined before acquisition of any asset.C.4.1 Early Equipment ManagementFocus on production capabilities in a Lean environment. New assets meet production needs and minimize life cycle costs.Education and training is provided on a pull basis.Ensure maintainability and MTTR/MTBF.Ensure assets minimize life cycle costs while meeting the needs of operationsAssets support a Lean flexible production environment. Production parts are designed with the manufacturing process in mind.Production assets are designed, built, or modified in-house.C.4.2 Development1-3 Elements4-6 Elements7-9 Elements10-12 Elements13 ElementsCombination of product development and development of equipment with related fabrication methods to produce high quality products at low cost.Design for quality adherenceEconomic life cycle costFlexibilityLow cost autonomationIntrinsic safetyElements:Product plan (cost plan)Product development and designPrototype testingProcess planningProcess qualityCost settingEvaluate fabrication methodsEliminate technical issues Set equipment specificationsEvaluate equipmentDebug equipment designTest run initial operation on equipmentDocument regular operation and maintenanceC.4.3 Reliability0 Element1-2 Elements3-4 Elements5 Elements6 ElementsEquipment must produce defect free parts and be easily maintainable.Elements:Mistake proof designFail safe designNon mechanical designDe-rating the designIndependent overlapping system designRedundant designC.4.4 Economics1-2 Elements2-3 Elements4-5 Elements6-7 Elements8 ElementsEquipment must be inexpensive not only in terms of initial cost but also in terms of its running costs; therefore, the team’s objective is to develop and design equipment with the lowest possible life cycle cost.Elements:Acquisition costs (planning, design and development construction)Product distribution cost (packaging, transportation, handling, warehousing and storage).Maintenance cost (customer service organization intermediate, plant maintenance and personnel costs)Inventory cost (spares and material support)Retirement and disposal costsTraining and technical data costOperations cost (facilities energy, utilities, taxes)Tools and test equipment costs<br />Page 1 of 2<br />TPM DiagnosticPage 2 of 2C. TPM PILLARSTraditional1234TPM5C.4.5 Availability1-2 Elements3-5 Elements6-9 Elements10-12 Elements13 ElementsImproving production and manufacturing techniques for equipment to produce to takt time.Elements: AutomationMechanizationAccelerationLinked automationAutomated material handlingRobotics.Product analysesProcess analysesOperation analysesProcess designFMEALayoutFactory wide participationC.4.6 Maintainability1Elements2 Elements3 Elements4 Elements5 ElementsEasy to maintain with zero breakdownsElements: Development of autonomous maintenance stepsBreakdown reduction measures, MQ organization, preventive maintenance management.Reduce chronic in-process defects and comprehensive quality assurance-related activities.Pre-production improvements in new products, QA-friendly design development.Education and training in maintenance skills, quality control, etc.C.4.7 Operability1 Element2 Elements3-4 Elements5-6 Elements7 ElementsEasy to operate with zero breakdownsElements: Are frequent adjustments required?Are handle or knobs difficult to operate or located poorly?Are any specialized skills or tools required for operation/adjustment?Are blockages/stoppages likely?Has any diagnostic function built in? (glass panels, gauges, indicators)Startups and shutdowns: is additional manning required?Are the operator’s working posture unhealthy?<br />TPM Diagnostic4/15/2010 Rev BC.5 Training & EducationTraditional1234TPM5Vision – Training is a key element in the success of TPM and is an integral part of producing a highly motivated and multi-skilled workforce.C.5.1 TPM Education 1-2 Elements3-5 Elements6-9 Elements10-13 Elements14-16 ElementsA training curriculum is in place with all aspects of TPM knowledge and problem solving skills. Required skills and knowledge for specific job assignments are known.  Skills, knowledge and capability of individuals are known with respect to their job assignments.Elements:Understands the importance of lubrication.Understands the importance of cleaning is inspection Understands the importance of eliminating contamination.Knows the criteria for recognizing abnormalities and understands the causes.Can diagnose failures to a certain extentUnderstands the relationship between equipment and product quality characteristics and asks the 5 Why’s.Understand the causes of defects.Understands how to replenish consumables.Has basic knowledge of life cycle of machine components.Understands basic failure causes. Some personnel have specialized training as facilitators for SGAKnows how to collect data for Maintenance and OEE.SGA are taking place and personal are constructively analyzing informationCan analyze and correctly assess whether equipment is operating normally or not and when to shut it downSGA = Small Group ActivityC.5.2 Operator Training 1-2 Elements3-4 Elements5-8 Elements9-11 Elements12-14 ElementsElements:Operator understands equipment construction.Assist in equipment overhauls Operator can perform cleaning is inspection correctly.Operators have basic education and knowledge of the operation and maintenance of the assetOperator has the ability to lube own asset.Operator understands the importance of eliminating contamination.Knows the criteria for recognizing abnormalities and defects understands the causes.Operator can judge that the equipment is operating correctly and when to shut down.Has basic knowledge of life cycle of machine components.Understands basic failure causesAssist in equipment overhaulsWork with SGA to improve equipment and component reliability, lengthen equipment life times, and curb abnormalities and failures.Understands basic CBM equipment diagnostics.Improves the understanding of their asset and shares it with other personnel.<br />Page 1 of 2<br />TPM DiagnosticPage 2 of 2C.5 Training & EducationTraditional1234TPM5C.5.3 Maintenance Training 1-2 Elements3-6 Elements7-10 Elements11-14 Elements15-17 ElementsElements:Understands the importance of eliminating contamination.Can judge correctly when to shut down the equipmentCan diagnose failures.Understands the relationship between equipment and product quality characteristics.Understands the causes of defects.Understands the restocking and kitting of spare parts and consumables.Has basic knowledge of life cycle of machine components.Understands basic failure causesPerforms equipment overhaulsUnderstands equipment construction.Knows the criteria for recognizing abnormalities and understands the causes to restore normal operations.Maintenance has basic and advanced knowledge of the operation and maintenance of assets in their care.Can collect data for maintenance and OEE.Maintenance personnel are trained in advanced maintenance processes, CBM, and techniques are being utilized in daily maintenance and standardized.Maintenance professionals must be able to instruct operators in correct handling, operating and daily maintenance of equipment.Work with SGA to improve equipment and component reliability, lengthen equipment life cycle times, and curb abnormalities and failures.Improves the understanding of their asset and shares it with other personnel.<br />
TPM Diagnostic Metrics and Organization

Mais conteúdo relacionado

Mais procurados

Mais procurados (18)

Total productive maintenance (tpm)
Total productive maintenance (tpm)Total productive maintenance (tpm)
Total productive maintenance (tpm)
 
Tpm
TpmTpm
Tpm
 
TPM - tech talk
TPM - tech talk TPM - tech talk
TPM - tech talk
 
Indonesia texbook
Indonesia texbookIndonesia texbook
Indonesia texbook
 
What is total productive maintenance?
What is total productive maintenance?What is total productive maintenance?
What is total productive maintenance?
 
Total Productive Management
Total Productive ManagementTotal Productive Management
Total Productive Management
 
TPM For lean manufacturing chp 2 | concept of production efficiency | lea...
TPM For lean manufacturing   chp 2 |  concept of production efficiency |  lea...TPM For lean manufacturing   chp 2 |  concept of production efficiency |  lea...
TPM For lean manufacturing chp 2 | concept of production efficiency | lea...
 
Tpm final
Tpm finalTpm final
Tpm final
 
Tpm training
Tpm trainingTpm training
Tpm training
 
Tpm total productive maintenance
Tpm  total productive maintenanceTpm  total productive maintenance
Tpm total productive maintenance
 
TO IMPEOVE THE PERFOMANCE OF THE PLANT USING OEE
TO IMPEOVE THE PERFOMANCE OF THE PLANT USING OEETO IMPEOVE THE PERFOMANCE OF THE PLANT USING OEE
TO IMPEOVE THE PERFOMANCE OF THE PLANT USING OEE
 
Total Productive Maintenance
Total Productive MaintenanceTotal Productive Maintenance
Total Productive Maintenance
 
Tpm principles and concepts
Tpm principles and conceptsTpm principles and concepts
Tpm principles and concepts
 
Tpm performance measure
Tpm performance measureTpm performance measure
Tpm performance measure
 
Tpm
TpmTpm
Tpm
 
Overall Equipment Effectiveness
Overall Equipment EffectivenessOverall Equipment Effectiveness
Overall Equipment Effectiveness
 
Tpm basic
Tpm basicTpm basic
Tpm basic
 
010 bmw tpm management training
010 bmw tpm management training010 bmw tpm management training
010 bmw tpm management training
 

Destaque

Seminar 1 - MUR Information Night
Seminar 1 - MUR Information NightSeminar 1 - MUR Information Night
Seminar 1 - MUR Information NightSam Briggs
 
DFM - Intership Evaluation Form
DFM - Intership Evaluation FormDFM - Intership Evaluation Form
DFM - Intership Evaluation FormTri Pham Huynh
 
TPM Total Productive Maintenance for Quarry Plant(2)
TPM Total Productive Maintenance for Quarry Plant(2) TPM Total Productive Maintenance for Quarry Plant(2)
TPM Total Productive Maintenance for Quarry Plant(2) Timothy Wooi
 
DFM Design Principles
DFM Design PrinciplesDFM Design Principles
DFM Design PrinciplesNIELITA
 
Design for Manufacturing and Assembly
Design for Manufacturing and AssemblyDesign for Manufacturing and Assembly
Design for Manufacturing and Assemblyelai1001
 
Design for Assembly (DFA)
Design for Assembly (DFA)Design for Assembly (DFA)
Design for Assembly (DFA)Richard Farr
 

Destaque (8)

Seminar 1 - MUR Information Night
Seminar 1 - MUR Information NightSeminar 1 - MUR Information Night
Seminar 1 - MUR Information Night
 
DFM - Intership Evaluation Form
DFM - Intership Evaluation FormDFM - Intership Evaluation Form
DFM - Intership Evaluation Form
 
TPM Total Productive Maintenance for Quarry Plant(2)
TPM Total Productive Maintenance for Quarry Plant(2) TPM Total Productive Maintenance for Quarry Plant(2)
TPM Total Productive Maintenance for Quarry Plant(2)
 
DFM Design Principles
DFM Design PrinciplesDFM Design Principles
DFM Design Principles
 
Design for Manufacturing and Assembly
Design for Manufacturing and AssemblyDesign for Manufacturing and Assembly
Design for Manufacturing and Assembly
 
Design for Assembly (DFA)
Design for Assembly (DFA)Design for Assembly (DFA)
Design for Assembly (DFA)
 
DFMA design for manufacturing and assembly
DFMA design for manufacturing and assembly DFMA design for manufacturing and assembly
DFMA design for manufacturing and assembly
 
Textile calculations
Textile calculationsTextile calculations
Textile calculations
 

Semelhante a TPM Diagnostic Metrics and Organization

Ranveer yadav 2013 14
Ranveer yadav 2013 14Ranveer yadav 2013 14
Ranveer yadav 2013 14ranviry49
 
TPM - Total Productive Maintenance
TPM - Total Productive MaintenanceTPM - Total Productive Maintenance
TPM - Total Productive MaintenanceRAHMAT EIE
 
IRJET - Implementation of TPM Philosophy on Critical Paint Shop Machine
IRJET - Implementation of TPM Philosophy on Critical Paint Shop MachineIRJET - Implementation of TPM Philosophy on Critical Paint Shop Machine
IRJET - Implementation of TPM Philosophy on Critical Paint Shop MachineIRJET Journal
 
20141209_AM Pillar_Introduction
20141209_AM Pillar_Introduction20141209_AM Pillar_Introduction
20141209_AM Pillar_IntroductionHenrik Gantzel
 
Total Productive Maintenance (TPM).pdf
Total Productive Maintenance (TPM).pdfTotal Productive Maintenance (TPM).pdf
Total Productive Maintenance (TPM).pdfHimanshuGupta26467
 
TPM&amp;Kaizen(Junu)
TPM&amp;Kaizen(Junu)TPM&amp;Kaizen(Junu)
TPM&amp;Kaizen(Junu)pjunwoo365
 
The challenges facing in pharmaceutical maintenance
The challenges facing in pharmaceutical maintenanceThe challenges facing in pharmaceutical maintenance
The challenges facing in pharmaceutical maintenanceMANUEL PACINI
 
Presentation on Total Productive Maintenance
Presentation on Total Productive MaintenancePresentation on Total Productive Maintenance
Presentation on Total Productive MaintenanceMahendra K SHUKLA
 
E11 1 intro to operational-excellence_final-web
E11 1 intro to operational-excellence_final-webE11 1 intro to operational-excellence_final-web
E11 1 intro to operational-excellence_final-webDir Jan
 
Lean Manufacturing and Reliability Concepts report
Lean Manufacturing and Reliability Concepts reportLean Manufacturing and Reliability Concepts report
Lean Manufacturing and Reliability Concepts reportAndy Page
 
Presentation maintenence management
Presentation maintenence managementPresentation maintenence management
Presentation maintenence managementVaisakh S Babu
 

Semelhante a TPM Diagnostic Metrics and Organization (20)

Tpm by drh.
Tpm by drh.Tpm by drh.
Tpm by drh.
 
Ranveer yadav 2013 14
Ranveer yadav 2013 14Ranveer yadav 2013 14
Ranveer yadav 2013 14
 
tpm presentation
tpm presentationtpm presentation
tpm presentation
 
TPM - Total Productive Maintenance
TPM - Total Productive MaintenanceTPM - Total Productive Maintenance
TPM - Total Productive Maintenance
 
Tpm (group 8)
Tpm (group 8)Tpm (group 8)
Tpm (group 8)
 
Tpm preview
Tpm previewTpm preview
Tpm preview
 
IRJET - Implementation of TPM Philosophy on Critical Paint Shop Machine
IRJET - Implementation of TPM Philosophy on Critical Paint Shop MachineIRJET - Implementation of TPM Philosophy on Critical Paint Shop Machine
IRJET - Implementation of TPM Philosophy on Critical Paint Shop Machine
 
20141209_AM Pillar_Introduction
20141209_AM Pillar_Introduction20141209_AM Pillar_Introduction
20141209_AM Pillar_Introduction
 
TPM-PPT-4.pptx
TPM-PPT-4.pptxTPM-PPT-4.pptx
TPM-PPT-4.pptx
 
TPM Activity
TPM ActivityTPM Activity
TPM Activity
 
Total Productive Maintenance (TPM).pdf
Total Productive Maintenance (TPM).pdfTotal Productive Maintenance (TPM).pdf
Total Productive Maintenance (TPM).pdf
 
Total productive maintenance
Total productive maintenanceTotal productive maintenance
Total productive maintenance
 
TPM&amp;Kaizen(Junu)
TPM&amp;Kaizen(Junu)TPM&amp;Kaizen(Junu)
TPM&amp;Kaizen(Junu)
 
The challenges facing in pharmaceutical maintenance
The challenges facing in pharmaceutical maintenanceThe challenges facing in pharmaceutical maintenance
The challenges facing in pharmaceutical maintenance
 
What is Lean Maintenance
What is Lean MaintenanceWhat is Lean Maintenance
What is Lean Maintenance
 
Presentation on Total Productive Maintenance
Presentation on Total Productive MaintenancePresentation on Total Productive Maintenance
Presentation on Total Productive Maintenance
 
Lubrication Maturity Matrix
Lubrication Maturity MatrixLubrication Maturity Matrix
Lubrication Maturity Matrix
 
E11 1 intro to operational-excellence_final-web
E11 1 intro to operational-excellence_final-webE11 1 intro to operational-excellence_final-web
E11 1 intro to operational-excellence_final-web
 
Lean Manufacturing and Reliability Concepts report
Lean Manufacturing and Reliability Concepts reportLean Manufacturing and Reliability Concepts report
Lean Manufacturing and Reliability Concepts report
 
Presentation maintenence management
Presentation maintenence managementPresentation maintenence management
Presentation maintenence management
 

TPM Diagnostic Metrics and Organization

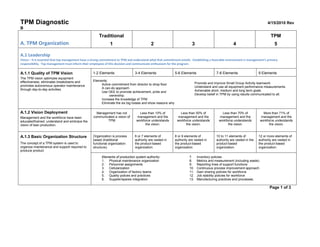
  • 1. TPM Diagnostic4/15/2010 Rev BA. TPM OrganizationTraditional1234TPM5A.1 LeadershipVision – It is essential that top management have a strong commitment to TPM and understand what that commitment entails. Establishing a favorable environment is management’s primary responsibility. Top management must inform their employees of this decision and communicate enthusiasm for the program.A.1.1 Quality of TPM Vision1-2 Elements3-4 Elements5-6 Elements7-8 Elements9 ElementsThe TPM vision optimizes equipment effectiveness, eliminates breakdowns and promotes autonomous operator maintenance through day-to-day activities.Elements:Active commitment from director to shop floorA can-do approachUse OEE to promote achievement, pride and ownership.Increase the knowledge of TPMEliminate the six big losses and show reasons whyPromote and improve Small Group Activity teamworkUnderstand and use all equipment performance measurements.Achievable short, medium and long term goalsDevelop belief in TPM by using results communicated to all.A.1.2 Vision DeploymentManagement and the workforce have been educated/trained, understand and embrace the vision of lean production.Management has not communicated a vision of TPMLess than 10% of management and the workforce understands the vision.Less than 50% of management and the workforce understands the vision.Less than 70% of management and the workforce understands the vision.More than 71% of management and the workforce understands the vision.A.1.3 Basic Organization StructureThe concept of a TPM system is used to organize maintenance and support required to produce product Organization is process based (traditional functional organization structure).6 or 7 elements of authority are vested in the product-based organization.8 or 9 elements of authority are vested in the product-based organization.10 to 11 elements of authority are vested in the product-based organization.12 or more elements of authority are vested in the product-based organization.Elements of production system authority:Physical maintenance organizationPersonnel assignmentsCellularizationOrganization of factory teamsQuality polices and practicesSupplier/spares integrationInventory policiesMetrics and measurement (including waste)Reporting lines of support functionsContinuous process improvement approachGain sharing policies for workforceJob stability policies for workforceManufacturing practices and processes.<br />Page 1 of 3<br />TPM DiagnosticPage 2 of 3A. TPM OrganizationTraditional1234TPM5A.2 TPM StructureVision – The physical organization and layout of the factory should support the concept of a “Lean “ factory organization. Production flow, status and problems should be readily apparent to the casual observer. Maintenance operations within cells have been optimized to minimize wasted time and effort.A.2.1 Factory OrganizationThe factory is ideally organized into cells by product. Maintenance may be based on group technology or parts family concepts.Less than 25% of factory organized product25-49% of factory50-74% of factory75-89% of factoryOver 90% of factoryA.2.2 Flow Between Product Cells and Maintenance AreasClear, visible workflow, and input and output for maintenance product cells.Less than 25% of factory has clear and well-defined input/output areas.25-49% of factory50-74% of factory75-89% of factoryOver 90% of factoryA.2.3 Internal Maintenance Cell Optimization1 Element3 Elements5 Elements7 Elements9 ElementsConcepts of cell optimization are used, understood and implemented in setting up maintenance areas.Elements:Minimized travelMinimized process stepsNecessary materials in placeNecessary tools in placeNecessary equipment in place Minimized inventory between processesClearly define input and outputMaterial, tools and equipment ergonomically arrangedCell organized for safetyA.2.4 Physical ResourcesThe cell business unit controls assets required to produce the product. (Laser alignment equipment, test equipment, etc).Less than 25% of assets required to produce the product are controlled within the cell or applicable business unit.25-49% of assets50-74% of assets75-89% of assetsOver 90% of assetsA.2.5 Production/Maintenance Status/CommunicationsA.2.5.1 External Communication of Production/Maintenance StatusProduction flow, status, and problems are apparent to the casual observer.Less than 25% of factory has clear production flow, status and problem visibility.25-49% of factory50-74% of factory75-89% of factoryOver 90% of factoryA.2.5.2 Internal Communication of Production/Maintenance StatusData for cell operations is available for all team members. Each cell and business unit has easily visible facilities for communications (meeting areas, boards, etc.).Less than 25% of factory has data availability and good facilities for communications.25-49% of factory50-74% of factory75-89% of factoryOver 90% of factory<br />A.2.6 5S’s The 5S methods are the key to a quality work environment. The underlying principle is a place for everything and everything in its place, clean and ready for use (Score using Levels of Excellence Sheet.) Instructions: Start at the bottom of each column and check the box(s) that reflect the maximum level achieved.SortSimplifySweepStandardizeSelf-disciplineLevel 5: Focus on PreventionEmployees are continually seeking improvement opportunitiesA dependable, documented method has been developed to provide continual evaluation, and a process is in place to implement improvements.Area employees use a dependable, documented method of preventative cleaning & maintenance.Everyone is continually seeking the elimination of waste with changed documented and information sharedThere is a general appearance of a confident understanding of and adherence to 5S principles.Level 4: Focus on ConsistencyA dependable, documented method is established to keep the work area free of unnecessary items.A dependable, documented method has been established to recognize in a visual sweep if items are out of place or exceed quantity limits.5S agreements are understood and practiced continually.Substantial process documentation is available and followed.Follow-through with 5S agreements and safety practices is evident.Level 3: Make it VisualUnnecessary items are removed from the workplaceDesignated locations are marked to make organization more visible.Work/break areas & machines are cleaned daily. Visual controls are established and well marked.Working environment changes are being documented. Visual control agreements for labeling and quantity levels established.5S agreements and safety practices have been developed and are utilizedLevel 2: Focus on BasicsNecessary and unnecessary items are separated.A designated location has been established for items.Work/break areas & machines are cleaned on a regular schedule. Key items to check are identified.Methods are improving, but changes haven’t been documentedA recognizable effort has been made to improve the condition of the workplace.Level 1: Focus on StartingNeeded and not needed items are mixed throughout the workplace.Items randomly located throughout the work place.Work place areas are dirty, disorganized and key items not marked or identifiedWork place methods are not consistently followed and are undocumented.Work place checks are randomly performed and there is no visual measurement of 5S performance.<br />Page 3 of 3<br />TPM Diagnostic4/15/2010 Rev BB. TPM Metrics Vision – What gets measured gets done.Traditional1234TPM5B.1 Management0-2 Elements3-4 Elements5-6 Elements7-9 ElementsAll 10 ElementsMeasuring maintenance effectiveness requires constant review and goal setting to focus and channel improvement activities and to attain standardization of metrics.Elements:Operating profitRatio of operating profit to gross capitalValue added productivity.Labor productivityCost reductionHeadcount reductionReduction in product stock valueReduction in work in process valueEquipment investment efficiencyPlant/Labor ratioB.2 Plant Effectiveness0-2 Elements3-4 Elements5-6 Elements7-9 ElementsAll 10 ElementsEnsures each department clearly understands their particular responsibilities and sets targets reflecting those responsibilities.Elements:Overall plant effectivenessOverall sub process effectivenessOverall effectiveness of critical equipmentOverall availabilityPerformance rateStandard production rateAverage actual production rateQuality rateNumber of equipment (plant) failuresNumber of process failuresB.3 Quality and Energy Savings0-3 Elements4-6 Elements7-9 Elements9-10 ElementsAll 11 ElementsThese savings are important performance indicators. Treat them as key unit consumption indicators that relate directly to production costs.Elements:Process defect rateCost of process defectsNumber of defects passed onNumber of warranty claimsValue of warranty claimsOverall YieldElectrical consumptionSteam consumptionFuel consumptionLubrication/Fluid consumptionAuxiliary Material consumptionB.4 Maintenance Reliability and Maintainability1-2 Element3 Elements4 Elements5 ElementsAll 6 ElementsEvaluate two aspects of maintenance. First assess improvements in equipment reliability and maintainability and see how these help to raise plant effectiveness and product quality. Evaluate efficiency of manufacturing work.Elements:Failure frequencyFailure severity rateCost of stoppages due to failureNumber of idling and minor stoppagesMeantime between failuresEmergency maintenance rateB.5 Maintenance Efficiency1 Element2 Elements3 Elements4 ElementsAll 5 ElementsSystematize and speed up Preventive Maintenance and Condition Based Maintenance to achieve quick turn around and achieve smooth rapid startup by eliminating startup problems.Elements:Reduction in number of shut down maintenance days (SMD)Vertical startup after shutdown maintenancePreventive Maintenance achievement rateCorrective Maintenance TrendMaintenance head count reduction rate<br />Page 1 of 3<br />TPM DiagnosticPage 2 of 3B. TPM Metrics Traditional1234TPM5B.6 Maintenance Cost1 Element2-3 Elements4 Elements5-6 ElementsAll 7 ElementsIs the maintenance budget being utilized effectively? Is the work using the most economical methods? Reference reliability, maintainability, maintenance efficiency, maintenance cost, other maintenance indicators.Elements:Overall maintenance cost rateUnit maintenance costsMaintenance cost reduction rateUnexpected failure repair costMaintenance feesReduction in spares inventoryMaintenance cost rateB.7 Other maintenance indicators1 Element2 Elements3 Elements4 ElementsAll 5 ElementsElements:Contact maintenance rate – extent due to lack of technology and skillsContact maintenance rate – extent needed to absorb capacity (labor) shortagesRenovation rateIn house developmentFailure straight through rateB.8 Health/Safety Environment1 Element2 Elements3 Elements4 ElementsAll 5 ElementsEvery plant appoints managers and supervisors to be responsible for health, safety and environmental matters. Develop countermeasures to prevent past accidents and disasters from recurring analyze the reasons for near misses and establish safety measures.Elements:Accident frequencyAccident severity rateNumber of accidents requiring time off workNumber of plant accidentsNumber of continuously accident free daysNumber of near misses detectedNumber of safety problems spotted by safety teamNumber of improvements made on unsafe itemsWork place noise levelsNumber of external complaints (noise, dust, odors, etc)Number of discharges to outside (waste, oil, sludge, etc)B.9 Training and Morale1 Element2 Elements3 Elements4 ElementsAll 5 ElementsThrough training and hands on practice, TPM aims to revolutionize the workforce and develop highly skilled, motivated and self-reliant people who know their equipment and processes intimatelyElements:Number of meetings or time spent on SGANumber of focused improvement topics documentedCost savings due to focused improvementsNumber of improvement suggestionsNumber of outside company presentationsNumber of single point lesson sheetsNumber of maintenance traineesNumber of official qualifications earned for both mechanics and technicians.B.10 Promotion Goals1-2 Element3-4 Elements4-6 Elements7-9 ElementsAll 10 ElementsEvaluating TPM involves assessing whether the company has achieved the policy and goals set at the introduction of TPM and realized the intended benefits. It also involves judging how effectively priority topics, action items and quantitative targets have been pursued through improvement activitiesElements:Cost reduction compared with fiscal year (FY)Variable production cost compared with FY.Fixed production cost compared with FY.Labor productivity compared with FY. Number of major failures per periodNumber of failures monthly rates end of periodNumber of quality problems, claims per year.Number of accidents per yearNumber of accidents per year requiring time offNumber of accidents per year with no time off<br />TPM DiagnosticPage 3 of 3B. TPM Metrics Traditional1234TPM5B.11 Autonomous Maintenance No visible signs of cleaning, inspection or lube routes presentMachine contamination apparent.5S Level < 1.9No small group activities5S Level > 2.0Equipment history is reviewed.Minimum visual management is present on assetSmall group activity meeting are held on emergency basis onlyManagement walkthrough checklist completed monthly5S Level> 3.0TPM information currentSmall group activity meetings taking place5S Level > 4.0Equipment is benefiting from root cause analysisPhysical evidence of Cleaning is Inspection on asset.Consumables are identified and stocked5S Level = 5.0Small group activities are self- directed. Equipment availability data is posted showing positive trend.Visual management is present.All steps of AM are being auditedB.12 Overall Equipment EffectivenessOEE means “the amount of productive service that equipment provides.” OEE identifies pieces of equipment that present opportunities for improvement.Less than 10% of assets utilize OEE dataLess than 20% of assets utilize OEE dataLess than 40% of assets utilize OEE dataLess than 60% of assets utilize OEE dataLess than 80% of assets utilize OEE data<br />TPM Diagnostic4/15/2010 Rev BC. TPM PILLARSTraditional1234TPM5C.1 Planned MaintenanceVision – Equipment/process is operating such that zero breakdowns occur during production, and equipment/processes are available when required by the customer.C.1.1 Supplier/ Stores Management IntegrationVision – Supplier Management, Maintenance and Manufacturing personnel function as one cohesive team. In order to accomplish this, parts & materials from certified suppliers deliver directly to the point of use with minimal appropriate receiving inspection both in Operations and Maintenance.C.1.1.1 Source Inspection DelegationMotors, oil, electrical components, etc.Delegation program not established. Static Supplier base.Process established for delegation; 25% of suppliers approved.50% of suppliers have delegation authority. Supplier base reduction underway.75% of suppliers have delegation authority.90% or > of suppliers have delegation authority. Minimal supplier base.C.1.1.2 Supplier Management ResponsibilityMaterial resource buyers co-located with customers.Supplier Management is separate from Manufacturing.Supplier Management is coordinating with Manufacturing.Continuous & direct (face to face) communication between organizations.Supplier Management & Manufacturing view supplier management as joint responsibility.Shop floor personnel coordinate directly with suppliers for delivery. S/M&P manages the contract.C.1.1.3 JIT DeliveriesC.1.1.3.1 Raw Material Sheet stock, paint, wood, etc.No JIT contracts.JIT delivery on a minimum of 25% of raw materials.JIT delivery on a minimum of 50% of raw materials.JIT delivery on a minimum of 75% of raw materials.JIT delivery on >90% of raw materials.C.1.1.3.2 Detail PartsSpindles, power wire boards, light fixtures, etc.No JIT contracts.JIT delivery on a minimum of 25% of detail parts.JIT delivery on a minimum of 50% of detail parts.JIT delivery on a minimum of 75% of detail parts.JIT delivery on >90% of detail parts.C.1.1.3.3 Assemblies Motors, gear box, boilers, high value components.No JIT contracts.JIT delivery on a minimum of 25% of assemblies.JIT delivery on a minimum of 50% of assemblies.JIT delivery on a minimum of 75% of assemblies.JIT delivery on 90% + of assemblies.C.1.1.3.4 Stores/Supplier “kitted” assemblies.No JIT contracts JIT delivery on a minimum of 25% of supplier kits.JIT delivery on a minimum of 50% of supplier kits.JIT delivery on a minimum of 75% of supplier kits.JIT delivery on 90% + of supplier kits.C.1.1.4 Inventory System Integration Vision - Deliveries are based upon the shop floor need & delivered just prior to the need.C.1.1.4.1 Inventory System Integration With SupplierNo integration with supplier’s system.Developing some integration with supplier’s systems.Established EDI with some key suppliers as pilot.Most major suppliers are transmitted data via EDI.All major suppliers have EDI . All supplier problems are addressed prior to the next delivery.Page 1 of 4TPM DiagnosticPage 2 of 4C.1 Planned MaintenanceTraditional1234TPM5C.1.1.4.2 Internal Pull SystemAll deliveries are based on negotiated delivery schedule. Most deliveries are based on smaller sized lots. Kitting of parts to floor from stockrooms.Deliveries are based upon minimal inventory pads to the original need dates. Kits are delivered in logical work sizes.Kitting of parts by suppliers.Deliveries are based upon the shop floor need and delivered just prior to need. No large lot deliveries.C.1.1.4.3 Inventory TurnsNot measured.1 element.2 elements.3 elements.4 elements.Elements:1 . Measured at facility level3. Continuous improvement 2. Measured at cell level 4. Benchmark data is used frequently over past 24 monthsC.1.1.5 Point of Use Stocking By External Suppliers C.1.1.5.1 Low value parts (standards & small details).100% traditional stocking.Point of use stocking negotiated with suppliers or implemented in pilot areas (under 20% of areas).Point of use stocking in 21% - 49% of areas.Point of use stocking in 50% - 89% of areas.Point of use stocking fully utilized. Over 90% of areas.C.1.1.5.2 Mid-Value detail and assemblies100% traditional stocking.Point of use stocking negotiated with suppliers or implemented in pilot areas (under 20% of areas)Point of use stocking in 21% - 49% of areas.Point of use stocking in 50% - 89% of areas.Point of use stocking fully utilized. Over 90% of areas.C.1.1.5.3 High Value Parts100% traditional stocking.Point of use stocking negotiated with suppliers or implemented in pilot areas (under 20% of areas)Point of use stocking in 21% - 49% of areas.Point of use stocking in 50% - 89% of areas.Point of use stocking fully utilized. Over 90% of areas.C.1.1.5.4 Stores/Supplier “kitted” assemblies.100% traditional stocking.Point of use stocking negotiated with suppliers or implemented in pilot areas (under 20% of areas)Point of use stocking in 21% - 49% of areas.Point of use stocking in 50% - 89% of areas.Point of use stocking fully utilized. Over 90% of areas.C.1.2 Maintenance & Production SchedulesVision – The scheduling system is horizontally integrated across the site. Visual signals have been set up and utilized to drive the next need.C.1.2.1 Capacity Planning integrated with Maintenance SchedulesCapacity planning process not documented or considered when scheduling planned maintenance.Capacity is analyzed after maintenance order release. Final work scheduling made after order launched. Capacity is taken into account prior to launching maintenance orders into the maintenance product team. User friendly capacity system accessible to all teams. Factory is level loaded and producing to customer demand. Planned maintenance products are treated the same as operations products for scheduling.TPM DiagnosticPage 3 of 4C.1 Planned MaintenanceTraditional1234TPM5C.1.2.2 Maintenance Work OrderMaterial & tooling position is unknown at time of release.Material & tooling position is unknown at time of release, but analyzed after release.Material & tooling are forecast and analyzed prior to order release.Orders are not released until all materials & tools are available.Orders not released until all materials, tools & machines are available.C.1.2.3 Maintenance Activity/Cycle Time & Shop Floor ReductionNo formal plan for cycle time reduction.Formal plan exists. <24% progress to meeting objective.25-49% progress toward meeting goal.50-74% progress toward meeting goal.75% or better % progress toward meeting goal.C.1.2.4 Parts Management - Impact of ShortagesManages the shop by shortages. 75%-100% of orders are expedited. A number of “Priority” lists exist.Critical shortage list is the priority list. 50% - 74% of orders are expedited.Shortage position known by all. Orders are accurately tracked. (system & manual lists)Focus on accurately forecasting needs via dispatch list. No manual lists.Shortages are dealt with as an exception and system speeds up to accommodate requirements.C.1.3 QualityAny good or service provided to a downstream customer; i.e. painted room, installed machine, oil analyzed, completed work order, parts received,, etcC.1.3.1 Standardization of JobJob requirements have been standardized and simplified. Qualified workers can produce product with little or no training.No plans in place to accomplish this.Written plan developed and implementation is at less that 30%.30-49% of the jobs have been standardized and simplified.50-89% of the jobs have been standardized and simplified.90% or more of the jobs have been standardized and simplified.C.1.3.2 Advanced Maintenance Moving from reactive to proactive maintenance. <30% planned work.Moving from reactive to proactive maintenance. 30-50% planned work.Critical assets facilitized.Providing education and training on a pull basis.Moving from reactive to proactive maintenance. 50-80% planned work.Work planned and schedule using visual management tools.Facilities stores organized and support kitting for planned work.Moving from reactive to proactive maintenance. >80% planned work.Work planned and schedule using visual management tools.Root cause analysis and Maintenance prevention are systemic within enterprise.CBM implementedC.1.3.3 Set-up Reduction Development of a set-up reduction policy focusing on reducing non-value added time, motion and manpower while maintaining or decreasing variability in all aspects of maintenance. No plan in place to reduce set-up times.Written plan developed. Metrics displayed at the cell level with goals and performance to goals visible.Less than 50% of the teams are achieving set-up time reductions.50-89% of the teams are achieving set-up time reductions.90% or more of the teams are achieving set-up time reductions.<br />TPM DiagnosticPage 4 of 4C.1 Planned MaintenanceTraditional1234TPM5C.1.3.4 Process and Product Variation Reduction System Process and product Variation Reduction System is in place and applied effectively to a prioritized set of high cost/high waste problem areas. No Variation Reduction System in placeVariation Reduction tools are applied sporadically, with minimal lasting gainsVariation Reduction tools and activities are executed in a planned and effective manner, but are not yet widespread. Variation Reduction activities are executed in a planned and effective manner and are widespreadVariation Reduction activities are a way of doing daily business and their effectiveness is reflected in steady improvement in the supplier’s metric(s) for Waste/Defects.C.1.3.5 Maintenance Quality SystemDeficient ProceduresAdequate procedures, check sheets exist for all procedures.Internal audit and corrective action process effectively resolves deficiencies.No deficiencies are identified by the internal audit.The internal audit includes their supporting business systems.C.1.3.6 Intolerance for DefectsSystems and Processes are in place. Use of mistake proofing and AQS tools/data driven processes and systems.No system or process is in place.The system of in-process checks allows > 10% of internal defects to be passed on.The system of in-process checks allows 3 - 10% of internal defects to be passed on.The system of in-process checks allows 1 - 2% of internal defects to be passed on.The system of in-process checks allows < 1% of internal defects to be passed on.<br />TPM Diagnostic4/15/2010 Rev BC. TPM PILLARSTraditional1234TPM5C.2 Autonomous MaintenanceVision – Employee empowerment and team approaches are used for problem solving on the manufacturing floor. Decision–making is pushed to the lowest appropriate level and managers are viewed as coaches and facilitators.C.2.1 Small Group Activity (SGA) TeamsC.2.1.1 SGA Teams –Factory and Maintenance work force labor organized according to respective product line.No written plan. Teams may exist but have no self-direction authority.Written plan initiated. <10% of business organized by product line.10-49% of business organized by product line.50-89% of business organized by product line.90% or more of business organized by product line.C.2.1.2 Teams—Support PersonnelSupport people are part of Maintenance Product Teams and are accountable to the Product Organization.No written plan. Large centralized core support organization.Plan drawn up but no substantive implementation (<10%)10-49% of support function are part of Product Organization50-89% of support functions are part of Product Organization90% or more of support functions are part of Product Organization.C.2.1.3 Teams – External Customer/supplier Integration Maintenance Product Teams exercise “tactical” coordination with maintenance suppliers and contracted work, working planning, scheduling and quality issues.Not part of written team plan.Tactical supplier management in some Product Organizations (<10%)Tactical supplier management in some Product Organizations (10-49%)Tactical supplier management in some Product Organizations (50-89%)Tactical supplier management in most Product Organizations (90-100%)C.2.1.4 Empowerment of Teams0 Elements or No Plan1-4 Elements5-8 Elements9-12 Elements13-15 ElementsEmployee empowerment and team approaches are used for problem solving leading to significant productivity improvements and culture changes.Elements:Goal settingWork scheduleJob assignmentCell configurationTrainingMeetingsJob standardizationMeaningful input for new team member selectionLeader/Manager EvaluationPeer evaluation (job skills0Personnel requirements/manpowerRewardsProduct area budgeting/record keepingTactical supplier integrationContinuous product and process analysis and improvementsC.2.1.5 Multi-Skilled LaborMeasuring the ability of workers to perform a broad range of maintenance activities in support of their customer (respecting union negotiated contracts).Maintenance and Operators are not trained to care for different machines in their work area.25-49% of all Maintenance and Operators are trained.50-74% of all Maintenance and Operators are trained.75-89% of all Maintenance and Operators are trained.Over 90% of all Maintenance and Operators are trained to care for different machines in their work areas.<br />Page 1 of 4<br />TPM DiagnosticPage 2 of 4C.2 Autonomous MaintenanceTraditional1234TPM5C.2.1.6 Training1.46% or less of payroll for training OR0 elements or no plan.>1.46<1.90% of payroll for training OR2-3 elements.>1.9<2.35% of payroll for training OR4-5 elements.>2.35<3.14% of payroll for training OR6-7 elements>3.14<3.93% of payroll for training ORMore than 7 elementsTraining is provided to facilitate effective teaming, communication skills, and continuous improvement methods.REF: The ranking criteria is derived from the American Society for Training Development’s 1998 State of the Industry Report.Elements:Goal settingWork scheduleJob assignmentCell configurationTrainingMeetingsJob standardizationMeaningful input for new team member selectionLeader/Manager EvaluationPeer evaluation (job skills0Personnel requirements/manpowerRewardsCell budgeting/record keepingTactical supplier integrationContinuous product and process analysis and improvementsC.2.2 Small Group Activity (SGA) DeliverablesC.2.2.1 Autonomous Maintenance Team0 elements or no plan.1-2 elements.3-4 elements.5-6 elementsMore than 6 elementsElements:Individual Operators and Maintenance craft personnel take ownership in the reliability and effectiveness of their assigned asset.Roles and responsibilities are known Daily communication between AM team members is occurringWeekly AM meetings are conductedAM team is stable (i.e. long term assignment)Team members have skills & knowledge to participate in AMAM Team empoweredC.2.2.2 Environment0 elements or no plan.1-3 elements.4-5 elements.6-7 elementsMore than 7 elementsElements:Continuous follow up by Operations/Maintenance managementLockout-Tag-Tryout process is documented and usedEfficient use of energy resources is planned & implementedEfficient use of production resources is planned & implementedImprovement activities driven by facts & dataContinuous improvement is evidentUnexpected breakdowns are eliminatedThe work environment is safe Measures in placeC.2.2.3 Asset Maintenance 0 elements or no plan.1--4 elements.4-8 elements.9-13 elementsMore than 14 elementsElements:Asset is inspected using agreed upon routines and timetableChronic sources of contamination are eliminatedAsset is cleaned using agreed upon routines and timetablesPM routines, based on usage developed and followed Planned Maintenance schedules known, displayed and followedAutonomous Maintenance is a trigger for PM, PdM, and PJ activitiesOEE data is used to focus improvementsSpares are forecast and consumption rates trackedNon-labor resources availablePdM routines developed and followedLubrication routines developed and followedAll lube points are identifiedHard to reach places are eliminatedNo contamination at assetHigh usage parts at asset<br />TPM DiagnosticPage 3 of 4C.2 Autonomous MaintenanceTraditional1234TPM5C.2.3 Continuous Process Improvement (CPI) – Production and Maintenance Organization LevelC.2.3.1 Training for CPIMethods of problem solving, rootcause analysis, continuous improvement are understood and utilized by Team members.Methods of problem solving , root cause analysis, and continuous improvement are understood or utilized by <10% of Team members.10-24% of Team/Cell members25-49% of Team/Cell members50-89% of Team/Cell members90%+ of Team/Cell membersC.2.3.2 Data AvailabilityTeams use real-time data to assess Maintenance and Operations Product Teams performance, including total cost attributable to team, and assess CPI efforts.Data needed by SGA teams to evaluate their performance has been identified.3 or less elementsData is visible to SGA teams. SGA teams makes input to data.At least 4 elementsData is visible in real time format to SGA teams. SGA teams understand data and it’s source.At least 5 elementsData includes a production efficiency measure.At least 6 elementsData is available to CPI teams including total cost attributable to each cell operations.At least 8 elements Elements:Production EfficiencyInventory LevelsSet-up Times (per part)Takt TimePerformance TargetsCycle Time (throughput)Performance StatusCostInventory TurnsNon-Value Added/Value added ratio QualityEquipment FailuresSet Up and AdjustmentIdling and Minor StoppagesQuality Defects and ReworkStart up/Yield lossesSpeed LossesC.2.3.3 Process ManagementProcesses are documented and managed using value stream mapping techniques.Techniques not used or understood.Higher level processes documented and metrics in place (defect rates, waste, CPK, etc.)Lower level processes identified and documented.Improvement plans initiated on all processes not performing to goal.Processes at all levels are being continually improved, based on a structured plan with a clear understanding of benefits.C.2.3.4 CPI Project ActivityAssigned CPI project members spend a measurable amount of time actively involved with Continuous Process Improvement.No time spent on CPI projects.SGA Teams involved with only CPI projects concerning corrective action for quality issues.SGA Teams spend 10% or more of their time on process CPI issues.SGA Teams spends 15% or more of their time on process CPI issues.SGA Teams spends 20% or more of their time on process CPI projects.C.2.3.5 Maintenance and Operations Product Level – Customer/Supplier InvolvementExternal suppliers and customers are integrated into CPI activity.Limited supplier/customer involvement.Supplier/customer participation exceeds 10%Supplier/customer participation exceeds 30%Supplier/customer participation exceeds 40%Supplier/customer participation exceeds 50%<br />TPM DiagnosticPage 4 of 4C.2 Autonomous MaintenanceTraditional1234TPM5C.2.4 Continuous Process Improvement (CPI) – Factory WideC.2.4.1 Training for Management and Core Support PersonnelMethods of problem solving, root cause analysis, continuous improvement are understood and utilized by CPI project members.Methods of problem solving, root cause analysis, and continuous improvement are understood or utilized by <10% of management and support personnel.10-24% of Management and Support Personnel25-49% of Management and Support Personnel50-89% of Management and Support Personnel90%+ of Management and Support PersonnelC.2.4.2 CPI Project SelectionManagement’s role is to assure execution of projects having the greatest impact on the enterprise goals and bottom line.No systematic approach to identify or prioritize projects has been developedA traditional (rejection based) systematic approach has been developed and implemented.A systematic approach utilizing Lean/AQS Manufacturing Practices and Principles has been developed and implemented.Level 3 and CPI projects are selected with participation of cell level teams.Level 4 and after CPI project implementation, results are analyzed and check for desired outcome.C.2.4.3 CPI Projects ActivitySupport personnel assigned to CPI projects having the greatest impact on the enterprise goals and bottom line.Less than 10% of support personnel time.At least 10% of support personnel timeAt least 20% of support personnel timeAt least 30% of support personnel timeAt least 40% of support personnel timeC.2.4.4 Autonomous MaintenanceAutonomous Maintenance is an Operations owned process in which they accept the responsibility for and perform specific daily maintenance activities/checks/inspections/etc. Facilities role in the this process is to participate in the Autonomous Maintenance Workshops help in the decision making process that determine which duties should be part of the operator’s responsibilities and be a full time member of the sustaining AM team.No systematic approach to identify or prioritize Autonomous Maintenance has been developed.Development of Master Plan is focused on critical assets.AM SGA assumes ownership of reliability and efficiency of their asset.AM SGA are deployed in all areas of productionAM SGA are self sustaining, take ownership and responsibility for their asset(s), and initiate factory improvements based upon facts and data.<br />TPM Diagnostic4/15/2010 Rev BC. TPM PILLARSTraditional1234TPM5C.3 Attack the Six Big LossesVision – Overall equipment effectiveness is an internationally accepted measure for focusing improvement activities. OEE measures Availability, Performance Efficiency, and quality.C.3.1 ApplicationEducation and training is provided on a pull basis. SGA team activity supports implementation of Lean concepts.SGA teams in early implementation areas meet regularly and continuously attack the ‘Six Big Losses’.OEE > 50% on all critical assets.SGA team focuses on continuous reduction of production losses based on facts and data OEE >70% on all critical production assets.The SGA team has ownership in the reliability and effectiveness of their assigned assetsOEE >85% on all critical production assets.Continuous improvement of production efficiency is driven by SGA team stakeholdersC.3.2 Speed losses Equipment specifications not well understoodNo speed standards (by product and machinery)Wide speed variations across shifts/operatorsProblems related to speed losses analyzed: mechanical problems, quality problems.Tentative speed standards set and maintained by productNecessary improvements being implementedSpeed is set by the product. Cause and effect relationship between the problem and the precision of the equipmentSmall speed lossesOperation speed increased to design speed or beyond through equipment improvements.Final speed standards set and maintained by product.Zero speed lossesC.3.3 Idling and Minor Stoppage LossesLosses from minor stoppages unrecognized and unrecorded.Unstable operating conditions due to fluctuation in frequency and location of losses.Minor stoppage losses analyzed quantitatively by: frequency and location of occurrence; volume lost.Losses categorized and analyzed; preventive measures taken on trial and error basis.All causes of minor stoppages analyzed; all solutions implemented.Operation speed increased to design speed or beyond through equipment improvements.Final speed standards set and maintained by product.Zero minor stoppages (unmanned operation possible)C.3.4 Quality Defect and Rework LossesChronic quality defect problems are neglectedMany reactive and unsuccessful remedial actions have been takenChronic quality problems quantified by: details of defect, frequency; volume lost.Losses categorized and reasons explained: preventive measures taken on trial and error basis.Causes of chronic quality defect analyzed, solutions implemented,Automatic in-process detection of defects under study.Quality losses from 0.1% to zero<br />Page 1 of 2 <br />TPM DiagnosticPage 2 of 2C.3. Attack the Six big lossesTraditional1234TPM5C.3.5 Startup LossesStartup losses not recognized, understood or recordedStartup losses understood in terms of breakdowns and changeoversStart up losses measured.Process stabilization dynamics understood and improvements implementedCauses due to minor stops aligned with startup lossesRemedial actions on breakdowns, setups, minor stops and idling minimize startup losses.Startup losses minimized through process controlC.3.6 Breakdown LossesCombination of sporadic and chronic breakdownsSignificant breakdown lossesBM>PMNo operator asset careUnstable life spanEquipment weaknesses not recognizedChronic breakdownsBreakdown losses still significantBM=PMOperator asset care implementedParts life spans estimatedEquipment weaknesses well acknowledgedMaintainability improvement applied on above points.Time based maintenance establishedPM>BMBreakdown losses less than 1%Autonomous maintenance activities well establishedParts life spans lengthenedDesigners and engineers involved in higher level improvements.Condition-based maintenancePMAutonomous maintenance activities stable and refinedParts life spans predictedReliable and maintainable design developedBreakdown losses from 0.1% to zeroC.3.7 Setup and Adjustment LossesNo control: minimum involvement by operatorsWork procedures disorganized: setup and adjustment time varies widely and randomlyWork procedures organized, e.g. internal and external setup distinguishedSetup and adjustment time still unstableProblems to be improved are identified.Internal setup operations moved into external setup timeAdjustment mechanisms identified and well understoodError proofing introduced.Setup time less than 10 minutesImmediate product changeover by eliminating adjustment <br />BM = Breakdown Maintenance<br />PM = Preventive Maintenance<br />TPM DiagnosticC. TPM PILLARSTraditional1234TPM5C.4 Early Equipment DesignVision – Equipment must be flexible to respond to abrupt changes in market demand as well as be specialized to help the company remain competitive. The following five conditions must be examined before acquisition of any asset.C.4.1 Early Equipment ManagementFocus on production capabilities in a Lean environment. New assets meet production needs and minimize life cycle costs.Education and training is provided on a pull basis.Ensure maintainability and MTTR/MTBF.Ensure assets minimize life cycle costs while meeting the needs of operationsAssets support a Lean flexible production environment. Production parts are designed with the manufacturing process in mind.Production assets are designed, built, or modified in-house.C.4.2 Development1-3 Elements4-6 Elements7-9 Elements10-12 Elements13 ElementsCombination of product development and development of equipment with related fabrication methods to produce high quality products at low cost.Design for quality adherenceEconomic life cycle costFlexibilityLow cost autonomationIntrinsic safetyElements:Product plan (cost plan)Product development and designPrototype testingProcess planningProcess qualityCost settingEvaluate fabrication methodsEliminate technical issues Set equipment specificationsEvaluate equipmentDebug equipment designTest run initial operation on equipmentDocument regular operation and maintenanceC.4.3 Reliability0 Element1-2 Elements3-4 Elements5 Elements6 ElementsEquipment must produce defect free parts and be easily maintainable.Elements:Mistake proof designFail safe designNon mechanical designDe-rating the designIndependent overlapping system designRedundant designC.4.4 Economics1-2 Elements2-3 Elements4-5 Elements6-7 Elements8 ElementsEquipment must be inexpensive not only in terms of initial cost but also in terms of its running costs; therefore, the team’s objective is to develop and design equipment with the lowest possible life cycle cost.Elements:Acquisition costs (planning, design and development construction)Product distribution cost (packaging, transportation, handling, warehousing and storage).Maintenance cost (customer service organization intermediate, plant maintenance and personnel costs)Inventory cost (spares and material support)Retirement and disposal costsTraining and technical data costOperations cost (facilities energy, utilities, taxes)Tools and test equipment costs<br />Page 1 of 2<br />TPM DiagnosticPage 2 of 2C. TPM PILLARSTraditional1234TPM5C.4.5 Availability1-2 Elements3-5 Elements6-9 Elements10-12 Elements13 ElementsImproving production and manufacturing techniques for equipment to produce to takt time.Elements: AutomationMechanizationAccelerationLinked automationAutomated material handlingRobotics.Product analysesProcess analysesOperation analysesProcess designFMEALayoutFactory wide participationC.4.6 Maintainability1Elements2 Elements3 Elements4 Elements5 ElementsEasy to maintain with zero breakdownsElements: Development of autonomous maintenance stepsBreakdown reduction measures, MQ organization, preventive maintenance management.Reduce chronic in-process defects and comprehensive quality assurance-related activities.Pre-production improvements in new products, QA-friendly design development.Education and training in maintenance skills, quality control, etc.C.4.7 Operability1 Element2 Elements3-4 Elements5-6 Elements7 ElementsEasy to operate with zero breakdownsElements: Are frequent adjustments required?Are handle or knobs difficult to operate or located poorly?Are any specialized skills or tools required for operation/adjustment?Are blockages/stoppages likely?Has any diagnostic function built in? (glass panels, gauges, indicators)Startups and shutdowns: is additional manning required?Are the operator’s working posture unhealthy?<br />TPM Diagnostic4/15/2010 Rev BC.5 Training & EducationTraditional1234TPM5Vision – Training is a key element in the success of TPM and is an integral part of producing a highly motivated and multi-skilled workforce.C.5.1 TPM Education 1-2 Elements3-5 Elements6-9 Elements10-13 Elements14-16 ElementsA training curriculum is in place with all aspects of TPM knowledge and problem solving skills. Required skills and knowledge for specific job assignments are known. Skills, knowledge and capability of individuals are known with respect to their job assignments.Elements:Understands the importance of lubrication.Understands the importance of cleaning is inspection Understands the importance of eliminating contamination.Knows the criteria for recognizing abnormalities and understands the causes.Can diagnose failures to a certain extentUnderstands the relationship between equipment and product quality characteristics and asks the 5 Why’s.Understand the causes of defects.Understands how to replenish consumables.Has basic knowledge of life cycle of machine components.Understands basic failure causes. Some personnel have specialized training as facilitators for SGAKnows how to collect data for Maintenance and OEE.SGA are taking place and personal are constructively analyzing informationCan analyze and correctly assess whether equipment is operating normally or not and when to shut it downSGA = Small Group ActivityC.5.2 Operator Training 1-2 Elements3-4 Elements5-8 Elements9-11 Elements12-14 ElementsElements:Operator understands equipment construction.Assist in equipment overhauls Operator can perform cleaning is inspection correctly.Operators have basic education and knowledge of the operation and maintenance of the assetOperator has the ability to lube own asset.Operator understands the importance of eliminating contamination.Knows the criteria for recognizing abnormalities and defects understands the causes.Operator can judge that the equipment is operating correctly and when to shut down.Has basic knowledge of life cycle of machine components.Understands basic failure causesAssist in equipment overhaulsWork with SGA to improve equipment and component reliability, lengthen equipment life times, and curb abnormalities and failures.Understands basic CBM equipment diagnostics.Improves the understanding of their asset and shares it with other personnel.<br />Page 1 of 2<br />TPM DiagnosticPage 2 of 2C.5 Training & EducationTraditional1234TPM5C.5.3 Maintenance Training 1-2 Elements3-6 Elements7-10 Elements11-14 Elements15-17 ElementsElements:Understands the importance of eliminating contamination.Can judge correctly when to shut down the equipmentCan diagnose failures.Understands the relationship between equipment and product quality characteristics.Understands the causes of defects.Understands the restocking and kitting of spare parts and consumables.Has basic knowledge of life cycle of machine components.Understands basic failure causesPerforms equipment overhaulsUnderstands equipment construction.Knows the criteria for recognizing abnormalities and understands the causes to restore normal operations.Maintenance has basic and advanced knowledge of the operation and maintenance of assets in their care.Can collect data for maintenance and OEE.Maintenance personnel are trained in advanced maintenance processes, CBM, and techniques are being utilized in daily maintenance and standardized.Maintenance professionals must be able to instruct operators in correct handling, operating and daily maintenance of equipment.Work with SGA to improve equipment and component reliability, lengthen equipment life cycle times, and curb abnormalities and failures.Improves the understanding of their asset and shares it with other personnel.<br />