5 KPIs that can boost your business intelligence program
•
0 gostou•8,843 visualizações

Many finance and IT executives acknowledge that large-scale data analysis is key to organization strategy for market differentiation. Still, a large portion of food and beverage consumer packaged goods companies the next steps are murky. Here are 5 KPIs to help you boost your BI programs. For more on making business intelligence work for your company, click here: http://gt-us.co/WHvOfw

Recomendados
Recomendados
Mais conteúdo relacionado
Mais procurados
Mais procurados (20)
Destaque
Semelhante a 5 KPIs that can boost your business intelligence program
Semelhante a 5 KPIs that can boost your business intelligence program (20)
Mais de Grant Thornton LLP
Mais de Grant Thornton LLP (20)
Último
Último (20)
5 KPIs that can boost your business intelligence program
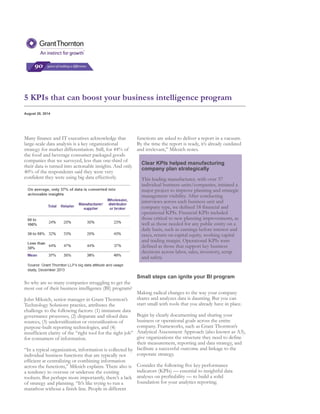
- 1. August 20, 2014 Many finance and IT executives acknowledge that large-scale data analysis is a key organizational strategy for market differentiation. Still, for 44% of the food and beverage consumer packaged goods companies that we surveyed, less than one-third of their data is turned into actionable insights. And only 40% of the respondents said they were very confident they were using big data effectively. So why are so many companies struggling to get the most out of their business intelligence (BI) program? John Miksich, senior manager in Grant Thornton’s Technology Solutions practice, attributes the challenge to the following factors: (1) immature data governance processes, (2) disparate and siloed data sources, (3) underutilization or overutilization of purpose-built reporting technologies, and (4) insufficient clarity of the “right tool for the right job” for consumers of information. “In a typical organization, information is collected by individual business functions that are typically not efficient at centralizing or combining information across the functions,” Miksich explains. There also is a tendency to overuse or underuse the existing toolsets. But perhaps more importantly, there’s a lack of strategy and planning. “It’s like trying to run a marathon without a finish line. People in different functions are asked to deliver a report in a vacuum. By the time the report is ready, it’s already outdated and irrelevant,” Miksich notes. Clear KPIs helped manufacturing company plan strategically This leading manufacturer, with over 37 individual business units/companies, initiated a major project to improve planning and strategic management visibility. After conducting interviews across each business unit and company type, we defined 18 financial and operational KPIs. Financial KPIs included those critical to new planning improvements, as well as those needed for any public entity on a daily basis, such as earnings before interest and taxes, return on capital equity, working capital and trading margin. Operational KPIs were defined as those that support key business decisions across labor, sales, inventory, scrap and safety. Small steps can ignite your BI program Making radical changes to the way your company shares and analyzes data is daunting. But you can start small with tools that you already have in place. Begin by clearly documenting and sharing your business or operational goals across the entire company. Frameworks, such as Grant Thornton’s Analytical Assessment Approach (also known as A3), give organizations the structure they need to define their measurement, reporting and data strategy, and facilitate a successful outcome and linkage to the corporate strategy. Consider the following five key performance indicators (KPIs) — essential to insightful data analyses on profitability — to build a solid foundation for your analytics reporting.
- 2. Gross margin target not only measures how profitable your business aims to be, but it is also one of the first things investors will look at. In other words, as a KPI, the gross margin target takes the pulse of your business. 1. Working capital is another financial KPI that measures your company’s health and is critical to track. Expressed as a ratio of the difference between current assets and liability and net sales, the working capital KPI will tell you if the business can cover its liabilities. 2. Days sales outstanding is an operational KPI that measures how efficient your company is at collecting revenue after a sale and exposes operational deficiencies that you can eliminate with a predictive analytics tool. 3. On-time delivery performance has a direct impact on your revenue and profits and should be one of your must-track KPIs. Make sure you keep tabs not only on your performance, but on your suppliers’ as well. We’ve found that customer retention rates drop from 82% for companies working with prompt suppliers to 70% for companies with poor supplier performance. 4. Inventory aging, a measure of how well your business is able to move stock, can help you identify bottlenecks when plugged into your BI program. As your business grows and expands its offerings, you will want to know how much time it takes to move inventory in and out. 5. Managing expectations is paramount “Your leadership needs to understand that introducing business intelligence concepts is an evolution,” says Miksich. “Prioritizing the release of information does not always align to executive expectations, but it is critical to be measured in deployments to build confidence in the business intelligence strategy. And as the business changes, the metrics and the associated KPIs will have to change too.” About the survey We surveyed 241 business retailers, manufacturers/suppliers, and wholesalers/distributors/brokers in the food and beverage industry in December 2013. The target respondents were directors, general managers, category/merchandising/marketing managers, CEOs, CIOs and other senior executives. See more at: http://www.grantthornton.com/issues/library/articles/food-and-beverage/2014/08-5-KPIs-that-can-boost-your-business About Grant Thornton LLP The people in the independent firms of Grant Thornton International Ltd provide personalized attention and the highest-quality service to public and private clients in more than 100 countries. Grant Thornton LLP is the U.S. member firm of Grant Thornton International Ltd, one of the world’s leading organizations of independent audit, tax and advisory firms. Grant Thornton International Ltd and its member firms are not a worldwide partnership, as each member firm is a separate and distinct legal entity In the United States, visit Grant Thornton LLP at www.GrantThornton.com. Content in this publication is not intended to answer specific questions or suggest suitability of action in a particular case. For additional information on the issues discussed, consult a Grant Thornton client service partner or another qualified professional. © 2014 Grant Thornton LLP is the U.S. member firm of Grant Thornton International Ltd.