SlideShare uma empresa Scribd logo
1 de 6
Baixar para ler offline
CONSTRUCTION A I RPORT S ferrovial S ERV I C E S 
Shaping the future 
Listed since 1999… …with an attractive shareholder remuneration 
Data as of November 2014 
€40.2Mn 
Daily traded volume 
FER SM (Bloomberg) 
FER.MC (Reuters) 
Company Ticker 
Historical Dividends 
* 2014 includes only interim dividend 
Shareholder base 
% 
Source: CNMV (Nov 2014) 
Consensus recommendations 
27 
Focus on cash flow to parent company… … with a solid track record 
New projects’ equity 
Toll Roads' & Airports 
dividends 
€12.1Bn 
Market cap. 
PARENT COMPANY 
Shareholders’ 
dividends 
Operating Cash Flow 
Analyst coverage: 
Buy 
Hold 
Sell 
5% 
77% 
18% 
(including analyst reports from last 3 months) 
INFRASTRUCTURE 
PROJECTS 
Ring fenced debt 
EXCL. INFRA 
PROJECTS 
TOLL ROADS 
TOLL ROADS 
• Leading sponsor of toll roads 
infrastructure development 
worldwide 
• Key developer of 407 ETR and 
23 other concessions in 6 
different countries 
CONSTRUCTION 
• Civil engineering 
• Industrial construction 
• Water treatment 
• 80 years of experience 
SERVICES 
• Leading provider of infrastructure 
services 
• Infrastructure management and 
maintenance 
• Urban services and waste 
management 
• Focus on intelligent cities, waste 
treatment and energy efficiency 
AIRPORTS 
• Largest airport private investor 
• Ownership and operational 
management of key UK airports, 
including Heathrow, combining 
almost 85 million passengers a 
year 
Balanced capital allocation, reinvesting in new projects for long term value 
creation, while attractively remunerating our shareholders. 
€/Share 
0.40 0.42 0.45 
1.25 
0.691 
0.381 
2009 2010 2011 2012 2013 2014* 
+ 
54.9% 
Free-float 
42.1% 
Controlling shareholder 
2.9% 
Blackrock 
Operating Cash Flow Dividends 
Construction & Services Toll Roads & Airports 
731 
€Mn 
503 527 
749 
655 
462 
595 
663 
2006 2007 2008 2009 2010 2011 2012 2013 
Construction Services 
182 201 
397 
119 
173 159 
365 
461 
2006 2007 2008 2009 2010 2011 2012 2013 
Toll roads Airports 
Strong financial situation … …with no meaningful maturities until 2018 
Net debt ex-infra projects Maturity calendar ex-infra projects 
43 14 18 11 
501 
96 
811 
2014 2015 2016 2017 2018 2019 2020 + 
Corporate Ratings S&P BBB Fitch BBB 
The world's leading private investor in 
transportation infrastructures… 
Founded in 1952, Ferrovial is one of the world's leading groups specialized in 
infrastructure and cities, operating through its Toll Roads, Services, Construction 
and Airports divisions. 
With around 66,000 employees in more than 25 countries, the company continues 
to endeavor to make a difference in the world of infrastructure and services and, 
therefore, in society. 
The Company manages key assets such as Canada's 407 ETR highway (43.2%) 
and London's Heathrow Airport (25.0%), both assets consolidated as equity 
accounted. Through its Services division, Ferrovial maintains a leading position in 
sophisticated markets such as the UK and Spain, while Construction continues to 
be a core Ferrovial activity being involved in all areas of construction, namely 
complex civil and industrial works. 
Ferrovial is listed in the Madrid Stock Exchange with an over €10Bn market 
capitalization and an average daily traded volume over €40Mn. Ferrovial is 
included in the Dow Jones Sustainability, FTSE4Good and Carbon Disclosure 
Project indexes and has a “Prime” rating by Oekom research. 
… with presence in all the infrastructure value chain 
Resilient CF generation from Construction & Services activities through the crisis 
combined with an increasing upstream of dividends from infrastructure projects. 
Historical Operating Cash flow and Dividends from infrastructure projects: 
Operating Cash flow generated at Construction & Services together with 
dividends from infrastructure projects to serve Parent Company debt, equity 
investments in new infrastructure projects and dividend to shareholders. 
Low level of corporate debt (Net cash for the last 5 years), at the core of our 
strategy to keep our investment grade credit rating: BBB (S&P and Fitch). 
Structure based on non-recourse debt at infrastructure projects, extracting 
dividends to remunerate the equity injected. 
Ferrovial has issued three corporate bonds between 2013 and 2014 (maturing in 
2018, 2021 & 2024). Ferrovial has almost no banking exposure at parent 
company level and no meaningful maturities until 2018) 
€Mn 
3,064 
1,987 
1,547 
1,172 
31 
907 
1.484 
1.663 1.533 
2006 2007 2008 2009 2010 2011 2012 2013 9M'14 
€Mn 
Debt allocated at project level 
to optimise capital structure Outlook: Stable 
EX-INFRA PROJECTS 
9M ‘14 
NET CASH 
€1,533mn 
INFRASTRUCTURES 
PROJECTS 
NET DEBT 
€7,587mn 
IR Department e: ir@ferrovial.com -  +34 915862730 Figures in million Euros 1
Ferrovial, vision and values 
Ferrovial has distinguished itself, above all, for its excellent professionals. Hard work and creativity centered on performance, have allowed us to 
overcome complex challenges and to take advantage of opportunities, transforming individual skills into collective success. 
Ferrovial, as a leading developer and operator in the infrastructure and services sector, will continue to shape the future of society with a continuous 
focus on talent, integrity, safety, excellence and innovation.” (Rafael del Pino, Ferrovial ‘s Chairman) 
ferrovial 
2010 2011 2012 2013 
Total Investment (b) -420 -328 -320 -754 
Total Divestment (c) 1,124 1,264 893 564 
Activity Cash Flow (a+b+c) 1,515 1,447 1,486 858 
Interest Payment -138 -114 -32 -46 
Others 147 -81 -48 -49 
Dividend to Shareholders -320 -376 -826 -523 
Net Cash Generation 1.204 875 583 180 
2013 
Cash flow ex-infra projects performance 
2010 2011 2012 2013 
Construction 373 298 100 304 
Services 282 164 495 359 
Dividends from Highways 170 159 220 242 
Dividends from Airports 2 0 145 219 
Others 43 -43 -16 -27 
Taxes -60 -67 -30 -48 
Operating Cash Flow (a) 811 511 914 1,048 
A well-balanced international portfolio*… ...translates into diversified cash flows 
* 2013 FY - Proportionally considering Ferrovial stake in each project. 
Revenues EBITDA* 
€9,162mn €1,681mn 
Services 
Toll Roads 
Construction 
Airports 
20% 
29% 
32% 
19% 
43% 24% 22% 11% 
UK N. America Spain RoW 
11% 
42% 
8% 
39% 
Ferrovial geographical  business diversification implies a well balanced portfolio, 
with airports as the largest contributor to adjusted Ebitda* (32% weight in 2013). 
Services 
A recurrent cash flow generator with a long duration backlog providing long term visibility 
“Integrated service management” to maximize 
infrastructure asset value throughout their lifecycle. 
Strong cash flow generation and resilient performance in 
a difficult economic context. 
Enterprise acquisition at £385Mn (€474Mn), in April 
2013, to generate value mainly through synergies, with 
an IRR estimated at c.15%. 
After the integration of Enterprise the UK will gain weight 
reaching more than 60% of the Division backlog. 
Cash flow generation due to International growth despite 
declining Spanish market. 
International backlog was 70% at FY2013, with US 38% 
and Poland 14% being the main markets where we do 
have “local” presence through Budimex and Webber 
(Texas). 
Significant international contracts awarded in 2013, most 
of them with our own Toll Roads division (M8 in Scotland 
and NTE 3A3B in Texas), with the internal backlog being 
over 32% at FY2013. 
Ebitda generated in the UK and North America accounted for over 67% of adjusted 
Ebitda*. 
Reveues Backlog 
UK 
Spain 
1% 
36% 
63% 
2% 
39% 
59% 
International 
Construction 
A proven competitive tool to success in bidding for greenfield infrastructure projects 
Geographical Work 
Industrial 
Backlog breakdown 
Residential  other 
2% 
Civil works 
Domestic 
International* 
30% 
70% 
20% 
78% 
2,328 
5,539 
IR Department e: ir@ferrovial.com -  +34 915862730 Figures in million Euros 2
20.16 Corporate Responsibility Plan 
Ferrovial is a financially, ethically, socially and environmentally sustainable company. To achieve this, every three years Ferrovial updates its CR Strategic 
Plan. The 20.16 CR Plan, approved in January 2014, defines Ferrovial’s main sustainability items for the next few years and renews its commitments at 
the same time it reinforces its alignment with the business priorities. 
Corportate governance, Ethics and Integrity, People, The environment, Society and Innovation are its main areas of action. 
Toll Roads 
A world leading private developer of infrastructures, focus MAIN ASSETS 
on value creation through risk management 
Managed Investment 
44% 
20% 
36% 
US 
Canada 
Europe 
We manage a portfolio of 24 concessions with a total of 2,100kms, distributed throughout 
Canada, the United States, Spain, Portugal, Ireland and Greece. 
Our portfolio is its long duration (average maturity 50 years) with attractive tariffs 
schemes, allowing in many cases to increase them above inflation rates. 
Principally explicit toll projects, where the concession holder profitability is not capped, 
resulting in a potential value creation for the long term. 
3 main assets in the US (managed lanes) at initial phases of activity; 2 under development 
 one recently opened in Oct 2014. Managed lane concept based in congestion 
management through dynamic tolling, to offer a solution to congested urban corridors. 
Concession Km 
Managed 
Investment 
% Cintra % Ferrovial Status 
Net debt 
Dic-2013 
Maturity Country 
North Tarrant Express 21,4 1.541 56,7 56,7 Under Development -578 2061 USA 
NTE (3A/3B) 16,4 970 50,1 50,1 Under Development -38 2061 USA 
LBJ Express 27,4 1.901 51,0 51,0 Under Development -910 2061 USA 
Indiana Toll Road 252,7 3.044 25,5 50,0 Operation -2.778 2081 USA 
Chicago Skyway 12,5 1.391 55,0 55,0 Operation -1.068 2104 USA 
SH-130 64,0 1.048 65,0 65,0 Operation -862 2062 USA 
Almanzora 41,5 146 23,8 23,8 Under Development 0 2041 Spain 
Autovía de la Plata 49,0 191 25,0 25,0 Under Development -29 2042 Spain 
Autema 48,3 233 76,3 76,3 Operation -666 2036 Spain 
2046 (Ausol I) Spain 
2054 (Ausol II) Spain 
Autopista del Sol 105,2 729 80,0 80,0 Operation -453 
Madrid - Sur 97,2 1.351 55,0 55,0 Operation -601 2065 Spain 
Madrid - Levante 182,8 540 51,8 53,7 Operation -542 2040 Spain 
Alcalá - O´Donnell 15,3 99 100,0 100,0 Under Development 0 2065 Spain 
SerranoPark 3,297 spaces 76 50,0 50,0 Operation -47 2048 Spain 
ViaLivre 174,5 84,0 84,0 Operation 8 2031 Portugal 
Euroscut Algarve 129,8 264 77,0 85,0 Operation -149 2030 Portugal 
Norte Litoral 119,0 386 75,5 84,0 Operation -209 2031 Portugal 
Euroscut Azores 93,7 386 89,0 89,2 Operation -334 2036 Portugal 
M4-M6 Highway 36,0 340 66,0 66,0 Operation -112 2033 Ireland 
M3 Highway 50,0 549 95,0 95,0 Operation -199 2052 Ireland 
Ionian Roads 378,7 33,3 33,3 Under Development 51 2037 Greece 
Central Greece 231,0 33,3 33,3 Under Development -348 2038 Greece 
407 EDG 35,0 637 50,0 50,0 Under Development -133 2045 Canada 
407 ETR 108,0 3.161 43,2 43,2 Operation -3.806 2098 Canada 
407 ETR 
43.2% stake in 407 ETR (equity accounted) 
Located in Toronto, Ontario (Canada), it runs parallel to the first city ring road, the 401, one of North America's most congested toll roads. 
One of the most valuable assets in infrastructure world, given traffic robustness, possibility to almost freely establish the tariffs(*) and LT duration (84Y remaining to 2098). 
(CADMn) (CADMn) 
408 
EBITDA Net Debt/EBITDA Dividends 
665 
2007 2008 2009 2010 2011 2012 2013 
27X 
8.4X 
1999 2013 
85 
145 120 135 
190 
300 
459 
600 
680 
2005 2006 2007 2008 2009 2010 2011 2012 2013 
Resilient performance through the crisis, involving a strong deleverage process since acquisition in 1999, allowing to an increasing dividend distribution policy. 
*Toll-setting freedom: Toll charges varied freely provided that traffic is above a certain threshold. The user pays according to the timesaving provided by the highway. 
Airports 
25.0%stake in Heathrow Airports Holding (Equity accounted) 
MAIN ASSETS 
Following the acquisition of BAA Airports Limited in June 2006 (renamed HAH Airports in Oct 2012), Ferrovial became the leading private infrastructure operator in the 
world, with four airports in the UK including Heathrow (as well as Glasgow, Southampton  Aberdeen), with 84.9mn passengers in 2013. After recent stake divestments, 
Ferrovial holds 25.0% in the company with Qatar (20%), Brittania (13.29%), GIC (11.88%), Alinda (11.18%), CIC (10%) and USS (8.65%) holding the rest, providing a 
quality shareholding structure involving sovereign funds of Qatar, China  Singapore and one of the largest pension schemes in the UK (USS). 
Heathrow Airport, 15 miles from central London, is regarded as the hub of the aviation world. Flying more than 72mn passengers to over 180 destinations in over 90 
countries each year, it's no wonder that some 90 airlines operate from Heathrow. 
Operating improvement at Heathrow 
Departures punctuality 
63% 
79% 
2007 9m'14 
% Passengers rating Heathrow 
“Excellent” or “Very Good” 
Missed bags per 1,000 
passengers 
48% 
75% 
2007 9m'14 
40 
19 
2007 9m'14 
(£Mn) 
559 
1,310 
EBITDA 
2007 2008 2009 2010 2011 2012 2013 
In 2013 Heathrow distributed dividends to its shareholders amounting £555Mn: a regular dividend (£255Mn) and an extraordinary payment (£300Mn) following the 
disposal of Stansted. Heathrow’s intends to keep a recurrent dividend with sustainable growth (expected regular dividend of £270Mn for 2014, £203Mn paid as of 9M14). 
IR Department e: ir@ferrovial.com -  +34 915862730 3
2014 Highlights 
Location: North of Charlotte, North Carolina 
Customer: North Carolina Department of 
Project: 2 managed lanes in each direction 
Purpose: Desing, construction, funding, 
Opening: Scheduled for mid-2018. 
Concession start date: 2018 
Concession end date: 2068 
Duration: 50 years 
Construction: Joint Venture: Ferrovial Agroman  
Length of the highway: 26 miles 
Sections: • Southern Section: 2.2 miles 
Managed Investment: $655m (€478Mn) 
Tariffic Policy: Developer has total freedom to set 
Payment methods: Electronic tolling system 
DESCRIPTION: 
Dallas-Fort Worth Metroplex, Major thoroughfares 
between Fort Worth and DFW Airport 
Transportation (NCDoT) 
of I-77 highway between the links to 
the I-277 in Charlote and NC-150 in 
Iredell County 
operation and maintenance 
W.C. English (US). 
• Central Section: 14.9 miles 
• Northern Section: 8.8 miles 
toll rates along the corridor 
FINANCIAL STRUCTURE 
Heathrow airport 
Opening T2 (June ‘14) 
• c.350 flights per day 
• 40,000 passengers per day 
Highest ever passenger satisfaction 
Departures punctuality % passengers rating 
63% 
79% 
2007 9M 2014 
21% 52% 27% 
EQUITY DEBT PUBLIC FUNDS 
TOTAL INVESTMENT: 2.05Bn 
EQUITY: 21% 427Mn 
($Mn) 
CINTRA: 243Mn (57%) 
MERIDIEM: 141mn (33%) 
DPFPS: 43mN (10%) 
TOTAL DEBT: 52% 
1,050Mn 
PABs: 400Mn 
TIFIA: 650Mn 
27% 
PUBLIC FUNDS: 537Mn 
(€Mn) 
PL and selected figures Balance sheet 
OCT NTE Managed Lane opened to public (9 months ahead of schedule) 
Indicative non binding offer for 100% of Transfield Services (Australia) 
Offer for 6.5% stake in AENA (subject to IPO) 
Agreement of Ferrovial Airports  Macquarie (50/50) to acquire 100% of 
Aberdeen, Glasgow  Southampton airports 
NOV 2nd scrip dividend paid (equiv. to 2014 interim), €0.381 
APR Liquidity line agreed (€750mn, 5Y, with 12 banks, cost of 80bps). 
JUN I-77 highway concession awarded 
Approval of share buy-back programme (up to 3.5% of capital/€350mn) 
JUL 3rd corporate bond issued (€300mn, 10Y, 2.5% fixed). 
SP upgraded Ferrovial from BBB- to BBB, stable outlook. 
1st scrip dividend paid (equiv. to 2013 complementary), €0.291 
I-77 Highway (North Carolina) award and 
financial close (June ’14) 
LENGTH: 
13 mile section (IH820  SH183 in Tarrant County) 
CONCESSION PERIOD: 52 years 
TARIFF POLICY: 
Open Road Tolling System (no toll booths) with a 
dynamic tolling (every 5 minutes) to maintain a 
minimum speed of 50 mph 
57% 33% 10% 
CINTRA MERIDIAM DALLAS FIREPOLICE 
PENSION SCHEME 
SHAREHOLDERS’ STRUCTURE 
NTE opening (Oct ’14) 
2010 2011 2012 2013 
Revenues 9.384 7.446 7.630 8.166 
EBITDA 1.246 818 927 934 
EBIT 961 625 708 701 
Financial result -704 -303 -301 -333 
Net Income 2.163 1.243 692 727 
Market Capitalization 5.457 6.840 8.215 10.317 
Employees 100.995 69.990 57.276 66.088 
Construction backlog 10.186 9.997 8.699 7.867 
Services backlog 12.378 12.425 12.784 17.749 
Third runway 
Heathrow’s proposal shortlisted for further 
analysis (Airports Commission) 
Heathrow “Excellent” or 
“Very good” 
Missed bags per 1,000 
passengers 
48% 
78% 
2007 9M 2014 
40 
19 
2007 9M 2014 
KEY CHARACTERISTICS 
Heavy congestion. 
No toll-booths, fully electronic free flow 
tolling system. 
Tollway within a freeway: choice of driving in 
non-tolled or tolled lanes. 
Tolls set to ensure min. speed on new lanes. 
As demand grows  capacity becomes 
scarce, pricing power increases. 
Physically separated from the GP lanes with 
controlled access. 
FINANCIAL OVERVIEW 
 First combination of TIFIA and tax exempt PABs. 
 First un-wrapped bond issuance for a toll road. 
 First time TIFIA allowed additional debt to be 
raised beyond its approved federal subsidy cap. 
 First time that a U.S.-based pension fund made a 
direct investment in a highway concession. 
2010 2011 2012 2013 2010 2011 2012 2013 
Equity 6.628 6.246 5.780 6.074 
Deferred Income 196 292 356 503 
Long Term Assets 35.465 17.500 16.660 17.142 Long Term Liabilities 28.596 10.806 11.117 11.230 
Investments in infra. projects 21.512 5.960 6.755 7.639 Financial Debt 21.511 6.695 6.996 7.496 
Equity-consolidated companies 3.110 5.199 4.322 3.562 Debt at Infra. Projects 19.566 5.503 5.825 6.403 
Long Term financial assets 2.184 1.912 1.674 1.810 Debt Ex_Infra. Projects 1.944 1.192 1.171 1.093 
Short Term Assets 6.306 5.452 5.570 5.678 Short Term Liabilities 6.975 5.606 4.976 5.013 
Trade  other receivables 3.161 2.673 2.198 2.202 Trade and other payables 4.889 3.882 3.267 3.254 
Cash  other financial investments 2.701 2.349 2.967 3.130 Financial Debt 1.530 1.214 1.229 1.303 
Cash at Infra. Projects 694 188 237 279 Debt at Infra. Projects 1.415 1.145 1.168 1.228 
Cas Ex_Infra. Projects 2.007 2.161 2.730 2.851 Debt Ex_Infra. Projects 116 69 61 75 
Total Assets 43.287 22.951 22.230 22.820 Total Liabilities  Equity 43.287 22.951 22.230 22.820 
Consolidated figures 
IR Department e: ir@ferrovial.com -  +34 915862730 4
Human resources 
Promoting the professional development of all its employees is amongst 
Ferrovial’s strategic priorities. The combination of the talent and commitment of 
Ferrovial’s professionals is one of the pillars of the company’s success in 
infrastructure management. 
ESTRATEGY 
A) Talent management 
Through consolidated Evaluation Processes, such as 360º Feedback for 
management; Succession Plans, to review more than 700 people for the 
identification of successors and the analysis of management positions and Talent 
Identification Programmes. 
13 
(9%) 
13 
(100%) 
6 
Same business Different business 
(46%) 
7 
(54%) 
Changes in senior 
management positions 
Internal 
appointments 
Additionally, since 2007 the Corporate University provides training for more than 
3,000 students each year, wihch accounted for nearly 1,300.00 hours in 2013. 
B) Commitment 
The company’s rotation index is 2.9% and 8 out of 10 employees would 
recommend Ferrovial as a good company to work for: 
Environment 
EQUALITY 
Ferrovial ensures that all employees enjoy equal opportunities to develop their 
professional careers on the basis of merit, confirmed by its Distinguished Equal 
Opportunities Company award in 2010, which remains in force until 2016. 
HEALTH  SAFETY 
In 2013, Ferrovial’s accident rate maintained its downward path. In particular, an 
analysis of the reduction of more than 18% in the Frequency Index, more than 
8% in the Incident Index and 22% in the Severity Index. 
43.7 
39.9 0.5 
0.4 
25.7 
21.1 
WORKFORCE (June 2014) 
At the end of June 2014, the average workforce numbered 66,862 employees. 
45% carry out their activities outside Spain, and 16% work part time; by type of 
contract, 82% are on permanent contracts. 30% of total employees are female, 
and 14% of senior management. 
Key magnitudes and % satisfaction 
FREQUENCY INDEX: Number of 
accidents resulting in time off work 
occurred during the working day 
per million hours worked. The result 
is expressed per million. 
INCIDENT INDEX: Number of 
accidents resulting in time off work 
that occurred during the working 
day per thousand employees 
exposed. 
SEVERITY INDEX: Number of 
working days lost due to accidents 
at work per thousand hours 
worked. The result is expressed per 
thousand. 
Men Women Total 
Construction 11,052 1,494 12,546 
Corporation 198 139 337 
Real Estate 28 47 75 
Services 34,810 18,172 52,982 
Concessions 599 291 890 
Airports 19 13 32 
Total 46,706 20,156 66,862 
Environmental sustainability plays an increasingly relevant role for Ferrovial. 
Beyond its commitment to reduce the environmental impact of its activities 
worldwide, the company considers that global challenges such as climate change, 
the energy crisis and the loss of biodiversity should not only be tackled with the 
responsibility expected of a global company, but also that they could become a 
source of new opportunities in the medium and long term. 
ENVIRONMENTAL MANAGEMENT SYSTEMS 
In 2013, 88% of group sales were covered by environmental management 
systems certified by independent entities (under ISO 14001 and EMAS 
standards). 
Meanwhile, quality certificates increased by 11%, reaching 90% of total group 
sales. 
For the last 13 consecutive years Ferrovial has been included in the DJSI 
(Dow Jones Sustainability Index) at a global level. 
With a mark of 99 out of 100, Ferrovial leads the CDP (Carbon Disclosure 
Project) ratings in all its activity sectors on a global scale. CDP is investors’ 
principal reference for evaluating how companies deal with the risks and 
opportunities related to climate change. 
GREENHOUSE GAS EMISSIONS 
31.6% reduction in greenhouse gas emissions since 2009. 
2013 
-31.6% 
FOSSIL FUEL EMISSIONS AND ELECTRICITY 
In 2013, Ferrovial consumed 37.8% more energy from renewable sources 
than in the previous year. 
WATER 
Water consumption of 1,933,592 m3 was 28.4% less than during 2012. 
RECYCLING 
In 2013, Ferrovial recycled a total of 97,840 tonnes. 
Non financial information 
IR Department e: ir@ferrovial.com -  +34 915862730 5
Innovation 
Environmental sustainability plays an increasingly relevant role for Ferrovial. 
Beyond its commitment to reduce the environmental impact of its activities 
worldwide, the company considers that global challenges such as climate change, 
the energy crisis and the loss of biodiversity should not only be tackled with the 
responsibility expected of a global company, but also that they could become a 
source of new opportunities in the medium and long term. 
INVESTMENT IN INNOVATION 
Through consolidated Evaluation Processes, such as 360º Feedback for 
management; Succession Plans, to review more than 700 people for the 
identification of successors and the analysis of management positions and Talent 
Identification Programmes. 
RD Investment (€Mn) 
2013 2012 2011 2010 
32.9 32.6 51.32 45 
Ferrovial fosters a policy of open innovation, in the form of creating an 
ecosystem of partners in the community. The innovation strategy is on three 
levels: 
− A common government to establish the innovation strategy. 
− An ecosystem – public authorities, innovation centres, large companies, SMEs, 
start-ups – that seeks to create the appropriate cultural climate. 
− The necessary resources for their development: information, financing, public 
programmes, etc. 
INNOVATION PROJECTS 
The important milestones in Ferrovial’s growth are inseparable from its projects. 
Ferrovial has defined seven priority areas for action: airports, water, motorways, 
intelligent cities, innovative construction, energy efficiency and waste evaluation. 
Living Lab Guadalajara 
Within the intelligent cities area, the Living Lab Guadalajara is conceived as a 
space to unfold new technologies that transform and improve urban services, 
resulting in a better quality of life for its inhabitants. 
Projects with MIT 
The “System for Waste Separation and Evaluation” project started with the 
objective of improving the operations and design of the urban waste separation 
and treatment plants, which is being worked on by a group of researchers from 
the Massachusetts Institute of Technology (MIT), in coordination with Ferrovial 
Servicios. 
The project, which started in June 2014, will imply an investment of €231,000. 
Ferrovial Innovation Awards 
Ferrovial is aware that innovation can emerge anywhere, and as a result has 
organised a second eddition of its “Ferrovial Innovation Awards” – Zuritanken – 
inviting its employees to offer solutions to four challenges (one for each 
business unit): Services, Toll Roads, Construction and Airports. 
The results of this second round are shown below: 
636 
Participants 
677 
Ideas 
45% teams 
vs. 55% individuals 
Madrid Smart Lab 
The city competition centre runs the Madrid Smart Lab programme, to develop 
innovation projects in cooperation with the local council to improve local mobility 
and quality of life. 
59 Proposals 
31 Mobility 28 Quality of life 
say on pay 
Fixed Variable LT incentives 
2010 Grant 
0 200,000 400,000 
Euros 
Percentile 
75 
0-25%il 
25-50%il 
50-75%il 
75-90%il 
Percentile 
25 
Percentile 
90 
Mean 
Media 
ferrovial 
Source: Towers Watson 
PRESIDENT  CEO REMMUNERATION 
2013: balanced contribution between fix, variable and long term incentives: 
BOARD REMMUNERATION non executive 
Ferrovial compares with IBEX35 and is in the average compensation of that 
group. 
22% 39% 39%

Mais conteúdo relacionado

Mais procurados

Results presentation 3 q12
Results presentation 3 q12Results presentation 3 q12
Results presentation 3 q12
TriunfoRi
 
European Cities & Regions Of The Future 2010
European Cities & Regions Of The Future 2010European Cities & Regions Of The Future 2010
European Cities & Regions Of The Future 2010
grainne_b
 
Institutional presentation
Institutional presentationInstitutional presentation
Institutional presentation
Marcopolo
 
Global Infraestructure Leadership Forum, Washington, Dec 09
Global Infraestructure Leadership Forum, Washington, Dec 09Global Infraestructure Leadership Forum, Washington, Dec 09
Global Infraestructure Leadership Forum, Washington, Dec 09
Madrid Network
 

Mais procurados (20)

Keolis SA 2015 Financial Report
Keolis SA 2015 Financial ReportKeolis SA 2015 Financial Report
Keolis SA 2015 Financial Report
 
Tracxn-Geo-Europe Tech-July 2021Europe Tech
Tracxn-Geo-Europe Tech-July 2021Europe TechTracxn-Geo-Europe Tech-July 2021Europe Tech
Tracxn-Geo-Europe Tech-July 2021Europe Tech
 
ERRAC and how proposals for Horizon 2020 have been developed - Andy Doherty
ERRAC and how proposals for Horizon 2020 have been developed - Andy DohertyERRAC and how proposals for Horizon 2020 have been developed - Andy Doherty
ERRAC and how proposals for Horizon 2020 have been developed - Andy Doherty
 
Implementing Business Continuity in Crossrail: Europe's Largest Construction ...
Implementing Business Continuity in Crossrail: Europe's Largest Construction ...Implementing Business Continuity in Crossrail: Europe's Largest Construction ...
Implementing Business Continuity in Crossrail: Europe's Largest Construction ...
 
January 2020 vwag_investor_roadshow
January 2020 vwag_investor_roadshowJanuary 2020 vwag_investor_roadshow
January 2020 vwag_investor_roadshow
 
Results presentation 3 q12
Results presentation 3 q12Results presentation 3 q12
Results presentation 3 q12
 
Italian trade main presentation Loay Al Baba
Italian trade main presentation Loay Al Baba Italian trade main presentation Loay Al Baba
Italian trade main presentation Loay Al Baba
 
European Cities & Regions Of The Future 2010
European Cities & Regions Of The Future 2010European Cities & Regions Of The Future 2010
European Cities & Regions Of The Future 2010
 
TEN-T Case Study, Oman Transport Summit
TEN-T Case Study, Oman Transport SummitTEN-T Case Study, Oman Transport Summit
TEN-T Case Study, Oman Transport Summit
 
Institutional presentation
Institutional presentationInstitutional presentation
Institutional presentation
 
Leaders Study Program, Paris 2019- Great paris
Leaders Study Program, Paris 2019- Great parisLeaders Study Program, Paris 2019- Great paris
Leaders Study Program, Paris 2019- Great paris
 
Tracxn - Top Business Models - Europe Tech - Mar 2022
Tracxn - Top Business Models - Europe Tech - Mar 2022Tracxn - Top Business Models - Europe Tech - Mar 2022
Tracxn - Top Business Models - Europe Tech - Mar 2022
 
Cariforum-EU Business Forum - Recommendation & Findings on ICT - Reaping the ...
Cariforum-EU Business Forum - Recommendation & Findings on ICT - Reaping the ...Cariforum-EU Business Forum - Recommendation & Findings on ICT - Reaping the ...
Cariforum-EU Business Forum - Recommendation & Findings on ICT - Reaping the ...
 
Keolis Group Worldwide 2013
Keolis Group Worldwide 2013Keolis Group Worldwide 2013
Keolis Group Worldwide 2013
 
Tracxn-Transportation and logistics Tech- 17 Aug 2021
Tracxn-Transportation and logistics Tech- 17 Aug 2021Tracxn-Transportation and logistics Tech- 17 Aug 2021
Tracxn-Transportation and logistics Tech- 17 Aug 2021
 
Tracxn - Auto Tech - Top Business Models - Dec 2020
Tracxn - Auto Tech - Top Business Models - Dec 2020Tracxn - Auto Tech - Top Business Models - Dec 2020
Tracxn - Auto Tech - Top Business Models - Dec 2020
 
Eu strategy for ertms deployment s. ouaki 2
Eu strategy for ertms deployment   s. ouaki 2Eu strategy for ertms deployment   s. ouaki 2
Eu strategy for ertms deployment s. ouaki 2
 
Global Infraestructure Leadership Forum, Washington, Dec 09
Global Infraestructure Leadership Forum, Washington, Dec 09Global Infraestructure Leadership Forum, Washington, Dec 09
Global Infraestructure Leadership Forum, Washington, Dec 09
 
Global Infraestructure Leadership Forum, Washington, Dec 09
Global Infraestructure Leadership Forum, Washington, Dec 09Global Infraestructure Leadership Forum, Washington, Dec 09
Global Infraestructure Leadership Forum, Washington, Dec 09
 
Groupe Keolis SAS 2015 Financial Report
Groupe Keolis SAS 2015 Financial ReportGroupe Keolis SAS 2015 Financial Report
Groupe Keolis SAS 2015 Financial Report
 

Destaque

Investors Presentation 2012 | Presentación Inversores 2012
Investors Presentation 2012 | Presentación Inversores 2012Investors Presentation 2012 | Presentación Inversores 2012
Investors Presentation 2012 | Presentación Inversores 2012
Ferrovial
 
Executive summary 2013 | Resumen Ejecutivo 2013
Executive summary 2013 | Resumen Ejecutivo 2013Executive summary 2013 | Resumen Ejecutivo 2013
Executive summary 2013 | Resumen Ejecutivo 2013
Ferrovial
 

Destaque (20)

Investors Presentation 2012 | Presentación Inversores 2012
Investors Presentation 2012 | Presentación Inversores 2012Investors Presentation 2012 | Presentación Inversores 2012
Investors Presentation 2012 | Presentación Inversores 2012
 
Ferrovial Servicios Birmingham Ciudad Inteligente
Ferrovial Servicios Birmingham Ciudad InteligenteFerrovial Servicios Birmingham Ciudad Inteligente
Ferrovial Servicios Birmingham Ciudad Inteligente
 
Ferrovial Financial Results Jan Dec 2014
Ferrovial Financial Results Jan Dec 2014Ferrovial Financial Results Jan Dec 2014
Ferrovial Financial Results Jan Dec 2014
 
Ferrovial Financial Results Jan Sep 2015
Ferrovial Financial Results Jan Sep 2015Ferrovial Financial Results Jan Sep 2015
Ferrovial Financial Results Jan Sep 2015
 
Ferrovial Executive Summary Jan Jun 2015
Ferrovial Executive Summary Jan Jun 2015Ferrovial Executive Summary Jan Jun 2015
Ferrovial Executive Summary Jan Jun 2015
 
Ferrovial Financial Results Jan Dec 2015
Ferrovial Financial Results Jan Dec 2015Ferrovial Financial Results Jan Dec 2015
Ferrovial Financial Results Jan Dec 2015
 
60 miradas a Ferrovial (Exposición de José Manuel Ballester en CaixaForum)
60 miradas a Ferrovial (Exposición de José Manuel Ballester en CaixaForum)60 miradas a Ferrovial (Exposición de José Manuel Ballester en CaixaForum)
60 miradas a Ferrovial (Exposición de José Manuel Ballester en CaixaForum)
 
January-March 2013 results
January-March 2013 resultsJanuary-March 2013 results
January-March 2013 results
 
Planteamiento de Cespa en la gestión de residuos vegetales de invernadero
Planteamiento de Cespa en la gestión de residuos vegetales de invernaderoPlanteamiento de Cespa en la gestión de residuos vegetales de invernadero
Planteamiento de Cespa en la gestión de residuos vegetales de invernadero
 
JGA 2014 Presentación
JGA 2014 PresentaciónJGA 2014 Presentación
JGA 2014 Presentación
 
Ferrovial Investors Presentation 2011
Ferrovial Investors Presentation 2011Ferrovial Investors Presentation 2011
Ferrovial Investors Presentation 2011
 
Construction Futures Wales - CrossRail Event
Construction Futures Wales - CrossRail EventConstruction Futures Wales - CrossRail Event
Construction Futures Wales - CrossRail Event
 
Integrated Annual Report Ferrovial 2014
Integrated Annual Report Ferrovial 2014Integrated Annual Report Ferrovial 2014
Integrated Annual Report Ferrovial 2014
 
Executive summary 2013 | Resumen Ejecutivo 2013
Executive summary 2013 | Resumen Ejecutivo 2013Executive summary 2013 | Resumen Ejecutivo 2013
Executive summary 2013 | Resumen Ejecutivo 2013
 
Informe Anual Integrado Ferrovial 2014
Informe Anual Integrado Ferrovial 2014Informe Anual Integrado Ferrovial 2014
Informe Anual Integrado Ferrovial 2014
 
Junta General Accionistas 2012 (Español)
Junta General Accionistas 2012 (Español)Junta General Accionistas 2012 (Español)
Junta General Accionistas 2012 (Español)
 
Manual contra el despilfarro
Manual contra el despilfarroManual contra el despilfarro
Manual contra el despilfarro
 
Resultados enero - diciembre 2012
Resultados enero - diciembre 2012Resultados enero - diciembre 2012
Resultados enero - diciembre 2012
 
Ferrovial Investors Presentation Jan Dec 2014 | Presentación Inversores Ene D...
Ferrovial Investors Presentation Jan Dec 2014 | Presentación Inversores Ene D...Ferrovial Investors Presentation Jan Dec 2014 | Presentación Inversores Ene D...
Ferrovial Investors Presentation Jan Dec 2014 | Presentación Inversores Ene D...
 
Ferrovial Financial Results Jan Jun 2015
Ferrovial Financial Results Jan Jun 2015Ferrovial Financial Results Jan Jun 2015
Ferrovial Financial Results Jan Jun 2015
 

Semelhante a Ferrovial Overview 2014

Investors Presentation 2013 | Presentación Inversores 2013
Investors Presentation 2013 | Presentación Inversores 2013Investors Presentation 2013 | Presentación Inversores 2013
Investors Presentation 2013 | Presentación Inversores 2013
Ferrovial
 
Ferrovial Investors Presentation Jan Sep 2014 | Presentación Inversores Ene S...
Ferrovial Investors Presentation Jan Sep 2014 | Presentación Inversores Ene S...Ferrovial Investors Presentation Jan Sep 2014 | Presentación Inversores Ene S...
Ferrovial Investors Presentation Jan Sep 2014 | Presentación Inversores Ene S...
Ferrovial
 
GCF - Our Added Value in A&D Sector 0923.pdf
GCF - Our Added Value in A&D Sector 0923.pdfGCF - Our Added Value in A&D Sector 0923.pdf
GCF - Our Added Value in A&D Sector 0923.pdf
sunclarisse
 
GCF - Our Added Value in A&D Sector 0923.pdf
GCF - Our Added Value in A&D Sector 0923.pdfGCF - Our Added Value in A&D Sector 0923.pdf
GCF - Our Added Value in A&D Sector 0923.pdf
HannahDerenbach
 
GCF - Our Added Value in Mobility & Environment Sector 0224
GCF - Our Added Value in Mobility & Environment Sector 0224 GCF - Our Added Value in Mobility & Environment Sector 0224
GCF - Our Added Value in Mobility & Environment Sector 0224
hnaour
 
GCF- our added value in industry sector 0923.pdf
GCF- our added value in industry sector 0923.pdfGCF- our added value in industry sector 0923.pdf
GCF- our added value in industry sector 0923.pdf
sunclarisse
 
GCF- our added value in industry sector 0923.pdf
GCF- our added value in industry sector 0923.pdfGCF- our added value in industry sector 0923.pdf
GCF- our added value in industry sector 0923.pdf
HannahDerenbach
 
GCF- our added value in industry sector 0823.pdf
GCF- our added value in industry sector 0823.pdfGCF- our added value in industry sector 0823.pdf
GCF- our added value in industry sector 0823.pdf
HannahDerenbach
 
GCF - Présentation Industry - 1022.pdf
GCF - Présentation Industry - 1022.pdfGCF - Présentation Industry - 1022.pdf
GCF - Présentation Industry - 1022.pdf
Lucas518833
 
Ferrovial Investors Presentation Jan Mar 2014 | Presentación Inversores Ene M...
Ferrovial Investors Presentation Jan Mar 2014 | Presentación Inversores Ene M...Ferrovial Investors Presentation Jan Mar 2014 | Presentación Inversores Ene M...
Ferrovial Investors Presentation Jan Mar 2014 | Presentación Inversores Ene M...
Ferrovial
 
GCF - Our Added Value in A&D Sector 0124.pdf
GCF - Our Added Value in A&D Sector 0124.pdfGCF - Our Added Value in A&D Sector 0124.pdf
GCF - Our Added Value in A&D Sector 0124.pdf
Clarisse35
 
GCF - Our Added Value in A&D Sector 0124.pdf
GCF - Our Added Value in A&D Sector 0124.pdfGCF - Our Added Value in A&D Sector 0124.pdf
GCF - Our Added Value in A&D Sector 0124.pdf
Clarisse35
 
GCF - Our Added Value in Mobility & Environment Sector 0923.pdf
GCF - Our Added Value in Mobility & Environment Sector 0923.pdfGCF - Our Added Value in Mobility & Environment Sector 0923.pdf
GCF - Our Added Value in Mobility & Environment Sector 0923.pdf
sunclarisse
 
GCF - Our Added Value in Mobility & Environment Sector 0923.pdf
GCF - Our Added Value in Mobility & Environment Sector 0923.pdfGCF - Our Added Value in Mobility & Environment Sector 0923.pdf
GCF - Our Added Value in Mobility & Environment Sector 0923.pdf
HannahDerenbach
 
GCF - Our Added Value in Mobility & Environment Sector- 0823.pdf
GCF - Our Added Value in Mobility & Environment Sector- 0823.pdfGCF - Our Added Value in Mobility & Environment Sector- 0823.pdf
GCF - Our Added Value in Mobility & Environment Sector- 0823.pdf
HannahDerenbach
 
Institutional presentation 4 q12
Institutional presentation   4 q12Institutional presentation   4 q12
Institutional presentation 4 q12
TriunfoRi
 
GCF - Présentation Industry - 1222_.pdf
GCF - Présentation Industry - 1222_.pdfGCF - Présentation Industry - 1222_.pdf
GCF - Présentation Industry - 1222_.pdf
HlnePEYRUSQUE
 

Semelhante a Ferrovial Overview 2014 (20)

Investors Presentation 2013 | Presentación Inversores 2013
Investors Presentation 2013 | Presentación Inversores 2013Investors Presentation 2013 | Presentación Inversores 2013
Investors Presentation 2013 | Presentación Inversores 2013
 
Spanish Construction Industry - Market Analysis 2017
Spanish Construction Industry - Market Analysis 2017Spanish Construction Industry - Market Analysis 2017
Spanish Construction Industry - Market Analysis 2017
 
Ferrovial Investors Presentation Jan Sep 2014 | Presentación Inversores Ene S...
Ferrovial Investors Presentation Jan Sep 2014 | Presentación Inversores Ene S...Ferrovial Investors Presentation Jan Sep 2014 | Presentación Inversores Ene S...
Ferrovial Investors Presentation Jan Sep 2014 | Presentación Inversores Ene S...
 
Ferrovial: Investor Presentation Jan Jun 2014 | Presentación Inversores Ene J...
Ferrovial: Investor Presentation Jan Jun 2014 | Presentación Inversores Ene J...Ferrovial: Investor Presentation Jan Jun 2014 | Presentación Inversores Ene J...
Ferrovial: Investor Presentation Jan Jun 2014 | Presentación Inversores Ene J...
 
GCF - Our Added Value in A&D Sector 0923.pdf
GCF - Our Added Value in A&D Sector 0923.pdfGCF - Our Added Value in A&D Sector 0923.pdf
GCF - Our Added Value in A&D Sector 0923.pdf
 
GCF - Our Added Value in A&D Sector 0923.pdf
GCF - Our Added Value in A&D Sector 0923.pdfGCF - Our Added Value in A&D Sector 0923.pdf
GCF - Our Added Value in A&D Sector 0923.pdf
 
GCF - Our Added Value in Mobility & Environment Sector 0224
GCF - Our Added Value in Mobility & Environment Sector 0224 GCF - Our Added Value in Mobility & Environment Sector 0224
GCF - Our Added Value in Mobility & Environment Sector 0224
 
GCF- our added value in industry sector 0923.pdf
GCF- our added value in industry sector 0923.pdfGCF- our added value in industry sector 0923.pdf
GCF- our added value in industry sector 0923.pdf
 
GCF- our added value in industry sector 0923.pdf
GCF- our added value in industry sector 0923.pdfGCF- our added value in industry sector 0923.pdf
GCF- our added value in industry sector 0923.pdf
 
GCF- our added value in industry sector 0823.pdf
GCF- our added value in industry sector 0823.pdfGCF- our added value in industry sector 0823.pdf
GCF- our added value in industry sector 0823.pdf
 
GCF - Présentation Industry - 1022.pdf
GCF - Présentation Industry - 1022.pdfGCF - Présentation Industry - 1022.pdf
GCF - Présentation Industry - 1022.pdf
 
Leonardo Full-Year 2018 Presentation
Leonardo Full-Year 2018 PresentationLeonardo Full-Year 2018 Presentation
Leonardo Full-Year 2018 Presentation
 
Ferrovial Investors Presentation Jan Mar 2014 | Presentación Inversores Ene M...
Ferrovial Investors Presentation Jan Mar 2014 | Presentación Inversores Ene M...Ferrovial Investors Presentation Jan Mar 2014 | Presentación Inversores Ene M...
Ferrovial Investors Presentation Jan Mar 2014 | Presentación Inversores Ene M...
 
GCF - Our Added Value in A&D Sector 0124.pdf
GCF - Our Added Value in A&D Sector 0124.pdfGCF - Our Added Value in A&D Sector 0124.pdf
GCF - Our Added Value in A&D Sector 0124.pdf
 
GCF - Our Added Value in A&D Sector 0124.pdf
GCF - Our Added Value in A&D Sector 0124.pdfGCF - Our Added Value in A&D Sector 0124.pdf
GCF - Our Added Value in A&D Sector 0124.pdf
 
GCF - Our Added Value in Mobility & Environment Sector 0923.pdf
GCF - Our Added Value in Mobility & Environment Sector 0923.pdfGCF - Our Added Value in Mobility & Environment Sector 0923.pdf
GCF - Our Added Value in Mobility & Environment Sector 0923.pdf
 
GCF - Our Added Value in Mobility & Environment Sector 0923.pdf
GCF - Our Added Value in Mobility & Environment Sector 0923.pdfGCF - Our Added Value in Mobility & Environment Sector 0923.pdf
GCF - Our Added Value in Mobility & Environment Sector 0923.pdf
 
GCF - Our Added Value in Mobility & Environment Sector- 0823.pdf
GCF - Our Added Value in Mobility & Environment Sector- 0823.pdfGCF - Our Added Value in Mobility & Environment Sector- 0823.pdf
GCF - Our Added Value in Mobility & Environment Sector- 0823.pdf
 
Institutional presentation 4 q12
Institutional presentation   4 q12Institutional presentation   4 q12
Institutional presentation 4 q12
 
GCF - Présentation Industry - 1222_.pdf
GCF - Présentation Industry - 1222_.pdfGCF - Présentation Industry - 1222_.pdf
GCF - Présentation Industry - 1222_.pdf
 

Mais de Ferrovial

Executive summary 1Q14
Executive summary 1Q14Executive summary 1Q14
Executive summary 1Q14
Ferrovial
 
Resumen Ejecutivo Ferrovial 2013
Resumen Ejecutivo Ferrovial 2013Resumen Ejecutivo Ferrovial 2013
Resumen Ejecutivo Ferrovial 2013
Ferrovial
 
Results Presentation 2013 | Resultados Financieros 2013
Results Presentation 2013 | Resultados Financieros 2013Results Presentation 2013 | Resultados Financieros 2013
Results Presentation 2013 | Resultados Financieros 2013
Ferrovial
 

Mais de Ferrovial (16)

Ferrovial Integrated Annual Report 2015
Ferrovial Integrated Annual Report 2015Ferrovial Integrated Annual Report 2015
Ferrovial Integrated Annual Report 2015
 
Ferrovial Informe Anual Integrado 2015
Ferrovial Informe Anual Integrado 2015Ferrovial Informe Anual Integrado 2015
Ferrovial Informe Anual Integrado 2015
 
Ferrovial Investors Presentation Jan Dec 2015
Ferrovial Investors Presentation Jan Dec 2015Ferrovial Investors Presentation Jan Dec 2015
Ferrovial Investors Presentation Jan Dec 2015
 
Ferrovial Executive Summary Jan Dec 2015
Ferrovial Executive Summary Jan Dec 2015Ferrovial Executive Summary Jan Dec 2015
Ferrovial Executive Summary Jan Dec 2015
 
Ferrovial Investors Presentation Jan Sep 2015
Ferrovial Investors Presentation Jan Sep 2015Ferrovial Investors Presentation Jan Sep 2015
Ferrovial Investors Presentation Jan Sep 2015
 
Ferrovial Executive Summary Jan Sep 2015
Ferrovial Executive Summary Jan Sep 2015Ferrovial Executive Summary Jan Sep 2015
Ferrovial Executive Summary Jan Sep 2015
 
Ferrovial Investors Presentation Jan Jun 2015
Ferrovial Investors Presentation Jan Jun 2015Ferrovial Investors Presentation Jan Jun 2015
Ferrovial Investors Presentation Jan Jun 2015
 
Ferrovial Executive Summary Jan Mar 2015
Ferrovial Executive Summary Jan Mar 2015Ferrovial Executive Summary Jan Mar 2015
Ferrovial Executive Summary Jan Mar 2015
 
Ferrovial Financial Results Jan Mar 2015
Ferrovial Financial Results Jan Mar 2015Ferrovial Financial Results Jan Mar 2015
Ferrovial Financial Results Jan Mar 2015
 
Ferrovial Executive Summary Jan Dec 2014
Ferrovial Executive Summary Jan Dec 2014Ferrovial Executive Summary Jan Dec 2014
Ferrovial Executive Summary Jan Dec 2014
 
Ferrovial Executive Summary Jan Sep 2014
Ferrovial Executive Summary Jan Sep 2014Ferrovial Executive Summary Jan Sep 2014
Ferrovial Executive Summary Jan Sep 2014
 
Ferrovial Financial Results Jan-Sep 2014
Ferrovial Financial Results Jan-Sep 2014Ferrovial Financial Results Jan-Sep 2014
Ferrovial Financial Results Jan-Sep 2014
 
Executive Summary: January-June 2014 Results
Executive Summary: January-June 2014 ResultsExecutive Summary: January-June 2014 Results
Executive Summary: January-June 2014 Results
 
Executive summary 1Q14
Executive summary 1Q14Executive summary 1Q14
Executive summary 1Q14
 
Resumen Ejecutivo Ferrovial 2013
Resumen Ejecutivo Ferrovial 2013Resumen Ejecutivo Ferrovial 2013
Resumen Ejecutivo Ferrovial 2013
 
Results Presentation 2013 | Resultados Financieros 2013
Results Presentation 2013 | Resultados Financieros 2013Results Presentation 2013 | Resultados Financieros 2013
Results Presentation 2013 | Resultados Financieros 2013
 

Último

VIP Call Girls Junagadh 7001035870 Whatsapp Number, 24/07 Booking
VIP Call Girls Junagadh 7001035870 Whatsapp Number, 24/07 BookingVIP Call Girls Junagadh 7001035870 Whatsapp Number, 24/07 Booking
VIP Call Girls Junagadh 7001035870 Whatsapp Number, 24/07 Booking
dharasingh5698
 
Editing progress 20th march.docxxxxxxxxx
Editing progress 20th march.docxxxxxxxxxEditing progress 20th march.docxxxxxxxxx
Editing progress 20th march.docxxxxxxxxx
MollyBrown86
 
Corporate Presentation Probe May 2024.pdf
Corporate Presentation Probe May 2024.pdfCorporate Presentation Probe May 2024.pdf
Corporate Presentation Probe May 2024.pdf
Probe Gold
 
Terna - 1Q 2024 Consolidated Results Presentation
Terna - 1Q 2024 Consolidated Results PresentationTerna - 1Q 2024 Consolidated Results Presentation
Terna - 1Q 2024 Consolidated Results Presentation
Terna SpA
 
VIP Call Girls Mehsana 7001035870 Whatsapp Number, 24/07 Booking
VIP Call Girls Mehsana 7001035870 Whatsapp Number, 24/07 BookingVIP Call Girls Mehsana 7001035870 Whatsapp Number, 24/07 Booking
VIP Call Girls Mehsana 7001035870 Whatsapp Number, 24/07 Booking
dharasingh5698
 
B2 Interpret the brief.docxccccccccccccccc
B2 Interpret the brief.docxcccccccccccccccB2 Interpret the brief.docxccccccccccccccc
B2 Interpret the brief.docxccccccccccccccc
MollyBrown86
 

Último (20)

High Profile Call Girls in Pune (Adult Only) 8005736733 Escort Service 24x7 ...
High Profile Call Girls in Pune  (Adult Only) 8005736733 Escort Service 24x7 ...High Profile Call Girls in Pune  (Adult Only) 8005736733 Escort Service 24x7 ...
High Profile Call Girls in Pune (Adult Only) 8005736733 Escort Service 24x7 ...
 
Indapur - Virgin Call Girls Pune | Whatsapp No 8005736733 VIP Escorts Service...
Indapur - Virgin Call Girls Pune | Whatsapp No 8005736733 VIP Escorts Service...Indapur - Virgin Call Girls Pune | Whatsapp No 8005736733 VIP Escorts Service...
Indapur - Virgin Call Girls Pune | Whatsapp No 8005736733 VIP Escorts Service...
 
VIP Call Girls Junagadh 7001035870 Whatsapp Number, 24/07 Booking
VIP Call Girls Junagadh 7001035870 Whatsapp Number, 24/07 BookingVIP Call Girls Junagadh 7001035870 Whatsapp Number, 24/07 Booking
VIP Call Girls Junagadh 7001035870 Whatsapp Number, 24/07 Booking
 
Editing progress 20th march.docxxxxxxxxx
Editing progress 20th march.docxxxxxxxxxEditing progress 20th march.docxxxxxxxxx
Editing progress 20th march.docxxxxxxxxx
 
AMG Quarterly Investor Presentation May 2024
AMG Quarterly Investor Presentation May 2024AMG Quarterly Investor Presentation May 2024
AMG Quarterly Investor Presentation May 2024
 
Corporate Presentation Probe May 2024.pdf
Corporate Presentation Probe May 2024.pdfCorporate Presentation Probe May 2024.pdf
Corporate Presentation Probe May 2024.pdf
 
VVIP Pune Call Girls Parvati Gaon WhatSapp Number 8005736733 With Elite Staff...
VVIP Pune Call Girls Parvati Gaon WhatSapp Number 8005736733 With Elite Staff...VVIP Pune Call Girls Parvati Gaon WhatSapp Number 8005736733 With Elite Staff...
VVIP Pune Call Girls Parvati Gaon WhatSapp Number 8005736733 With Elite Staff...
 
Teekay Tankers Q1-24 Earnings Presentation
Teekay Tankers Q1-24 Earnings PresentationTeekay Tankers Q1-24 Earnings Presentation
Teekay Tankers Q1-24 Earnings Presentation
 
VVIP Pune Call Girls Sopan Baug WhatSapp Number 8005736733 With Elite Staff A...
VVIP Pune Call Girls Sopan Baug WhatSapp Number 8005736733 With Elite Staff A...VVIP Pune Call Girls Sopan Baug WhatSapp Number 8005736733 With Elite Staff A...
VVIP Pune Call Girls Sopan Baug WhatSapp Number 8005736733 With Elite Staff A...
 
Western Copper and Gold - May 2024 Presentation
Western Copper and Gold - May 2024 PresentationWestern Copper and Gold - May 2024 Presentation
Western Copper and Gold - May 2024 Presentation
 
Terna - 1Q 2024 Consolidated Results Presentation
Terna - 1Q 2024 Consolidated Results PresentationTerna - 1Q 2024 Consolidated Results Presentation
Terna - 1Q 2024 Consolidated Results Presentation
 
countries with the highest gold reserves in 2024
countries with the highest gold reserves in 2024countries with the highest gold reserves in 2024
countries with the highest gold reserves in 2024
 
Collective Mining | Corporate Presentation - May 2024
Collective Mining | Corporate Presentation - May 2024Collective Mining | Corporate Presentation - May 2024
Collective Mining | Corporate Presentation - May 2024
 
Best investment platform in india-Falcon Invoice Discounting
Best investment platform in india-Falcon Invoice DiscountingBest investment platform in india-Falcon Invoice Discounting
Best investment platform in india-Falcon Invoice Discounting
 
VVIP Pune Call Girls Handewadi WhatSapp Number 8005736733 With Elite Staff An...
VVIP Pune Call Girls Handewadi WhatSapp Number 8005736733 With Elite Staff An...VVIP Pune Call Girls Handewadi WhatSapp Number 8005736733 With Elite Staff An...
VVIP Pune Call Girls Handewadi WhatSapp Number 8005736733 With Elite Staff An...
 
Teekay Corporation Q1-24 Earnings Results
Teekay Corporation Q1-24 Earnings ResultsTeekay Corporation Q1-24 Earnings Results
Teekay Corporation Q1-24 Earnings Results
 
(INDIRA) Call Girl Kashmir Call Now 8617697112 Kashmir Escorts 24x7
(INDIRA) Call Girl Kashmir Call Now 8617697112 Kashmir Escorts 24x7(INDIRA) Call Girl Kashmir Call Now 8617697112 Kashmir Escorts 24x7
(INDIRA) Call Girl Kashmir Call Now 8617697112 Kashmir Escorts 24x7
 
Teck Supplemental Information, May 2, 2024
Teck Supplemental Information, May 2, 2024Teck Supplemental Information, May 2, 2024
Teck Supplemental Information, May 2, 2024
 
VIP Call Girls Mehsana 7001035870 Whatsapp Number, 24/07 Booking
VIP Call Girls Mehsana 7001035870 Whatsapp Number, 24/07 BookingVIP Call Girls Mehsana 7001035870 Whatsapp Number, 24/07 Booking
VIP Call Girls Mehsana 7001035870 Whatsapp Number, 24/07 Booking
 
B2 Interpret the brief.docxccccccccccccccc
B2 Interpret the brief.docxcccccccccccccccB2 Interpret the brief.docxccccccccccccccc
B2 Interpret the brief.docxccccccccccccccc
 

Ferrovial Overview 2014

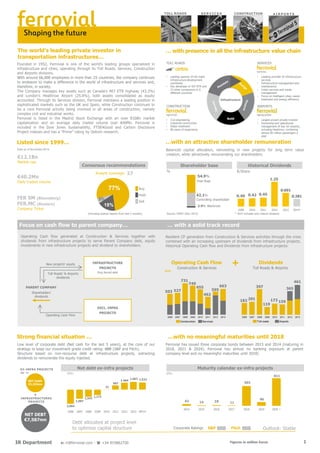
  • 1. CONSTRUCTION A I RPORT S ferrovial S ERV I C E S Shaping the future Listed since 1999… …with an attractive shareholder remuneration Data as of November 2014 €40.2Mn Daily traded volume FER SM (Bloomberg) FER.MC (Reuters) Company Ticker Historical Dividends * 2014 includes only interim dividend Shareholder base % Source: CNMV (Nov 2014) Consensus recommendations 27 Focus on cash flow to parent company… … with a solid track record New projects’ equity Toll Roads' & Airports dividends €12.1Bn Market cap. PARENT COMPANY Shareholders’ dividends Operating Cash Flow Analyst coverage: Buy Hold Sell 5% 77% 18% (including analyst reports from last 3 months) INFRASTRUCTURE PROJECTS Ring fenced debt EXCL. INFRA PROJECTS TOLL ROADS TOLL ROADS • Leading sponsor of toll roads infrastructure development worldwide • Key developer of 407 ETR and 23 other concessions in 6 different countries CONSTRUCTION • Civil engineering • Industrial construction • Water treatment • 80 years of experience SERVICES • Leading provider of infrastructure services • Infrastructure management and maintenance • Urban services and waste management • Focus on intelligent cities, waste treatment and energy efficiency AIRPORTS • Largest airport private investor • Ownership and operational management of key UK airports, including Heathrow, combining almost 85 million passengers a year Balanced capital allocation, reinvesting in new projects for long term value creation, while attractively remunerating our shareholders. €/Share 0.40 0.42 0.45 1.25 0.691 0.381 2009 2010 2011 2012 2013 2014* + 54.9% Free-float 42.1% Controlling shareholder 2.9% Blackrock Operating Cash Flow Dividends Construction & Services Toll Roads & Airports 731 €Mn 503 527 749 655 462 595 663 2006 2007 2008 2009 2010 2011 2012 2013 Construction Services 182 201 397 119 173 159 365 461 2006 2007 2008 2009 2010 2011 2012 2013 Toll roads Airports Strong financial situation … …with no meaningful maturities until 2018 Net debt ex-infra projects Maturity calendar ex-infra projects 43 14 18 11 501 96 811 2014 2015 2016 2017 2018 2019 2020 + Corporate Ratings S&P BBB Fitch BBB The world's leading private investor in transportation infrastructures… Founded in 1952, Ferrovial is one of the world's leading groups specialized in infrastructure and cities, operating through its Toll Roads, Services, Construction and Airports divisions. With around 66,000 employees in more than 25 countries, the company continues to endeavor to make a difference in the world of infrastructure and services and, therefore, in society. The Company manages key assets such as Canada's 407 ETR highway (43.2%) and London's Heathrow Airport (25.0%), both assets consolidated as equity accounted. Through its Services division, Ferrovial maintains a leading position in sophisticated markets such as the UK and Spain, while Construction continues to be a core Ferrovial activity being involved in all areas of construction, namely complex civil and industrial works. Ferrovial is listed in the Madrid Stock Exchange with an over €10Bn market capitalization and an average daily traded volume over €40Mn. Ferrovial is included in the Dow Jones Sustainability, FTSE4Good and Carbon Disclosure Project indexes and has a “Prime” rating by Oekom research. … with presence in all the infrastructure value chain Resilient CF generation from Construction & Services activities through the crisis combined with an increasing upstream of dividends from infrastructure projects. Historical Operating Cash flow and Dividends from infrastructure projects: Operating Cash flow generated at Construction & Services together with dividends from infrastructure projects to serve Parent Company debt, equity investments in new infrastructure projects and dividend to shareholders. Low level of corporate debt (Net cash for the last 5 years), at the core of our strategy to keep our investment grade credit rating: BBB (S&P and Fitch). Structure based on non-recourse debt at infrastructure projects, extracting dividends to remunerate the equity injected. Ferrovial has issued three corporate bonds between 2013 and 2014 (maturing in 2018, 2021 & 2024). Ferrovial has almost no banking exposure at parent company level and no meaningful maturities until 2018) €Mn 3,064 1,987 1,547 1,172 31 907 1.484 1.663 1.533 2006 2007 2008 2009 2010 2011 2012 2013 9M'14 €Mn Debt allocated at project level to optimise capital structure Outlook: Stable EX-INFRA PROJECTS 9M ‘14 NET CASH €1,533mn INFRASTRUCTURES PROJECTS NET DEBT €7,587mn IR Department e: ir@ferrovial.com - +34 915862730 Figures in million Euros 1
  • 2. Ferrovial, vision and values Ferrovial has distinguished itself, above all, for its excellent professionals. Hard work and creativity centered on performance, have allowed us to overcome complex challenges and to take advantage of opportunities, transforming individual skills into collective success. Ferrovial, as a leading developer and operator in the infrastructure and services sector, will continue to shape the future of society with a continuous focus on talent, integrity, safety, excellence and innovation.” (Rafael del Pino, Ferrovial ‘s Chairman) ferrovial 2010 2011 2012 2013 Total Investment (b) -420 -328 -320 -754 Total Divestment (c) 1,124 1,264 893 564 Activity Cash Flow (a+b+c) 1,515 1,447 1,486 858 Interest Payment -138 -114 -32 -46 Others 147 -81 -48 -49 Dividend to Shareholders -320 -376 -826 -523 Net Cash Generation 1.204 875 583 180 2013 Cash flow ex-infra projects performance 2010 2011 2012 2013 Construction 373 298 100 304 Services 282 164 495 359 Dividends from Highways 170 159 220 242 Dividends from Airports 2 0 145 219 Others 43 -43 -16 -27 Taxes -60 -67 -30 -48 Operating Cash Flow (a) 811 511 914 1,048 A well-balanced international portfolio*… ...translates into diversified cash flows * 2013 FY - Proportionally considering Ferrovial stake in each project. Revenues EBITDA* €9,162mn €1,681mn Services Toll Roads Construction Airports 20% 29% 32% 19% 43% 24% 22% 11% UK N. America Spain RoW 11% 42% 8% 39% Ferrovial geographical business diversification implies a well balanced portfolio, with airports as the largest contributor to adjusted Ebitda* (32% weight in 2013). Services A recurrent cash flow generator with a long duration backlog providing long term visibility “Integrated service management” to maximize infrastructure asset value throughout their lifecycle. Strong cash flow generation and resilient performance in a difficult economic context. Enterprise acquisition at £385Mn (€474Mn), in April 2013, to generate value mainly through synergies, with an IRR estimated at c.15%. After the integration of Enterprise the UK will gain weight reaching more than 60% of the Division backlog. Cash flow generation due to International growth despite declining Spanish market. International backlog was 70% at FY2013, with US 38% and Poland 14% being the main markets where we do have “local” presence through Budimex and Webber (Texas). Significant international contracts awarded in 2013, most of them with our own Toll Roads division (M8 in Scotland and NTE 3A3B in Texas), with the internal backlog being over 32% at FY2013. Ebitda generated in the UK and North America accounted for over 67% of adjusted Ebitda*. Reveues Backlog UK Spain 1% 36% 63% 2% 39% 59% International Construction A proven competitive tool to success in bidding for greenfield infrastructure projects Geographical Work Industrial Backlog breakdown Residential other 2% Civil works Domestic International* 30% 70% 20% 78% 2,328 5,539 IR Department e: ir@ferrovial.com - +34 915862730 Figures in million Euros 2
  • 3. 20.16 Corporate Responsibility Plan Ferrovial is a financially, ethically, socially and environmentally sustainable company. To achieve this, every three years Ferrovial updates its CR Strategic Plan. The 20.16 CR Plan, approved in January 2014, defines Ferrovial’s main sustainability items for the next few years and renews its commitments at the same time it reinforces its alignment with the business priorities. Corportate governance, Ethics and Integrity, People, The environment, Society and Innovation are its main areas of action. Toll Roads A world leading private developer of infrastructures, focus MAIN ASSETS on value creation through risk management Managed Investment 44% 20% 36% US Canada Europe We manage a portfolio of 24 concessions with a total of 2,100kms, distributed throughout Canada, the United States, Spain, Portugal, Ireland and Greece. Our portfolio is its long duration (average maturity 50 years) with attractive tariffs schemes, allowing in many cases to increase them above inflation rates. Principally explicit toll projects, where the concession holder profitability is not capped, resulting in a potential value creation for the long term. 3 main assets in the US (managed lanes) at initial phases of activity; 2 under development one recently opened in Oct 2014. Managed lane concept based in congestion management through dynamic tolling, to offer a solution to congested urban corridors. Concession Km Managed Investment % Cintra % Ferrovial Status Net debt Dic-2013 Maturity Country North Tarrant Express 21,4 1.541 56,7 56,7 Under Development -578 2061 USA NTE (3A/3B) 16,4 970 50,1 50,1 Under Development -38 2061 USA LBJ Express 27,4 1.901 51,0 51,0 Under Development -910 2061 USA Indiana Toll Road 252,7 3.044 25,5 50,0 Operation -2.778 2081 USA Chicago Skyway 12,5 1.391 55,0 55,0 Operation -1.068 2104 USA SH-130 64,0 1.048 65,0 65,0 Operation -862 2062 USA Almanzora 41,5 146 23,8 23,8 Under Development 0 2041 Spain Autovía de la Plata 49,0 191 25,0 25,0 Under Development -29 2042 Spain Autema 48,3 233 76,3 76,3 Operation -666 2036 Spain 2046 (Ausol I) Spain 2054 (Ausol II) Spain Autopista del Sol 105,2 729 80,0 80,0 Operation -453 Madrid - Sur 97,2 1.351 55,0 55,0 Operation -601 2065 Spain Madrid - Levante 182,8 540 51,8 53,7 Operation -542 2040 Spain Alcalá - O´Donnell 15,3 99 100,0 100,0 Under Development 0 2065 Spain SerranoPark 3,297 spaces 76 50,0 50,0 Operation -47 2048 Spain ViaLivre 174,5 84,0 84,0 Operation 8 2031 Portugal Euroscut Algarve 129,8 264 77,0 85,0 Operation -149 2030 Portugal Norte Litoral 119,0 386 75,5 84,0 Operation -209 2031 Portugal Euroscut Azores 93,7 386 89,0 89,2 Operation -334 2036 Portugal M4-M6 Highway 36,0 340 66,0 66,0 Operation -112 2033 Ireland M3 Highway 50,0 549 95,0 95,0 Operation -199 2052 Ireland Ionian Roads 378,7 33,3 33,3 Under Development 51 2037 Greece Central Greece 231,0 33,3 33,3 Under Development -348 2038 Greece 407 EDG 35,0 637 50,0 50,0 Under Development -133 2045 Canada 407 ETR 108,0 3.161 43,2 43,2 Operation -3.806 2098 Canada 407 ETR 43.2% stake in 407 ETR (equity accounted) Located in Toronto, Ontario (Canada), it runs parallel to the first city ring road, the 401, one of North America's most congested toll roads. One of the most valuable assets in infrastructure world, given traffic robustness, possibility to almost freely establish the tariffs(*) and LT duration (84Y remaining to 2098). (CADMn) (CADMn) 408 EBITDA Net Debt/EBITDA Dividends 665 2007 2008 2009 2010 2011 2012 2013 27X 8.4X 1999 2013 85 145 120 135 190 300 459 600 680 2005 2006 2007 2008 2009 2010 2011 2012 2013 Resilient performance through the crisis, involving a strong deleverage process since acquisition in 1999, allowing to an increasing dividend distribution policy. *Toll-setting freedom: Toll charges varied freely provided that traffic is above a certain threshold. The user pays according to the timesaving provided by the highway. Airports 25.0%stake in Heathrow Airports Holding (Equity accounted) MAIN ASSETS Following the acquisition of BAA Airports Limited in June 2006 (renamed HAH Airports in Oct 2012), Ferrovial became the leading private infrastructure operator in the world, with four airports in the UK including Heathrow (as well as Glasgow, Southampton Aberdeen), with 84.9mn passengers in 2013. After recent stake divestments, Ferrovial holds 25.0% in the company with Qatar (20%), Brittania (13.29%), GIC (11.88%), Alinda (11.18%), CIC (10%) and USS (8.65%) holding the rest, providing a quality shareholding structure involving sovereign funds of Qatar, China Singapore and one of the largest pension schemes in the UK (USS). Heathrow Airport, 15 miles from central London, is regarded as the hub of the aviation world. Flying more than 72mn passengers to over 180 destinations in over 90 countries each year, it's no wonder that some 90 airlines operate from Heathrow. Operating improvement at Heathrow Departures punctuality 63% 79% 2007 9m'14 % Passengers rating Heathrow “Excellent” or “Very Good” Missed bags per 1,000 passengers 48% 75% 2007 9m'14 40 19 2007 9m'14 (£Mn) 559 1,310 EBITDA 2007 2008 2009 2010 2011 2012 2013 In 2013 Heathrow distributed dividends to its shareholders amounting £555Mn: a regular dividend (£255Mn) and an extraordinary payment (£300Mn) following the disposal of Stansted. Heathrow’s intends to keep a recurrent dividend with sustainable growth (expected regular dividend of £270Mn for 2014, £203Mn paid as of 9M14). IR Department e: ir@ferrovial.com - +34 915862730 3
  • 4. 2014 Highlights Location: North of Charlotte, North Carolina Customer: North Carolina Department of Project: 2 managed lanes in each direction Purpose: Desing, construction, funding, Opening: Scheduled for mid-2018. Concession start date: 2018 Concession end date: 2068 Duration: 50 years Construction: Joint Venture: Ferrovial Agroman Length of the highway: 26 miles Sections: • Southern Section: 2.2 miles Managed Investment: $655m (€478Mn) Tariffic Policy: Developer has total freedom to set Payment methods: Electronic tolling system DESCRIPTION: Dallas-Fort Worth Metroplex, Major thoroughfares between Fort Worth and DFW Airport Transportation (NCDoT) of I-77 highway between the links to the I-277 in Charlote and NC-150 in Iredell County operation and maintenance W.C. English (US). • Central Section: 14.9 miles • Northern Section: 8.8 miles toll rates along the corridor FINANCIAL STRUCTURE Heathrow airport Opening T2 (June ‘14) • c.350 flights per day • 40,000 passengers per day Highest ever passenger satisfaction Departures punctuality % passengers rating 63% 79% 2007 9M 2014 21% 52% 27% EQUITY DEBT PUBLIC FUNDS TOTAL INVESTMENT: 2.05Bn EQUITY: 21% 427Mn ($Mn) CINTRA: 243Mn (57%) MERIDIEM: 141mn (33%) DPFPS: 43mN (10%) TOTAL DEBT: 52% 1,050Mn PABs: 400Mn TIFIA: 650Mn 27% PUBLIC FUNDS: 537Mn (€Mn) PL and selected figures Balance sheet OCT NTE Managed Lane opened to public (9 months ahead of schedule) Indicative non binding offer for 100% of Transfield Services (Australia) Offer for 6.5% stake in AENA (subject to IPO) Agreement of Ferrovial Airports Macquarie (50/50) to acquire 100% of Aberdeen, Glasgow Southampton airports NOV 2nd scrip dividend paid (equiv. to 2014 interim), €0.381 APR Liquidity line agreed (€750mn, 5Y, with 12 banks, cost of 80bps). JUN I-77 highway concession awarded Approval of share buy-back programme (up to 3.5% of capital/€350mn) JUL 3rd corporate bond issued (€300mn, 10Y, 2.5% fixed). SP upgraded Ferrovial from BBB- to BBB, stable outlook. 1st scrip dividend paid (equiv. to 2013 complementary), €0.291 I-77 Highway (North Carolina) award and financial close (June ’14) LENGTH: 13 mile section (IH820 SH183 in Tarrant County) CONCESSION PERIOD: 52 years TARIFF POLICY: Open Road Tolling System (no toll booths) with a dynamic tolling (every 5 minutes) to maintain a minimum speed of 50 mph 57% 33% 10% CINTRA MERIDIAM DALLAS FIREPOLICE PENSION SCHEME SHAREHOLDERS’ STRUCTURE NTE opening (Oct ’14) 2010 2011 2012 2013 Revenues 9.384 7.446 7.630 8.166 EBITDA 1.246 818 927 934 EBIT 961 625 708 701 Financial result -704 -303 -301 -333 Net Income 2.163 1.243 692 727 Market Capitalization 5.457 6.840 8.215 10.317 Employees 100.995 69.990 57.276 66.088 Construction backlog 10.186 9.997 8.699 7.867 Services backlog 12.378 12.425 12.784 17.749 Third runway Heathrow’s proposal shortlisted for further analysis (Airports Commission) Heathrow “Excellent” or “Very good” Missed bags per 1,000 passengers 48% 78% 2007 9M 2014 40 19 2007 9M 2014 KEY CHARACTERISTICS Heavy congestion. No toll-booths, fully electronic free flow tolling system. Tollway within a freeway: choice of driving in non-tolled or tolled lanes. Tolls set to ensure min. speed on new lanes. As demand grows capacity becomes scarce, pricing power increases. Physically separated from the GP lanes with controlled access. FINANCIAL OVERVIEW First combination of TIFIA and tax exempt PABs. First un-wrapped bond issuance for a toll road. First time TIFIA allowed additional debt to be raised beyond its approved federal subsidy cap. First time that a U.S.-based pension fund made a direct investment in a highway concession. 2010 2011 2012 2013 2010 2011 2012 2013 Equity 6.628 6.246 5.780 6.074 Deferred Income 196 292 356 503 Long Term Assets 35.465 17.500 16.660 17.142 Long Term Liabilities 28.596 10.806 11.117 11.230 Investments in infra. projects 21.512 5.960 6.755 7.639 Financial Debt 21.511 6.695 6.996 7.496 Equity-consolidated companies 3.110 5.199 4.322 3.562 Debt at Infra. Projects 19.566 5.503 5.825 6.403 Long Term financial assets 2.184 1.912 1.674 1.810 Debt Ex_Infra. Projects 1.944 1.192 1.171 1.093 Short Term Assets 6.306 5.452 5.570 5.678 Short Term Liabilities 6.975 5.606 4.976 5.013 Trade other receivables 3.161 2.673 2.198 2.202 Trade and other payables 4.889 3.882 3.267 3.254 Cash other financial investments 2.701 2.349 2.967 3.130 Financial Debt 1.530 1.214 1.229 1.303 Cash at Infra. Projects 694 188 237 279 Debt at Infra. Projects 1.415 1.145 1.168 1.228 Cas Ex_Infra. Projects 2.007 2.161 2.730 2.851 Debt Ex_Infra. Projects 116 69 61 75 Total Assets 43.287 22.951 22.230 22.820 Total Liabilities Equity 43.287 22.951 22.230 22.820 Consolidated figures IR Department e: ir@ferrovial.com - +34 915862730 4
  • 5. Human resources Promoting the professional development of all its employees is amongst Ferrovial’s strategic priorities. The combination of the talent and commitment of Ferrovial’s professionals is one of the pillars of the company’s success in infrastructure management. ESTRATEGY A) Talent management Through consolidated Evaluation Processes, such as 360º Feedback for management; Succession Plans, to review more than 700 people for the identification of successors and the analysis of management positions and Talent Identification Programmes. 13 (9%) 13 (100%) 6 Same business Different business (46%) 7 (54%) Changes in senior management positions Internal appointments Additionally, since 2007 the Corporate University provides training for more than 3,000 students each year, wihch accounted for nearly 1,300.00 hours in 2013. B) Commitment The company’s rotation index is 2.9% and 8 out of 10 employees would recommend Ferrovial as a good company to work for: Environment EQUALITY Ferrovial ensures that all employees enjoy equal opportunities to develop their professional careers on the basis of merit, confirmed by its Distinguished Equal Opportunities Company award in 2010, which remains in force until 2016. HEALTH SAFETY In 2013, Ferrovial’s accident rate maintained its downward path. In particular, an analysis of the reduction of more than 18% in the Frequency Index, more than 8% in the Incident Index and 22% in the Severity Index. 43.7 39.9 0.5 0.4 25.7 21.1 WORKFORCE (June 2014) At the end of June 2014, the average workforce numbered 66,862 employees. 45% carry out their activities outside Spain, and 16% work part time; by type of contract, 82% are on permanent contracts. 30% of total employees are female, and 14% of senior management. Key magnitudes and % satisfaction FREQUENCY INDEX: Number of accidents resulting in time off work occurred during the working day per million hours worked. The result is expressed per million. INCIDENT INDEX: Number of accidents resulting in time off work that occurred during the working day per thousand employees exposed. SEVERITY INDEX: Number of working days lost due to accidents at work per thousand hours worked. The result is expressed per thousand. Men Women Total Construction 11,052 1,494 12,546 Corporation 198 139 337 Real Estate 28 47 75 Services 34,810 18,172 52,982 Concessions 599 291 890 Airports 19 13 32 Total 46,706 20,156 66,862 Environmental sustainability plays an increasingly relevant role for Ferrovial. Beyond its commitment to reduce the environmental impact of its activities worldwide, the company considers that global challenges such as climate change, the energy crisis and the loss of biodiversity should not only be tackled with the responsibility expected of a global company, but also that they could become a source of new opportunities in the medium and long term. ENVIRONMENTAL MANAGEMENT SYSTEMS In 2013, 88% of group sales were covered by environmental management systems certified by independent entities (under ISO 14001 and EMAS standards). Meanwhile, quality certificates increased by 11%, reaching 90% of total group sales. For the last 13 consecutive years Ferrovial has been included in the DJSI (Dow Jones Sustainability Index) at a global level. With a mark of 99 out of 100, Ferrovial leads the CDP (Carbon Disclosure Project) ratings in all its activity sectors on a global scale. CDP is investors’ principal reference for evaluating how companies deal with the risks and opportunities related to climate change. GREENHOUSE GAS EMISSIONS 31.6% reduction in greenhouse gas emissions since 2009. 2013 -31.6% FOSSIL FUEL EMISSIONS AND ELECTRICITY In 2013, Ferrovial consumed 37.8% more energy from renewable sources than in the previous year. WATER Water consumption of 1,933,592 m3 was 28.4% less than during 2012. RECYCLING In 2013, Ferrovial recycled a total of 97,840 tonnes. Non financial information IR Department e: ir@ferrovial.com - +34 915862730 5
  • 6. Innovation Environmental sustainability plays an increasingly relevant role for Ferrovial. Beyond its commitment to reduce the environmental impact of its activities worldwide, the company considers that global challenges such as climate change, the energy crisis and the loss of biodiversity should not only be tackled with the responsibility expected of a global company, but also that they could become a source of new opportunities in the medium and long term. INVESTMENT IN INNOVATION Through consolidated Evaluation Processes, such as 360º Feedback for management; Succession Plans, to review more than 700 people for the identification of successors and the analysis of management positions and Talent Identification Programmes. RD Investment (€Mn) 2013 2012 2011 2010 32.9 32.6 51.32 45 Ferrovial fosters a policy of open innovation, in the form of creating an ecosystem of partners in the community. The innovation strategy is on three levels: − A common government to establish the innovation strategy. − An ecosystem – public authorities, innovation centres, large companies, SMEs, start-ups – that seeks to create the appropriate cultural climate. − The necessary resources for their development: information, financing, public programmes, etc. INNOVATION PROJECTS The important milestones in Ferrovial’s growth are inseparable from its projects. Ferrovial has defined seven priority areas for action: airports, water, motorways, intelligent cities, innovative construction, energy efficiency and waste evaluation. Living Lab Guadalajara Within the intelligent cities area, the Living Lab Guadalajara is conceived as a space to unfold new technologies that transform and improve urban services, resulting in a better quality of life for its inhabitants. Projects with MIT The “System for Waste Separation and Evaluation” project started with the objective of improving the operations and design of the urban waste separation and treatment plants, which is being worked on by a group of researchers from the Massachusetts Institute of Technology (MIT), in coordination with Ferrovial Servicios. The project, which started in June 2014, will imply an investment of €231,000. Ferrovial Innovation Awards Ferrovial is aware that innovation can emerge anywhere, and as a result has organised a second eddition of its “Ferrovial Innovation Awards” – Zuritanken – inviting its employees to offer solutions to four challenges (one for each business unit): Services, Toll Roads, Construction and Airports. The results of this second round are shown below: 636 Participants 677 Ideas 45% teams vs. 55% individuals Madrid Smart Lab The city competition centre runs the Madrid Smart Lab programme, to develop innovation projects in cooperation with the local council to improve local mobility and quality of life. 59 Proposals 31 Mobility 28 Quality of life say on pay Fixed Variable LT incentives 2010 Grant 0 200,000 400,000 Euros Percentile 75 0-25%il 25-50%il 50-75%il 75-90%il Percentile 25 Percentile 90 Mean Media ferrovial Source: Towers Watson PRESIDENT CEO REMMUNERATION 2013: balanced contribution between fix, variable and long term incentives: BOARD REMMUNERATION non executive Ferrovial compares with IBEX35 and is in the average compensation of that group. 22% 39% 39%