1. PRESS/855
8 April 2020
(20-2749) Page: 1/13
PRESS RELEASE
E M B A R G O
N O T F O R P U B L I C A T I O N , O R D I S T R I B U T I O N B Y N E W S A G E N C I E S
U N T I L 1 5 : 0 0 H G E N E V A T I M E 8 A P R I L 2 0 2 0
TRADE STATISTICS AND OUTLOOK
Trade set to plunge as COVID-19 pandemic upends global
economy
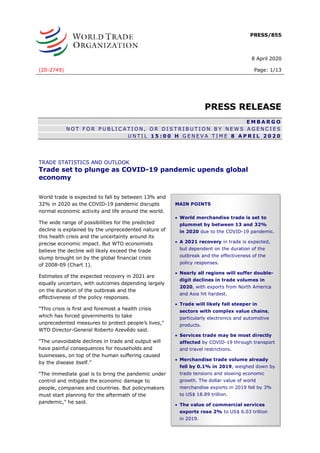
World trade is expected to fall by between 13% and
32% in 2020 as the COVID-19 pandemic disrupts
normal economic activity and life around the world.
The wide range of possibilities for the predicted
decline is explained by the unprecedented nature of
this health crisis and the uncertainty around its
precise economic impact. But WTO economists
believe the decline will likely exceed the trade
slump brought on by the global financial crisis
of 2008-09 (Chart 1).
Estimates of the expected recovery in 2021 are
equally uncertain, with outcomes depending largely
on the duration of the outbreak and the
effectiveness of the policy responses.
"This crisis is first and foremost a health crisis
which has forced governments to take
unprecedented measures to protect people’s lives,"
WTO Director-General Roberto Azevêdo said.
"The unavoidable declines in trade and output will
have painful consequences for households and
businesses, on top of the human suffering caused
by the disease itself.”
“The immediate goal is to bring the pandemic under
control and mitigate the economic damage to
people, companies and countries. But policymakers
must start planning for the aftermath of the
pandemic,” he said.
MAIN POINTS
• World merchandise trade is set to
plummet by between 13 and 32%
in 2020 due to the COVID-19 pandemic.
• A 2021 recovery in trade is expected,
but dependent on the duration of the
outbreak and the effectiveness of the
policy responses.
• Nearly all regions will suffer double-
digit declines in trade volumes in
2020, with exports from North America
and Asia hit hardest.
• Trade will likely fall steeper in
sectors with complex value chains,
particularly electronics and automotive
products.
• Services trade may be most directly
affected by COVID-19 through transport
and travel restrictions.
• Merchandise trade volume already
fell by 0.1% in 2019, weighed down by
trade tensions and slowing economic
growth. The dollar value of world
merchandise exports in 2019 fell by 3%
to US$ 18.89 trillion.
• The value of commercial services
exports rose 2% to US$ 6.03 trillion
in 2019.
2. PRESS/855
- 2 -
“These numbers are ugly – there is no getting around that. But a rapid, vigorous rebound is
possible. Decisions taken now will determine the future shape of the recovery and global growth
prospects. We need to lay the foundations for a strong, sustained and socially inclusive recovery.
Trade will be an important ingredient here, along with fiscal and monetary policy. Keeping markets
open and predictable, as well as fostering a more generally favourable business environment, will
be critical to spur the renewed investment we will need. And if countries work together, we will see
a much faster recovery than if each country acts alone."
Chart 1 - World merchandise trade volume, 2000-2022
Index, 2015=100
Source: WTO Secretariat.
Trade was already slowing in 2019 before the virus struck, weighed down by trade tensions and
slowing economic growth. World merchandise trade registered a slight decline for the year
of -0.1% in volume terms after rising by 2.9% in the previous year. Meanwhile, the dollar value of
world merchandise exports in 2019 fell by 3% to US$ 18.89 trillion.
In contrast, world commercial services trade increased in 2019, with exports in dollar terms rising
by 2% to US$ 6.03 trillion. The pace of expansion was slower than in 2018, when services trade
increased by 9%. Details on merchandise and commercial services trade developments are
presented in Appendix Tables 1 through 4 and can be downloaded from the WTO Data Portal at
data.wto.org.
Outlook for trade in 2020 and 2021
The economic shock of the COVID-19 pandemic inevitably invites comparisons to the global
financial crisis of 2008-09. These crises are similar in certain respects but very different in others.
As in 2008-09, governments have again intervened with monetary and fiscal policy to counter the
downturn and provide temporary income support to businesses and households. But restrictions on
movement and social distancing to slow the spread of the disease mean that labour supply,
transport and travel are today directly affected in ways they were not during the financial crisis.
40
50
60
70
80
90
100
110
120
130
140
2000
2001
2002
2003
2004
2005
2006
2007
2008
2009
2010
2011
2012
2013
2014
2015
2016
2017
2018
2019
2020
2021
2022
Merchandise trade Optimistic scenario Pessimistic scenario
Trend 1990-2008 Trend 2011-2018
3. PRESS/855
- 3 -
Whole sectors of national economies have been shut down, including hotels, restaurants, non-
essential retail trade, tourism and significant shares of manufacturing. Under these circumstances,
forecasting requires strong assumptions about the progress of the disease and a greater reliance
on estimated rather than reported data.
Future trade performance as summarized in Table 1 is thus best understood in terms of two
distinct scenarios1
: (1) a relatively optimistic scenario, with a sharp drop in trade followed by a
recovery starting in the second half of 2020, and (2) a more pessimistic scenario with a steeper
initial decline and a more prolonged and incomplete recovery.
These should be viewed as explorations of different possible trajectories for the crisis rather than
specific predictions of future developments. Actual outcomes could easily be outside of this range,
either on the upside or the downside.
Under the optimistic scenario, the recovery will be strong enough to bring trade close to its pre-
pandemic trend, represented by the dotted yellow line in Chart 1, while the pessimistic scenario
only envisages a partial recovery. Given the level of uncertainties, it is worth emphasizing that the
initial trajectory does not necessarily determine the subsequent recovery. For example, one could
see a sharp decline in 2020 trade volumes along the lines of the pessimistic scenario, but an
equally dramatic rebound, bringing trade much closer to the line of the optimistic scenario by 2021
or 2022.
After the financial crisis of 2008-09, trade never returned to its previous trend, represented by the
dotted grey line in the same chart. A strong rebound is more likely if businesses and consumers
view the pandemic as a temporary, one-time shock. In this case, spending on investment goods
and consumer durables could resume at close to previous levels once the crisis abates. On the
other hand, if the outbreak is prolonged and/or recurring uncertainty becomes pervasive,
households and business are likely to spend more cautiously.
Under both scenarios, all regions will suffer double-digit declines in exports and imports in 2020,
except for “Other regions” (which is comprised of Africa, Middle East and Commonwealth of
Independent States (CIS) including associate and former member States). This relatively small
estimated decline in exports stems from the fact that countries from these regions rely heavily on
exports of energy products, demand for which is relatively unaffected by fluctuating prices. If the
pandemic is brought under control and trade starts to expand again, most regions could record
double-digit rebounds in 2021 of around 21% in the optimistic scenario and 24% in the pessimistic
scenario – albeit from a much lower base (Table 1). The extent of uncertainty is very high, and it
is well within the realm of possibilities that for both 2020 and 2021 the outcomes could be above
or below these outcomes.
1
How these scenarios were generated is discussed in a background document that can be downloaded
on the WTO website here.
4. PRESS/855
- 4 -
Chart 2 - Ratio of world merchandise trade growth to world GDP growth, 1990-2020
% change and ratio
Source: WTO Secretariat for trade and consensus estimates for historical GDP. Projections for GDP based on
scenarios simulated with WTO Global Trade Model.
Two other aspects that distinguish the current downturn from the financial crisis are the role of
value chains and trade in services. Value chain disruption was already an issue when COVID-19
was mostly confined to China. It remains a salient factor now that the disease has become more
widespread. Trade is likely to fall more steeply in sectors characterized by complex value chain
linkages, particularly in electronics and automotive products. According to the OECD Trade In
Value Added (TiVa) database, the share of foreign value added in electronics exports was around
10% for the United States, 25% for China, more than 30% for Korea, greater than 40% for
Singapore and more than 50% for Mexico, Malaysia and Vietnam. Imports of key production inputs
are likely to be interrupted by social distancing, which caused factories to temporarily close in
China and which is now happening in Europe and North America. However, it is also useful to recall
that complex supply chain disruption can occur as a result of localized disasters such hurricanes,
tsunamis, and other economic disruptions. Managing supply chain disruption is a challenge for
both global and local enterprises and requires a risk-versus-economic efficiency calculation on the
part of every company.
Services trade may be the component of world trade most directly affected by COVID-19 through
the imposition of transport and travel restrictions and the closure of many retail and hospitality
establishments. Services are not included in the WTO's merchandise trade forecast, but most trade
in goods would be impossible without them (e.g. transport). Unlike goods, there are no inventories
of services to be drawn down today and restocked at a later stage. As a result, declines in services
trade during the pandemic may be lost forever. Services are also interconnected, with air transport
enabling an ecosystem of other cultural, sporting and recreational activities. However, some
services may benefit from the crisis. This is true of information technology services, demand for
which has boomed as companies try to enable employees to work from home and people socialise
remotely.
3.6
1.5
2.4
2.8 2.9 3.0
2.6
1.6
2.5
1.7 1.6
2.5
-0.2
1.6
2.0
2.5
1.8
2.0
1.7
1.5
6.3
3.4
1.8
1.0 1.0 0.9
0.8
0.6
1.5
1.0
0.0
5.3
-1.0
0.0
1.0
2.0
3.0
4.0
5.0
6.0
7.0
-40.0
-30.0
-20.0
-10.0
0.0
10.0
20.0
30.0
40.0
1990
1991
1992
1993
1994
1995
1996
1997
1998
1999
2000
2001
2002
2003
2004
2005
2006
2007
2008
2009
2010
2011
2012
2013
2014
2015
2016
2017
2018
2019
2020
World trade volume growth (left axis) World GDPgrowth (left axis)
Ratio of trade growth to GDP growth (right axis)
5. PRESS/855
- 5 -
The impact of the COVID-19 outbreak on international trade is not yet visible in most trade data
but some timely and leading indicators may already yield clues about the extent of the slowdown
and how it compares to earlier crises. Indices of new export orders derived from Purchasing
Managers' Indices (PMIs) are particularly useful in this regard. The JP Morgan global PMI for March
showed export orders in manufacturing sinking to 43.3 relative to a baseline value of 50, and new
services export business dropping to 35.5, suggesting a severe downturn.
Chart 3: New export orders from purchasing managers indices, Jan. 2008 – Mar. 2020
Index, base=50
Note: Values greater than 50 indicate expansion while values less than 50 denote contraction.
Source: IHS Markit.
30.6
43.3
35.5
25
30
35
40
45
50
55
60
Jan2008
Jul2008
Jan2009
Jul2009
Jan2010
Jul2010
Jan2011
Jul2011
Jan2012
Jul2012
Jan2013
Jul2013
Jan2014
Jul2014
Jan2015
Jul2015
Jan2016
Jul2016
Jan2017
Jul2017
Jan2018
Jul2018
Jan2019
Jul2019
Jan2020
Manufacturing Services
6. PRESS/855
- 6 -
Trade developments in 2019
Global merchandise trade stalled in 2019 under the weight of persistent trade tensions, with trade
turning down toward the end of the year. This is illustrated by Chart 4, which shows seasonally-
adjusted quarterly merchandise trade volumes as measured by the average of exports and
imports. Trade in the fourth quarter was down by 1.0% year-on-year and by 1.2% compared to
the third quarter of 2019. The latter is equivalent to a 4.6% decline on an annualized basis.
Chart 4: World merchandise exports and imports, 2015Q1-2019Q4
Index 2015Q1=100 and year-on-year % change
Source: WTO Secretariat and UNCTAD.
Chart 5 shows seasonally-adjusted quarterly merchandise export and import volumes by region.
South America and Other Regions posted large declines in exports in the second half of 2019,
while Europe, North America, and Asia experienced either minimal growth or mild declines. Import
volumes for South America experienced a sharp decline throughout 2019, with Europe, North
America, and Asia also ending the year lower. Only imports for Other Regions continued rising with
year-on-year growth for each quarter of between 1.9% and 4.9% in 2019.
-1.0
108.9
-2
-1
0
1
2
3
4
5
6
96
98
100
102
104
106
108
110
112
2015Q1
2015Q2
2015Q3
2015Q4
2016Q1
2016Q2
2016Q3
2016Q4
2017Q1
2017Q2
2017Q3
2017Q4
2018Q1
2018Q2
2018Q3
2018Q4
2019Q1
2019Q2
2019Q3
2019Q4
Year-on-year % change (right axis) Index, 2015Q1=100 (left axis)
7. PRESS/855
- 7 -
Chart 5: Merchandise exports and imports by region, 2015Q1-2019Q4
(Volume index, 2015Q1=100)
1 Refers to South and Central America and the Caribbean.
2 Other Regions comprise Africa, Middle East, and the Commonwealth of Independent States,
including associate and former member States.
Source: WTO and UNCTAD.
Although services are not subject to tariffs in the way that goods are, world commercial services
trade still slowed sharply in value terms in 2019 after recording strong increases in the previous
two years. This is illustrated by Chart 6, which shows growth in the dollar value of services exports
by major categories. The category of “Other commercial services” recorded the strongest growth
with a 3% increase in 2019, followed by travel and goods-related services at 1%. A 0.5% drop in
the value of transport service may have reflected weakness in goods trade as a result of trade
frictions between major economies.
Monthly, quarterly and annual trade statistics can be downloaded from the WTO Data Portal
at data.wto.org.2
2
All numbers in the text are provisional. Definitive figures can be found in the online database.
80
90
100
110
120
2015Q1
2015Q3
2016Q1
2016Q3
2017Q1
2017Q3
2018Q1
2018Q3
2019Q1
2019Q3
Exports
North America South America¹ Europe
Asia Other Regions²
80
90
100
110
120
2015Q1
2015Q3
2016Q1
2016Q3
2017Q1
2017Q3
2018Q1
2018Q3
2019Q1
2019Q3
Imports
North America South America¹ Europe
Asia Other Regions²
8. PRESS/855
- 8 -
Chart 6: Growth in the value of commercial services exports by category, 2015-2019
% change in US$ values
Source: WTO Secretariat, UNCTAD and ITC.
-4.9
1.5
8.7
9.0
2.0
-9.3
-3.7
9.6
8.7
-0.5
-4.7
2.4
8.0
7.8
1.1
-1.9
5.1
8.4
15.9
1.2
-3.6
2.7
8.7
9.1
3.3
-12.0
-8.0
-4.0
0.0
4.0
8.0
12.0
16.0
20.0
2015 2016 2017 2018 2019
Commercial services Transport Travel Goods related services Other commercial services
9. PRESS/855
- 9 -
Table 1: Merchandise trade volume and real GDP, 2018-2021 1
Annual % change
1 Figures for 2020 and 2021 are projections.
2 Average of exports and imports.
3 Other regions comprise Africa, Middle East and Commonwealth of Independent States (CIS)
including associate and former member States.
Source: WTO Secretariat for trade and consensus estimates for historical GDP. Projections for GDP based on
scenarios simulated with WTO Global Trade Model.
2018 2019 2020 2021 2020 2021
Volume of world merchandise trade 2
2.9 -0.1 -12.9 21.3 -31.9 24.0
Exports
North America 3.8 1.0 -17.1 23.7 -40.9 19.3
South and Central America 0.1 -2.2 -12.9 18.6 -31.3 14.3
Europe 2.0 0.1 -12.2 20.5 -32.8 22.7
Asia 3.7 0.9 -13.5 24.9 -36.2 36.1
Other regions 3
0.7 -2.9 -8.0 8.6 -8.0 9.3
Imports
North America 5.2 -0.4 -14.5 27.3 -33.8 29.5
South and Central America 5.3 -2.1 -22.2 23.2 -43.8 19.5
Europe 1.5 0.5 -10.3 19.9 -28.9 24.5
Asia 4.9 -0.6 -11.8 23.1 -31.5 25.1
Other regions 3
0.3 1.5 -10.0 13.6 -22.6 18.0
Real GDP at market exchange rates 2.9 2.3 -2.5 7.4 -8.8 5.9
North America 2.8 2.2 -3.3 7.2 -9.0 5.1
South and Central America 0.6 0.1 -4.3 6.5 -11.0 4.8
Europe 2.1 1.3 -3.5 6.6 -10.8 5.4
Asia 4.2 3.9 -0.7 8.7 -7.1 7.4
Other regions 3
2.1 1.7 -1.5 6.0 -6.7 5.2
Historical
Optimistic
scenario
Pessimistic
scenario
10. PRESS/855
- 10 -
Appendix Tables
Appendix Table 1: Leading exporters and importers in world merchandise trade, 2019
(Billion US$ and %)
1 Secretariat estimates.
2 Imports are valued f.o.b.
3 Includes significant re-exports or imports for re-export.
Source: WTO and UNCTAD.
Rank Exporters Value Share
Annual
percentage
change
Rank Importers Value Share
Annual
percentage
change
1 China 2499 13.2 0 1 United States of America 2568 13.4 -2
2 United States of America 1646 8.7 -1 2 China 2077 10.8 -3
3 Germany 1489 7.9 -5 3 Germany 1234 6.4 -4
4 Netherlands 709 3.8 -2 4 Japan 721 3.7 -4
5 Japan 706 3.7 -4 5 United Kingdom 692 3.6 3
6 France 570 3.0 -2 6 France 651 3.4 -3
7 Korea, Republic of 542 2.9 -10 7 Netherlands 636 3.3 -1
8 Hong Kong, China 535 2.8 -6 8 Hong Kong, China 578 3.0 -8
Domestic exports 15 0.1 18 Retained imports 1
138 0.7 -10
Re-exports 517 2.7 -7
9 Italy 533 2.8 -3 9 Korea, Republic of 503 2.6 -6
10 United Kingdom 469 2.5 -4 10 India 484 2.5 -6
11 Mexico 461 2.4 2 11 Italy 474 2.5 -6
12 Canada 447 2.4 -1 12 Mexico 467 2.4 -2
13 Belgium 445 2.4 -5 13 Canada 464 2.4 -1
14 Russian Federation 419 2.2 -5 14 Belgium 426 2.2 -6
15 Singapore 391 2.1 -5 15 Spain 372 1.9 -5
Domestic exports 184 1.0 -12
Re-exports 206 1.1 1
16 Spain 334 1.8 -4 16 Singapore 359 1.9 -3
Retained imports 1
153 0.8 -9
17 Chinese Taipei 331 1.8 -2 17 Chinese Taipei 287 1.5 0
18 India 324 1.7 0 18 Switzerland 277 1.4 -1
19 Switzerland 314 1.7 1 19 Poland 262 1.4 -3
20 United Arab Emirates 1
280 1.5 -12 20 United Arab Emirates 1
262 1.4 0
21 Australia 272 1.4 6 21 Russian Federation 2
254 1.3 2
22 Saudi Arabia, Kingdom of 1
269 1.4 -9 22 Viet Nam 254 1.3 7
23 Viet Nam 264 1.4 8 23 Thailand 237 1.2 -5
24 Poland 264 1.4 0 24 Australia 222 1.2 -6
25 Thailand 246 1.3 -3 25 Turkey 210 1.1 -9
26 Malaysia 238 1.3 -4 26 Malaysia 205 1.1 -6
27 Brazil 223 1.2 -7 27 Austria 185 1.0 -5
28 Czech Republic 199 1.1 -2 28 Brazil 184 1.0 -2
29 Turkey 181 1.0 2 29 Czech Republic 178 0.9 -3
30 Austria 179 0.9 -3 30 Indonesia 171 0.9 -10
Total of above 3
15775 83.5 - Total of above 3
16047 82.7 -
World 3
18886 100.0 -3 World 3
19226 100.0 -3
11. PRESS/855
- 11 -
Appendix Table 2: Leading exporters and importers in world merchandise trade
excluding intra-EU trade, 2019
(Billion US$ and %)
1 Secretariat estimates.
2 Imports are valued f.o.b.
3 Includes significant re-exports or imports for re-export.
Source: WTO and UNCTAD.
Rank Exporters Value Share
Annual
percentage
change
Rank Importers Value Share
Annual
percentage
change
1 China 2499 16.2 0 1 United States of America 2568 16.2 -2
2 Extra-EU exports 2386 15.4 -2 2 Extra-EU imports 2166 13.7 -4
3 United States of America 1646 10.6 -1 3 China 2077 13.1 -3
4 Japan 706 4.6 -4 4 Japan 721 4.5 -4
5 Korea, Republic of 542 3.5 -10 5 United Kingdom 692 4.4 3
6 Hong Kong, China 535 3.5 -6 6 Hong Kong, China 578 3.6 -8
Domestic exports 15 0.1 18 Retained imports 1
138 0.9 -10
Re-exports 517 3.3 -7
7 United Kingdom 469 3.0 -4 7 Korea, Republic of 503 3.2 -6
8 Mexico 461 3.0 2 8 India 484 3.0 -6
9 Canada 447 2.9 -1 9 Mexico 467 2.9 -2
10 Russian Federation 419 2.7 -5 10 Canada 464 2.9 -1
11 Singapore 391 2.5 -5 11 Singapore 359 2.3 -3
Domestic exports 184 1.2 -12 Retained imports 1
153 1.0 -9
Re-exports 206 1.3 1
12 Chinese Taipei 331 2.1 -2 12 Chinese Taipei 287 1.8 0
13 India 324 2.1 0 13 Switzerland 277 1.7 -1
14 Switzerland 314 2.0 1 14 United Arab Emirates 1
262 1.7 0
15 United Arab Emirates 1
280 1.8 -12 15 Russian Federation 2
254 1.6 2
16 Australia 272 1.8 6 16 Viet Nam 254 1.6 7
17 Saudi Arabia, Kingdom of 1
269 1.7 -9 17 Thailand 237 1.5 -5
18 Viet Nam 264 1.7 8 18 Australia 222 1.4 -6
19 Thailand 246 1.6 -3 19 Turkey 210 1.3 -9
20 Malaysia 238 1.5 -4 20 Malaysia 205 1.3 -6
21 Brazil 223 1.4 -7 21 Brazil 184 1.2 -2
22 Turkey 181 1.2 2 22 Indonesia 171 1.1 -10
23 Indonesia 167 1.1 -7 23 Saudi Arabia, Kingdom of 1
142 0.9 4
24 Norway 103 0.7 -16 24 Philippines 113 0.7 -5
25 South Africa 90 0.6 -4 25 South Africa 1
108 0.7 -6
26 Iraq 1
89 0.6 -6 26 Norway 85 0.5 -2
27 Qatar 1
73 0.5 -14 27 Israel 76 0.5 0
28 Philippines 70 0.5 1 28 Egypt 71 0.4 -2
29 Chile 70 0.5 -8 29 Chile 70 0.4 -7
30 Argentina 65 0.4 5 30 Ukraine 61 0.4 6
Total of above 3
14169 91.7 - Total of above 3
14367 90.6 -
World excluding EU intra-trade 3
15459 100.0 -3 World excluding EU intra-trade 3
15866 100.0 -3
12. PRESS/855
- 12 -
Appendix Table 3: Leading exporters and importers of commercial services, 2019
(Billion US$ and %)
1 Imports adjusted to f.o.b valuation.
2 Preliminary annual estimates. Quarterly data not available.
- indicates non-applicable.
Note: Preliminary estimates based on quarterly statistics. Figures for a number of countries and territories
have been estimated by the Secretariat. More data available at http://data.wto.org/.
Source: WTO, UNCTAD and ITC.
Rank Exporters Value Share
Annual
percentage
change
Rank Importers Value Share
Annual
percentage
change
1 United States of America 824 13.7 2 1 United States of America 571 9.9 5
2 United Kingdom 412 6.8 2 2 China 497 8.6 -5
3 Germany 331 5.5 -2 3 Germany 360 6.3 -1
4 China 282 4.7 4 4 Ireland 320 5.6 46
5 France 280 4.6 -5 5 United Kingdom 278 4.8 8
6 Netherlands 262 4.3 6 6 France 256 4.5 -4
7 Ireland 238 3.9 12 7 Netherlands 246 4.3 1
8 India 214 3.5 5 8 Japan 202 3.5 2
9 Singapore 205 3.4 1 9 Singapore 199 3.5 -1
10 Japan 201 3.3 6 10 India 1
178 3.1 2
11 Spain 157 2.6 1 11 Korea, Republic of 129 2.2 -2
12 Switzerland 122 2.0 -3 12 Italy 122 2.1 -1
13 Italy 121 2.0 -1 13 Belgium 120 2.1 -3
14 Belgium 119 2.0 -2 14 Canada 114 2.0 0
15 Luxembourg 112 1.9 -2 15 Switzerland 104 1.8 -2
16 Korea, Republic of 107 1.8 4 16 Russian Federation 98 1.7 6
17 Hong Kong, China 101 1.7 -10 17 Luxembourg 86 1.5 -1
18 Canada 99 1.6 1 18 Spain 86 1.5 5
19 Thailand 81 1.4 6 19 Hong Kong, China 79 1.4 -3
20 Sweden 76 1.3 2 20 Sweden 73 1.3 1
21 Denmark 74 1.2 -5 21 United Arab Emirates 2
73 1.3 2
22 Austria 73 1.2 -1 22 Denmark 71 1.2 0
23 United Arab Emirates 2
72 1.2 2 23 Australia 71 1.2 -2
24 Poland 72 1.2 4 24 Brazil 67 1.2 -3
25 Australia 70 1.2 1 25 Austria 63 1.1 1
26 Turkey 64 1.1 10 26 Thailand 58 1.0 6
27 Russian Federation 64 1.1 0 27 Chinese Taipei 56 1.0 0
28 Israel 55 0.9 11 28 Saudi Arabia, Kingdom of 55 1.0 -1
29 Chinese Taipei 51 0.9 3 29 Norway 53 0.9 0
30 Norway 45 0.7 2 30 Poland 45 0.8 3
Total of above 4983 82.7 - Total of above 4729 82.3 -
World 6025 100.0 2 World 5745 100.0 2
13. PRESS/855
- 13 -
Appendix Table 4: Leading exporters and importers of commercial services excluding
intra-EU trade, 2019
(Billion US$ and %)
1 Imports adjusted to f.o.b valuation.
2 Preliminary annual estimates. Quarterly data not available.
3 Follows BPM5 services classification.
- indicates non-applicable.
Note: Preliminary estimates based on quarterly statistics. Figures for a number of countries and territories
have been estimated by the Secretariat. More data available at http://data.wto.org/.
Source: WTO, UNCTAD and ITC.
END
Rank Exporters Value Share
Annual
percentage
change
Rank Importers Value Share
Annual
percentage
change
1 Extra-EU exports 1108 22.3 0 1 Extra-EU imports 965 20.5 4
2 United States of America 824 16.6 2 2 United States of America 571 12.1 5
3 United Kingdom 412 8.3 2 3 China 497 10.6 -5
4 China 282 5.7 4 4 United Kingdom 278 5.9 8
5 India 214 4.3 5 5 Japan 202 4.3 2
6 Singapore 205 4.1 1 6 Singapore 199 4.2 -1
7 Japan 201 4.0 6 7 India 1
178 3.8 2
8 Switzerland 122 2.4 -3 8 Korea, Republic of 129 2.7 -2
9 Korea, Republic of 107 2.2 4 9 Canada 114 2.4 0
10 Hong Kong, China 101 2.0 -10 10 Switzerland 104 2.2 -2
11 Canada 99 2.0 1 11 Russian Federation 98 2.1 6
12 Thailand 81 1.6 6 12 Hong Kong, China 79 1.7 -3
13 United Arab Emirates 2
72 1.5 2 13 United Arab Emirates 2
73 1.5 2
14 Australia 70 1.4 1 14 Australia 71 1.5 -2
15 Turkey 64 1.3 10 15 Brazil 67 1.4 -3
16 Russian Federation 64 1.3 0 16 Thailand 58 1.2 6
17 Israel 55 1.1 11 17 Chinese Taipei 56 1.2 0
18 Chinese Taipei 51 1.0 3 18 Saudi Arabia, Kingdom of 55 1.2 -1
19 Norway 45 0.9 2 19 Norway 53 1.1 0
20 Macao, China 3
43 0.9 -1 20 Malaysia 43 0.9 -2
21 Philippines 41 0.8 8 21 Nigeria 42 0.9 36
22 Malaysia 41 0.8 2 22 Indonesia 39 0.8 4
23 Brazil 33 0.7 -4 23 Mexico 36 0.8 -3
24 Indonesia 31 0.6 1 24 Qatar 34 0.7 10
25 Mexico 30 0.6 5 25 Israel 31 0.7 3
26 Egypt 25 0.5 7 26 Kuwait, the State of 28 0.6 -20
27 Saudi Arabia, Kingdom of 22 0.4 15 27 Philippines 28 0.6 5
28 Qatar 19 0.4 5 28 Turkey 27 0.6 2
29 Morocco 19 0.4 4 29 Iraq 24 0.5 36
30 New Zealand 17 0.3 -2 30 Egypt 20 0.4 13
Total of above 4496 90.5 - Total of above 4200 89.2 -
World (excl. intra-EU) 4965 100.0 2 World (excl. intra-EU) 4710 100.0 2