SlideShare uma empresa Scribd logo
1 de 5
Baixar para ler offline
www.ijemr.net ISSN (ONLINE): 2250-0758, ISSN (PRINT): 2394-6962
185 Copyright © 2018. IJEMR. All Rights Reserved.
Volume-8, Issue-5, October 2018
International Journal of Engineering and Management Research
Page Number: 185-189
DOI: doi.org/10.31033/ijemr.8.5.22
The Likelihood Ratio Test in Structural Equation Models: A Multi-Group
Approach to Portuguese Material Deprivation
Paula C.R. Vicente
Assistant Professor, Department of Economics and Management, ULHT, Lisbon, Portugal; BRU-IUL, Lisbon, PORTUGAL
Corresponding Author: paula.vicente@ulusofona.pt
ABSTRACT
In this study a multi-group approach is used
within the structural equations modelling framework,
with the purpose of validating the temporal stability of
the material deprivation measurement model, as well
the impact of the existence of children in the household.
For the purposes of model comparison, the use of the
likelihood ratio test is discussed, when the normal
distribution of the data cannot be assumed and the
robust Satorra-Bentler scaled-corrected chi-square
estimator is used. The statistical package LISREL 8.8 is
used for estimating models.
Keywords— EU-SILC Data, Multi-Group Analysis,
Satorra-Bentler Scaled Correct Chi-Square Estimator,
Structural Equation Models.
I. INTRODUCTION
While the study of household poverty and quality
of life is often based on disposable income, this measure
alone may not be satisfactory. The level and quality of life
of households can be measured through other indicators
such as the ability to access a set of basic needs, the
possession of durable goods, living conditions and even
the environmental conditions of the place where they
reside, that is, through a concept of material deprivation
(Guio, 2005; Whelan & Maître, 2007).
This article is based on Portuguese cross-sectional
data from European Statistical Database EU-SILC
(European Statistics on Income and Living Conditions).
EU-SILC is a four-year rotational panel, where each year
1/4 of the sample is recruited and 1/4 is dropped. Data
from years 2007 and 2011 are used to analyze the material
deprivation experienced by families, assuming this concept
as measured in three dimensions: i) economic constraints;
(ii) possession of durable goods; and iii) housing
conditions.
The aim of the study is to illustrate and discuss
the use of the correction factor to the likelihood ratio test
when the normality of the distribution of the data cannot
be assumed. A multi-group structural equation model is
used to validate the temporal stability of the material
deprivation measure and the impact of the existence of
children in the household on material deprivation.
Statistical analysis was performed using the statistical
package LISREL 8.8 (Jöreskog & Sörbom, 2004).
II. DATA
In this study the Portuguese EU-SILC cross-
sectional data are used for the years 2007 and 2011,
corresponding respectively to two independent samples
with 4310 and 5740 aggregates. In fact, given the
dynamics of panel rotation there is no overlap in
respondents for the two years under analysis (see figure 1).
Panel year
selected
2004 2005 2006 2007 2008
2004
2004
2004
2004
2005
2006
2007
2008
2009
2009
2010 2011
2010
Survey year
2011
Figure 1: EU-SILC panel data design. In bold boxes are
the data under analysis, 2007 and 2011
www.ijemr.net ISSN (ONLINE): 2250-0758, ISSN (PRINT): 2394-6962
186 Copyright © 2018. IJEMR. All Rights Reserved.
The variables under study were obtained as sums
of items for each of the three dimensions of material
deprivation considered: i) economic constraints; (ii)
possession of durable goods; and iii) housing conditions.
The economic constraints dimension includes the
lack of financial capacity to: i1) have a meal of meat or
fish at least every two days, or the equivalent if vegetarian;
i2) pay one week annual holidays away from home; i3)
bear unexpected expenses, without resorting to credit; i4)
keep the house adequately warm; and i5) meet the usual
expenses and charges without difficulty. The possession
dimension of durable goods considers the lack of
economic availability to own: ii1) fixed or mobile
telephone; ii2) color TV; ii3) washing machine; and ii4)
car (passenger or mixed). The dimension housing
conditions includes problems such as: iii1) leaking damp
walls/floors/foundations, or rot in window frames or floor;
iii2) insufficient light; iii3) absence of indoor toilet for sole
use of the household; and iii4) absence of indoor bath or
shower.
Thus, the economic constraints dimension takes
values from 0 to 5 items of deprivation, the possession
dimension of goods assumes values between 0 and 4
missing items, and the dimension housing conditions takes
values between 0 and 4 problems. The distribution of
deprivation observed in each of the three dimensions for
the two years under analysis is shown in table 1.
Regarding the economic constraints, analysis of
table 1 shows that 67.1% of the households do not have the
financial capacity to meet 2 or more items in 2007,
decreasing this percentage to 61% in 2011. Conversely, it
should be noted that the high percentage of households that
are not deprived of any item in possession of goods
dimension, 82.7% and 85.8%, respectively, in 2007 and
2011. Also, the housing conditions dimension presents a
high number of households with no problems, 67.2% and
73.5%, in 2007 and 2011, respectively.
When asked about the existence of children in the
household, 36.83% of the families have children, in 2007,
and that percentage is 31.8%, in 2011.
Table 1: Percentage of households with deprivation in
each dimension (more items corresponds to more
deprivation)
III. METHODOLOGICAL APPROACH
A structural equation model is used to explain the
material deprivation, measured in the three dimensions
mentioned above, as a function of the existence of children
in the household, as represented in figure 2.
Material
Deprivation
Economic
Constrains
Possession of
Durable Goods
Housing
Conditions
Children in the
household
γ
λ1
λ2
λ3
δ1
δ2
δ3
Figure 2: Structural equation model: having children is a
possible determinant of material deprivation (measured by
three indicators – the three material deprivation
dimensions)
Structural equation modelling is one of the most
important statistical techniques of multivariate analysis
and can be seen as a combination of confirmatory factorial
analysis (the measurement model) and linear regression
(the structural model). The measurement model represents
the relationship between the observed variables and the
latent variables, while the structural model represents the
dependencies among latent variables. It has the great
advantage of allowing the simultaneous estimation of a set
of dependency relationships between variables that may be
latent, considering the component of the measurement
error, Bollen (1989).
Regarding the model considered in this study and
presented in figure 2, it should be noted that in terms of
modeling, it is necessary to consider a latent variable
underlying the observed explanatory variable, existence of
children in the household, where γ the regression
coefficient measures the relation between this latent
variable and the latent material deprivation variable. The
relationship between observed variables, economic
constraints, possession of durable goods and housing
conditions, with the latent variable material deprivation
being measured by the factorial loadings represented by λ1,
λ2 and λ3, respectively. The measurement errors associated
with the three observed variables are represented by δ1, δ2
and δ3.
A longitudinal approach to the problem of
material deprivation is proposed, using a multi-group
structural equation model (Bollen, 1989; Schumacker &
Lomax, 2010). In a multi-group analysis, it is possible to
verify the existence of different behaviors by the different
groups in relation to the concept under study, these groups
being different temporal moments. For each of these
groups a model must be defined. Then, equality constraints
are imposed on parameters of the different groups.
www.ijemr.net ISSN (ONLINE): 2250-0758, ISSN (PRINT): 2394-6962
187 Copyright © 2018. IJEMR. All Rights Reserved.
Considered a baseline model (M1), and a model in which
restrictions are imposed to the parameters (M0). M0 can be
considered a nested model of the baseline model, M1.
From a statistical point of view, two nested models can be
compared by calculating the difference between the chi-
square values of the two models (∆χ2
). Assuming data are
normally distributed the difference is chi-square
distributed. The corresponding degrees of freedom (∆df)
are given by the difference of degrees of freedom of the
two nested models. The null hypothesis under test is the
invariance of the parameters in both models, and the value
of ∆χ2
obtained must be compared with the critical value
of a chi-square distribution with degrees of freedom given
by ∆df. Rejecting the null hypothesis corresponds to
concluding that the two models are not equivalent, that is,
the baseline model (M1) fits the data better than the
restricted model (M0). This chi-square difference test is
also known as the likelihood ratio test.
IV. THE LIKELIHOOD RATIO TEST
AND THE CORRECTION FACTOR
In structural equation models and for model
estimation purposes, when the multivariate normality of
the data distribution cannot be assumed, statistical
packages such as LISREL and Mplus provide the use of a
robust estimator or an ADF (Asymptotically Distribution
Free) estimator: the Satorra-Bentler scaled-corrected chi-
square. Such an estimator was proposed for data whose
distribution deviates from the normal in terms of skewness
and / or kurtosis (for metric variables or for ordinal
variables for which a metric latent variable is assumed).
When the normality of the data distribution cannot be
assumed, and if the purpose is model comparison, the
likelihood ratio test cannot be directly applied, since, due
to the correction factor, the chi-square difference
distribution is no longer a chi-square. In these
circumstances, Bryant & Satorra (2012) recommend the
application of a correction factor on the likelihood ratio
test, for which an EXCEL macro for LISREL, EQS and
Mplus users was made available in 2013, (Bryant &
Satorra, 2013).
Using the adjustment measures provided by the
statistical package, Min Fit Function Maximum Likelihood
chi-square (T1), Normal Theory Weighted Least Squares
chi-square (T2) and Satorra-Bentler chi-square (T3), the
procedure consists of two steps. First, a correction factor
for the chi-square difference test (cd) is calculated as
follows
, (1)
in which, and are the degrees of freedom for
the two models M0 (model with imposed restrictions) and
M1 (baseline model), respectively. and are the
correction factors for each of the models (M0 and M1) and
are calculated as
and , (2)
with and the obtained values of T2 and T3, for
M0 model, and the obtained values of T2 and T3
for M1 model.
Then Satorra-Bentler scaled difference chi-square
test value (Td) is computed as follows
, (3)
with and the obtained Min Fit Function
Maximum Likelihood chi-square values for the M0 and M1
models, respectively. The degrees of freedom for this
corrected chi-square difference test are ( ).
V. RESULTS
This study aims to illustrate the use of the macro
built by Bryant and Satorra to estimate the proposed model
to explain material deprivation in the years 2007 and 2011,
using a multi-group approach. Thus, for each of the years
2007 and 2011, the model represented in figure 2 is
specified, and a multi-group analysis was carried out to
assess the temporal stability of the proposed factor
structure, as well as the stability of the impact of the
existence of children in the household at each of the two
time points.
The models considered for comparison in multi-
group analysis are
: Baseline model, with no restrictions of invariance
between the two groups (subpopulations in 2007 and
2011);
: Model with factor loadings invariance restriction in
the two groups, that is, ;
: Model with regression coefficient invariance
restriction, that is, ;
: Model with factor loadings and regression
coefficient invariance restrictions, that is,
and .
Adjustment measures calculated by LISREL 8.8
statistical package for the four models under analysis are
shown in Table 2. These results allow to calculate the chi-
square test difference values for each of the three
hypotheses, H0
(1)
, H0
(2)
and H0
(3)
, in order to measure the
invariance of the weights of different dimensions of
material deprivation at the two time points, as well as the
temporal invariance of the effect of the existence of
children in the household on the material deprivation level.
Models degrees of
freedom
T1 T2 T3
M1 4 256.98 246.57 72.16
M0
(1)
6 273.64 262.81 84.00
M0
(2)
5 261.35 251.25 78.53
M0
(3)
7 278.21 268.74 88.75
Table 2: Adjustment measures given by LISREL 8.8, for
the models under analysis
www.ijemr.net ISSN (ONLINE): 2250-0758, ISSN (PRINT): 2394-6962
188 Copyright © 2018. IJEMR. All Rights Reserved.
: is valid, that is, exists factor loadings
invariance at the two time points, 2007 and 2011;
: is valid, that is, exists coefficient regression
invariance at the two time points, 2007 and 2011;
: is valid, that is, exists factor loadings and
coefficient regression invariance at the two time points,
2007 and 2011.
Table 3 presents the test values for the usual chi-
square difference (assuming normal distribution of data)
and for this difference with correction factor. The degrees
of freedom of each one of the tests carried out are
presented in the first column. The second and third
columns correspond to the results of tests with no
correction factor. The fourth column corresponds to chi-
square tests with correction factor. The analysis of this
table allows identical conclusions when comparing the
models M0
(1)
vs M1, and M0
(3)
vs M1, using the chi-square
difference test without the correction factor and with the
correction factor. That is, the hypotheses of the invariance
of the factorial loadings in the first case and, in the second
case, of invariance of the factorial loadings and the
regression coefficient in the years 2007 and 2011 are
rejected. Consequently, M1 must be chosen instead of M0
(1)
and of M0
(3)
.
When comparing M0
(2)
versus M1 (that is, testing
the hypothesis, H0
(2)
, that M0
(2)
is valid), using the chi-
square difference test without the correction factor
(procedure considered incorrect), it is possible to conclude
about the rejection of the hypothesis of regression
coefficient invariance at the two different time points
(2007 and 2011) and the consequent choice of M1. Using
the chi-square difference test with the correction factor
(procedure considered appropriate) the opposite conclusion
is obtained. Thus, it is possible to conclude that there is no
significant difference in the value of γ at the two different
moments. In fact, the null hypothesis that M0
(2)
is valid,
and must be the chosen model, is not rejected.
∆
degrees
of
freedom
∆
Min Fit
ML
χ2
∆
Satorra-
Bentler
χ2
∆
Satorra-
Bentler
scaled
corrected
χ2
M0
(1)
vs M1 2 16.66
(0.0001)
11.84
(0.0013)
6.528
(0.0382)
M0
(2)
vs M1 1 4.37
(0.0215)
6.37
(0.0065)
1.8763
(0.1708)
M0
(3)
vs M1 3 21.23
(0.0000)
16.59
(0.0004)
9.4596
(0.0374)
Table 3: Obtained values of the chi-square difference (p
values) and degrees of freedom
The factorial loadings of the indicators obtained
in the model M0
(2)
adjustment are presented in table 4, and
it is possible to conclude that the economic constraints and
possession of goods are the indicators that present greater
weight in material deprivation in the years 2007 and 2011.
The possession of goods dimension had an increasing
relative weight from 2007 to 2011 in terms of material
deprivation (from 0.78 to 0.83), while the relative weight
of the housing condition dimension decreased in the same
period (from 0.53 to 0.45).
2007 2011
λ1 0.71 0.71
λ2 0.78 0.83
λ3 0.53 0.45
γ -0.14
Table 4: Obtained values for structural equation model
parameters, in 2007 and 2011
The estimated value for the impact of children in
the household on material deprivation is negative, -0.14,
which means that households with children have lower
levels of material deprivation.
VI. CONCLUSION
The application of the multi-group analysis within
the structural equation modelling framework allows testing
the stability of the factorial structure of the material
deprivation concept at the two time periods, 2007 and
2011, and / or the stability of the impact of the existence of
children in the material deprivation level experienced by
the families.
Thus, it is possible to conclude that there is no
stability of the material deprivation measurement model in
the two time periods, 2007 and 2011, increasing the weight
of the possession of goods and decreasing the problems in
housing conditions. On the contrary, there is evidence that
the impact of the existence of children in the household on
material deprivation levels remains constant from 2007 to
2011.
On the other hand, it is possible to conclude, that
performing a multi-group analysis ignoring the correction
factor on the statistic of the likelihood ratio test (and not
using the Satorra-Bentler scaled chi-square difference test)
may lead to statistically incorrect results. In some cases,
these results can be contradictory.
ACKNOWLEDGMENT
The author acknowledges the support of Maria de
Fátima Salgueiro, Instituto Universitário de Lisboa
(ISCTE-IUL), Portugal.
www.ijemr.net ISSN (ONLINE): 2250-0758, ISSN (PRINT): 2394-6962
189 Copyright © 2018. IJEMR. All Rights Reserved.
REFERENCES
[1] Bollen, K. (1989). Structural equations with latent
variables. New York: Wiley.
[2] Bryant, F. B. & Satorra, A. (2012). Principles and
practice of scaled difference chi-square testing. Structural
Equation Modelling, 19(3), 372-398.
[3] Bryant, F. B. & Satorra, A. (2013). EXCEL macro file
for conducting scaled difference chi-square tests via
LISREL 8, LISREL 9, EQS and Mplus. Retrieved from:
www.eco.upf.edu/~satorra.
[4] Guio, A. (2005) Material deprivation in the EU.
Statistics in Focus, Population and Social Conditions and
Welfare, 21.
[5] Jöreskog, K.G. & Sörbom, D. (2004). LISREL8,
Chicago IL: Scientific Software International, Inc.
[6] Schumacker, R.E. & Lomax, R.G. (2010). A beginner’s
guide to structural equation modelling. (3rd
ed.).
Routledge, New York: Taylor & Francis Group.
[7] Whelan, C.T. & Maître, B. (2007). Measuring material
deprivation with EU-SILC: Lessons from the Irish survey.
European Societies, 9, 147-173.

Mais conteúdo relacionado

Semelhante a The Likelihood Ratio Test in Structural Equation Models: A Multi-Group Approach to Portuguese Material Deprivation

Investigations of certain estimators for modeling panel data under violations...
Investigations of certain estimators for modeling panel data under violations...Investigations of certain estimators for modeling panel data under violations...
Investigations of certain estimators for modeling panel data under violations...Alexander Decker
 
Application of Semiparametric Non-Linear Model on Panel Data with Very Small ...
Application of Semiparametric Non-Linear Model on Panel Data with Very Small ...Application of Semiparametric Non-Linear Model on Panel Data with Very Small ...
Application of Semiparametric Non-Linear Model on Panel Data with Very Small ...IOSRJM
 
Multiple Linear Regression Applications in Real Estate Pricing
Multiple Linear Regression Applications in Real Estate PricingMultiple Linear Regression Applications in Real Estate Pricing
Multiple Linear Regression Applications in Real Estate Pricinginventionjournals
 
Multiple Linear Regression Applications in Real Estate Pricing
Multiple Linear Regression Applications in Real Estate PricingMultiple Linear Regression Applications in Real Estate Pricing
Multiple Linear Regression Applications in Real Estate Pricinginventionjournals
 
Presentation1.pptx
Presentation1.pptxPresentation1.pptx
Presentation1.pptxVishalLabde
 
An Analysis of Poverty in Italy through a fuzzy regression model
An Analysis of Poverty in Italy through a fuzzy regression modelAn Analysis of Poverty in Italy through a fuzzy regression model
An Analysis of Poverty in Italy through a fuzzy regression modelBeniamino Murgante
 
What Causes Economic Growth? A Breakdown of The Solow Growth Model
What Causes Economic Growth? A Breakdown of The Solow Growth ModelWhat Causes Economic Growth? A Breakdown of The Solow Growth Model
What Causes Economic Growth? A Breakdown of The Solow Growth ModelJaredBilberry1
 
Global demographic trends and future carbon emissions o neill et al_pnas_2010...
Global demographic trends and future carbon emissions o neill et al_pnas_2010...Global demographic trends and future carbon emissions o neill et al_pnas_2010...
Global demographic trends and future carbon emissions o neill et al_pnas_2010...Adnan Ahmed
 
Application Of Ordinal Logistic Regression In The Study Of Students Performance
Application Of Ordinal Logistic Regression In The Study Of Students  PerformanceApplication Of Ordinal Logistic Regression In The Study Of Students  Performance
Application Of Ordinal Logistic Regression In The Study Of Students PerformanceMartha Brown
 
Hierarchy of Needs and Dynamics of Consumer Behavior
Hierarchy of Needs and Dynamics of Consumer BehaviorHierarchy of Needs and Dynamics of Consumer Behavior
Hierarchy of Needs and Dynamics of Consumer BehaviorPavel Luksha
 
Analysis of Demand, Cost and Income of a Private Education Institution - A St...
Analysis of Demand, Cost and Income of a Private Education Institution - A St...Analysis of Demand, Cost and Income of a Private Education Institution - A St...
Analysis of Demand, Cost and Income of a Private Education Institution - A St...Hermann Gruber
 
On a Sequential Probit Model of Infant Mortality in Nigeria, by K.T. Amzat an...
On a Sequential Probit Model of Infant Mortality in Nigeria, by K.T. Amzat an...On a Sequential Probit Model of Infant Mortality in Nigeria, by K.T. Amzat an...
On a Sequential Probit Model of Infant Mortality in Nigeria, by K.T. Amzat an...Crescent University Abeokuta
 
A03660105
A03660105A03660105
A03660105theijes
 

Semelhante a The Likelihood Ratio Test in Structural Equation Models: A Multi-Group Approach to Portuguese Material Deprivation (20)

Investigations of certain estimators for modeling panel data under violations...
Investigations of certain estimators for modeling panel data under violations...Investigations of certain estimators for modeling panel data under violations...
Investigations of certain estimators for modeling panel data under violations...
 
Application of Semiparametric Non-Linear Model on Panel Data with Very Small ...
Application of Semiparametric Non-Linear Model on Panel Data with Very Small ...Application of Semiparametric Non-Linear Model on Panel Data with Very Small ...
Application of Semiparametric Non-Linear Model on Panel Data with Very Small ...
 
Spatial Effects and Convergence Theory at Parishes Level
Spatial Effects and Convergence Theory at Parishes LevelSpatial Effects and Convergence Theory at Parishes Level
Spatial Effects and Convergence Theory at Parishes Level
 
Multiple Linear Regression Applications in Real Estate Pricing
Multiple Linear Regression Applications in Real Estate PricingMultiple Linear Regression Applications in Real Estate Pricing
Multiple Linear Regression Applications in Real Estate Pricing
 
Multiple Linear Regression Applications in Real Estate Pricing
Multiple Linear Regression Applications in Real Estate PricingMultiple Linear Regression Applications in Real Estate Pricing
Multiple Linear Regression Applications in Real Estate Pricing
 
Presentation1.pptx
Presentation1.pptxPresentation1.pptx
Presentation1.pptx
 
An Analysis of Poverty in Italy through a fuzzy regression model
An Analysis of Poverty in Italy through a fuzzy regression modelAn Analysis of Poverty in Italy through a fuzzy regression model
An Analysis of Poverty in Italy through a fuzzy regression model
 
What Causes Economic Growth? A Breakdown of The Solow Growth Model
What Causes Economic Growth? A Breakdown of The Solow Growth ModelWhat Causes Economic Growth? A Breakdown of The Solow Growth Model
What Causes Economic Growth? A Breakdown of The Solow Growth Model
 
Regression models for panel data
Regression models for panel dataRegression models for panel data
Regression models for panel data
 
Global demographic trends and future carbon emissions o neill et al_pnas_2010...
Global demographic trends and future carbon emissions o neill et al_pnas_2010...Global demographic trends and future carbon emissions o neill et al_pnas_2010...
Global demographic trends and future carbon emissions o neill et al_pnas_2010...
 
Application Of Ordinal Logistic Regression In The Study Of Students Performance
Application Of Ordinal Logistic Regression In The Study Of Students  PerformanceApplication Of Ordinal Logistic Regression In The Study Of Students  Performance
Application Of Ordinal Logistic Regression In The Study Of Students Performance
 
Hierarchy of Needs and Dynamics of Consumer Behavior
Hierarchy of Needs and Dynamics of Consumer BehaviorHierarchy of Needs and Dynamics of Consumer Behavior
Hierarchy of Needs and Dynamics of Consumer Behavior
 
Analysis of Demand, Cost and Income of a Private Education Institution - A St...
Analysis of Demand, Cost and Income of a Private Education Institution - A St...Analysis of Demand, Cost and Income of a Private Education Institution - A St...
Analysis of Demand, Cost and Income of a Private Education Institution - A St...
 
J023089094
J023089094J023089094
J023089094
 
On a Sequential Probit Model of Infant Mortality in Nigeria, by K.T. Amzat an...
On a Sequential Probit Model of Infant Mortality in Nigeria, by K.T. Amzat an...On a Sequential Probit Model of Infant Mortality in Nigeria, by K.T. Amzat an...
On a Sequential Probit Model of Infant Mortality in Nigeria, by K.T. Amzat an...
 
Journal.pone.0151390
Journal.pone.0151390Journal.pone.0151390
Journal.pone.0151390
 
SPATIAL DATA ANALYSIS BASED ON THE CONVERGENCE THEORIES FOR PORTUGAL
SPATIAL DATA ANALYSIS BASED ON THE CONVERGENCE THEORIES FOR PORTUGALSPATIAL DATA ANALYSIS BASED ON THE CONVERGENCE THEORIES FOR PORTUGAL
SPATIAL DATA ANALYSIS BASED ON THE CONVERGENCE THEORIES FOR PORTUGAL
 
A SPATIAL MODEL BASED ON THE ENDOGENOUS GROWTH
A SPATIAL MODEL BASED ON THE ENDOGENOUS GROWTHA SPATIAL MODEL BASED ON THE ENDOGENOUS GROWTH
A SPATIAL MODEL BASED ON THE ENDOGENOUS GROWTH
 
Ijetcas14 379
Ijetcas14 379Ijetcas14 379
Ijetcas14 379
 
A03660105
A03660105A03660105
A03660105
 

Mais de Dr. Amarjeet Singh

Total Ionization Cross Sections due to Electron Impact of Ammonia from Thresh...
Total Ionization Cross Sections due to Electron Impact of Ammonia from Thresh...Total Ionization Cross Sections due to Electron Impact of Ammonia from Thresh...
Total Ionization Cross Sections due to Electron Impact of Ammonia from Thresh...Dr. Amarjeet Singh
 
A Case Study on Small Town Big Player – Enjay IT Solutions Ltd., Bhilad
A Case Study on Small Town Big Player – Enjay IT Solutions Ltd., BhiladA Case Study on Small Town Big Player – Enjay IT Solutions Ltd., Bhilad
A Case Study on Small Town Big Player – Enjay IT Solutions Ltd., BhiladDr. Amarjeet Singh
 
Effect of Biopesticide from the Stems of Gossypium Arboreum on Pink Bollworm ...
Effect of Biopesticide from the Stems of Gossypium Arboreum on Pink Bollworm ...Effect of Biopesticide from the Stems of Gossypium Arboreum on Pink Bollworm ...
Effect of Biopesticide from the Stems of Gossypium Arboreum on Pink Bollworm ...Dr. Amarjeet Singh
 
Artificial Intelligence Techniques in E-Commerce: The Possibility of Exploiti...
Artificial Intelligence Techniques in E-Commerce: The Possibility of Exploiti...Artificial Intelligence Techniques in E-Commerce: The Possibility of Exploiti...
Artificial Intelligence Techniques in E-Commerce: The Possibility of Exploiti...Dr. Amarjeet Singh
 
Factors Influencing Ownership Pattern and its Impact on Corporate Performance...
Factors Influencing Ownership Pattern and its Impact on Corporate Performance...Factors Influencing Ownership Pattern and its Impact on Corporate Performance...
Factors Influencing Ownership Pattern and its Impact on Corporate Performance...Dr. Amarjeet Singh
 
An Analytical Study on Ratios Influencing Profitability of Selected Indian Au...
An Analytical Study on Ratios Influencing Profitability of Selected Indian Au...An Analytical Study on Ratios Influencing Profitability of Selected Indian Au...
An Analytical Study on Ratios Influencing Profitability of Selected Indian Au...Dr. Amarjeet Singh
 
A Study on Factors Influencing the Financial Performance Analysis Selected Pr...
A Study on Factors Influencing the Financial Performance Analysis Selected Pr...A Study on Factors Influencing the Financial Performance Analysis Selected Pr...
A Study on Factors Influencing the Financial Performance Analysis Selected Pr...Dr. Amarjeet Singh
 
An Empirical Analysis of Financial Performance of Selected Oil Exploration an...
An Empirical Analysis of Financial Performance of Selected Oil Exploration an...An Empirical Analysis of Financial Performance of Selected Oil Exploration an...
An Empirical Analysis of Financial Performance of Selected Oil Exploration an...Dr. Amarjeet Singh
 
A Study on Derivative Market in India
A Study on Derivative Market in IndiaA Study on Derivative Market in India
A Study on Derivative Market in IndiaDr. Amarjeet Singh
 
Theoretical Estimation of CO2 Compression and Transport Costs for an hypothet...
Theoretical Estimation of CO2 Compression and Transport Costs for an hypothet...Theoretical Estimation of CO2 Compression and Transport Costs for an hypothet...
Theoretical Estimation of CO2 Compression and Transport Costs for an hypothet...Dr. Amarjeet Singh
 
Analytical Mechanics of Magnetic Particles Suspended in Magnetorheological Fluid
Analytical Mechanics of Magnetic Particles Suspended in Magnetorheological FluidAnalytical Mechanics of Magnetic Particles Suspended in Magnetorheological Fluid
Analytical Mechanics of Magnetic Particles Suspended in Magnetorheological FluidDr. Amarjeet Singh
 
Techno-Economic Aspects of Solid Food Wastes into Bio-Manure
Techno-Economic Aspects of Solid Food Wastes into Bio-ManureTechno-Economic Aspects of Solid Food Wastes into Bio-Manure
Techno-Economic Aspects of Solid Food Wastes into Bio-ManureDr. Amarjeet Singh
 
Crypto-Currencies: Can Investors Rely on them as Investment Avenue?
Crypto-Currencies: Can Investors Rely on them as Investment Avenue?Crypto-Currencies: Can Investors Rely on them as Investment Avenue?
Crypto-Currencies: Can Investors Rely on them as Investment Avenue?Dr. Amarjeet Singh
 
Awareness of Disaster Risk Reduction (DRR) among Student of the Catanduanes S...
Awareness of Disaster Risk Reduction (DRR) among Student of the Catanduanes S...Awareness of Disaster Risk Reduction (DRR) among Student of the Catanduanes S...
Awareness of Disaster Risk Reduction (DRR) among Student of the Catanduanes S...Dr. Amarjeet Singh
 
Role of Indians in the Battle of 1857
Role of Indians in the Battle of 1857Role of Indians in the Battle of 1857
Role of Indians in the Battle of 1857Dr. Amarjeet Singh
 
Haryana's Honour Killings: A Social and Legal Point of View
Haryana's Honour Killings: A Social and Legal Point of ViewHaryana's Honour Killings: A Social and Legal Point of View
Haryana's Honour Killings: A Social and Legal Point of ViewDr. Amarjeet Singh
 
Optimization of Digital-Based MSME E-Commerce: Challenges and Opportunities i...
Optimization of Digital-Based MSME E-Commerce: Challenges and Opportunities i...Optimization of Digital-Based MSME E-Commerce: Challenges and Opportunities i...
Optimization of Digital-Based MSME E-Commerce: Challenges and Opportunities i...Dr. Amarjeet Singh
 
Modal Space Controller for Hydraulically Driven Six Degree of Freedom Paralle...
Modal Space Controller for Hydraulically Driven Six Degree of Freedom Paralle...Modal Space Controller for Hydraulically Driven Six Degree of Freedom Paralle...
Modal Space Controller for Hydraulically Driven Six Degree of Freedom Paralle...Dr. Amarjeet Singh
 
Capacity Expansion Banes in Indian Steel Industry
Capacity Expansion Banes in Indian Steel IndustryCapacity Expansion Banes in Indian Steel Industry
Capacity Expansion Banes in Indian Steel IndustryDr. Amarjeet Singh
 
Metamorphosing Indian Blockchain Ecosystem
Metamorphosing Indian Blockchain EcosystemMetamorphosing Indian Blockchain Ecosystem
Metamorphosing Indian Blockchain EcosystemDr. Amarjeet Singh
 

Mais de Dr. Amarjeet Singh (20)

Total Ionization Cross Sections due to Electron Impact of Ammonia from Thresh...
Total Ionization Cross Sections due to Electron Impact of Ammonia from Thresh...Total Ionization Cross Sections due to Electron Impact of Ammonia from Thresh...
Total Ionization Cross Sections due to Electron Impact of Ammonia from Thresh...
 
A Case Study on Small Town Big Player – Enjay IT Solutions Ltd., Bhilad
A Case Study on Small Town Big Player – Enjay IT Solutions Ltd., BhiladA Case Study on Small Town Big Player – Enjay IT Solutions Ltd., Bhilad
A Case Study on Small Town Big Player – Enjay IT Solutions Ltd., Bhilad
 
Effect of Biopesticide from the Stems of Gossypium Arboreum on Pink Bollworm ...
Effect of Biopesticide from the Stems of Gossypium Arboreum on Pink Bollworm ...Effect of Biopesticide from the Stems of Gossypium Arboreum on Pink Bollworm ...
Effect of Biopesticide from the Stems of Gossypium Arboreum on Pink Bollworm ...
 
Artificial Intelligence Techniques in E-Commerce: The Possibility of Exploiti...
Artificial Intelligence Techniques in E-Commerce: The Possibility of Exploiti...Artificial Intelligence Techniques in E-Commerce: The Possibility of Exploiti...
Artificial Intelligence Techniques in E-Commerce: The Possibility of Exploiti...
 
Factors Influencing Ownership Pattern and its Impact on Corporate Performance...
Factors Influencing Ownership Pattern and its Impact on Corporate Performance...Factors Influencing Ownership Pattern and its Impact on Corporate Performance...
Factors Influencing Ownership Pattern and its Impact on Corporate Performance...
 
An Analytical Study on Ratios Influencing Profitability of Selected Indian Au...
An Analytical Study on Ratios Influencing Profitability of Selected Indian Au...An Analytical Study on Ratios Influencing Profitability of Selected Indian Au...
An Analytical Study on Ratios Influencing Profitability of Selected Indian Au...
 
A Study on Factors Influencing the Financial Performance Analysis Selected Pr...
A Study on Factors Influencing the Financial Performance Analysis Selected Pr...A Study on Factors Influencing the Financial Performance Analysis Selected Pr...
A Study on Factors Influencing the Financial Performance Analysis Selected Pr...
 
An Empirical Analysis of Financial Performance of Selected Oil Exploration an...
An Empirical Analysis of Financial Performance of Selected Oil Exploration an...An Empirical Analysis of Financial Performance of Selected Oil Exploration an...
An Empirical Analysis of Financial Performance of Selected Oil Exploration an...
 
A Study on Derivative Market in India
A Study on Derivative Market in IndiaA Study on Derivative Market in India
A Study on Derivative Market in India
 
Theoretical Estimation of CO2 Compression and Transport Costs for an hypothet...
Theoretical Estimation of CO2 Compression and Transport Costs for an hypothet...Theoretical Estimation of CO2 Compression and Transport Costs for an hypothet...
Theoretical Estimation of CO2 Compression and Transport Costs for an hypothet...
 
Analytical Mechanics of Magnetic Particles Suspended in Magnetorheological Fluid
Analytical Mechanics of Magnetic Particles Suspended in Magnetorheological FluidAnalytical Mechanics of Magnetic Particles Suspended in Magnetorheological Fluid
Analytical Mechanics of Magnetic Particles Suspended in Magnetorheological Fluid
 
Techno-Economic Aspects of Solid Food Wastes into Bio-Manure
Techno-Economic Aspects of Solid Food Wastes into Bio-ManureTechno-Economic Aspects of Solid Food Wastes into Bio-Manure
Techno-Economic Aspects of Solid Food Wastes into Bio-Manure
 
Crypto-Currencies: Can Investors Rely on them as Investment Avenue?
Crypto-Currencies: Can Investors Rely on them as Investment Avenue?Crypto-Currencies: Can Investors Rely on them as Investment Avenue?
Crypto-Currencies: Can Investors Rely on them as Investment Avenue?
 
Awareness of Disaster Risk Reduction (DRR) among Student of the Catanduanes S...
Awareness of Disaster Risk Reduction (DRR) among Student of the Catanduanes S...Awareness of Disaster Risk Reduction (DRR) among Student of the Catanduanes S...
Awareness of Disaster Risk Reduction (DRR) among Student of the Catanduanes S...
 
Role of Indians in the Battle of 1857
Role of Indians in the Battle of 1857Role of Indians in the Battle of 1857
Role of Indians in the Battle of 1857
 
Haryana's Honour Killings: A Social and Legal Point of View
Haryana's Honour Killings: A Social and Legal Point of ViewHaryana's Honour Killings: A Social and Legal Point of View
Haryana's Honour Killings: A Social and Legal Point of View
 
Optimization of Digital-Based MSME E-Commerce: Challenges and Opportunities i...
Optimization of Digital-Based MSME E-Commerce: Challenges and Opportunities i...Optimization of Digital-Based MSME E-Commerce: Challenges and Opportunities i...
Optimization of Digital-Based MSME E-Commerce: Challenges and Opportunities i...
 
Modal Space Controller for Hydraulically Driven Six Degree of Freedom Paralle...
Modal Space Controller for Hydraulically Driven Six Degree of Freedom Paralle...Modal Space Controller for Hydraulically Driven Six Degree of Freedom Paralle...
Modal Space Controller for Hydraulically Driven Six Degree of Freedom Paralle...
 
Capacity Expansion Banes in Indian Steel Industry
Capacity Expansion Banes in Indian Steel IndustryCapacity Expansion Banes in Indian Steel Industry
Capacity Expansion Banes in Indian Steel Industry
 
Metamorphosing Indian Blockchain Ecosystem
Metamorphosing Indian Blockchain EcosystemMetamorphosing Indian Blockchain Ecosystem
Metamorphosing Indian Blockchain Ecosystem
 

Último

Day 0- Bootcamp Roadmap for PLC Bootcamp
Day 0- Bootcamp Roadmap for PLC BootcampDay 0- Bootcamp Roadmap for PLC Bootcamp
Day 0- Bootcamp Roadmap for PLC BootcampPLCLeadershipDevelop
 
Call Now Pooja Mehta : 7738631006 Door Step Call Girls Rate 100% Satisfactio...
Call Now Pooja Mehta :  7738631006 Door Step Call Girls Rate 100% Satisfactio...Call Now Pooja Mehta :  7738631006 Door Step Call Girls Rate 100% Satisfactio...
Call Now Pooja Mehta : 7738631006 Door Step Call Girls Rate 100% Satisfactio...Pooja Nehwal
 
CALL ON ➥8923113531 🔝Call Girls Charbagh Lucknow best sexual service
CALL ON ➥8923113531 🔝Call Girls Charbagh Lucknow best sexual serviceCALL ON ➥8923113531 🔝Call Girls Charbagh Lucknow best sexual service
CALL ON ➥8923113531 🔝Call Girls Charbagh Lucknow best sexual serviceanilsa9823
 
internal analysis on strategic management
internal analysis on strategic managementinternal analysis on strategic management
internal analysis on strategic managementharfimakarim
 
Dealing with Poor Performance - get the full picture from 3C Performance Mana...
Dealing with Poor Performance - get the full picture from 3C Performance Mana...Dealing with Poor Performance - get the full picture from 3C Performance Mana...
Dealing with Poor Performance - get the full picture from 3C Performance Mana...Hedda Bird
 
Reviewing and summarization of university ranking system to.pptx
Reviewing and summarization of university ranking system  to.pptxReviewing and summarization of university ranking system  to.pptx
Reviewing and summarization of university ranking system to.pptxAss.Prof. Dr. Mogeeb Mosleh
 
BDSM⚡Call Girls in Sector 99 Noida Escorts >༒8448380779 Escort Service
BDSM⚡Call Girls in Sector 99 Noida Escorts >༒8448380779 Escort ServiceBDSM⚡Call Girls in Sector 99 Noida Escorts >༒8448380779 Escort Service
BDSM⚡Call Girls in Sector 99 Noida Escorts >༒8448380779 Escort ServiceDelhi Call girls
 
VIP 7001035870 Find & Meet Hyderabad Call Girls Ameerpet high-profile Call Girl
VIP 7001035870 Find & Meet Hyderabad Call Girls Ameerpet high-profile Call GirlVIP 7001035870 Find & Meet Hyderabad Call Girls Ameerpet high-profile Call Girl
VIP 7001035870 Find & Meet Hyderabad Call Girls Ameerpet high-profile Call Girladitipandeya
 
situational leadership theory by Misba Fathima S
situational leadership theory by Misba Fathima Ssituational leadership theory by Misba Fathima S
situational leadership theory by Misba Fathima Smisbafathima9940
 
Agile Coaching Change Management Framework.pptx
Agile Coaching Change Management Framework.pptxAgile Coaching Change Management Framework.pptx
Agile Coaching Change Management Framework.pptxalinstan901
 
Construction Project Management | Coursera 2024
Construction Project Management | Coursera 2024Construction Project Management | Coursera 2024
Construction Project Management | Coursera 2024Alex Marques
 
Continuous Improvement Infographics for Learning
Continuous Improvement Infographics for LearningContinuous Improvement Infographics for Learning
Continuous Improvement Infographics for LearningCIToolkit
 

Último (20)

Day 0- Bootcamp Roadmap for PLC Bootcamp
Day 0- Bootcamp Roadmap for PLC BootcampDay 0- Bootcamp Roadmap for PLC Bootcamp
Day 0- Bootcamp Roadmap for PLC Bootcamp
 
Leadership in Crisis - Helio Vogas, Risk & Leadership Keynote Speaker
Leadership in Crisis - Helio Vogas, Risk & Leadership Keynote SpeakerLeadership in Crisis - Helio Vogas, Risk & Leadership Keynote Speaker
Leadership in Crisis - Helio Vogas, Risk & Leadership Keynote Speaker
 
Call Now Pooja Mehta : 7738631006 Door Step Call Girls Rate 100% Satisfactio...
Call Now Pooja Mehta :  7738631006 Door Step Call Girls Rate 100% Satisfactio...Call Now Pooja Mehta :  7738631006 Door Step Call Girls Rate 100% Satisfactio...
Call Now Pooja Mehta : 7738631006 Door Step Call Girls Rate 100% Satisfactio...
 
Call Girls Service Tilak Nagar @9999965857 Delhi 🫦 No Advance VVIP 🍎 SERVICE
Call Girls Service Tilak Nagar @9999965857 Delhi 🫦 No Advance  VVIP 🍎 SERVICECall Girls Service Tilak Nagar @9999965857 Delhi 🫦 No Advance  VVIP 🍎 SERVICE
Call Girls Service Tilak Nagar @9999965857 Delhi 🫦 No Advance VVIP 🍎 SERVICE
 
Discover -CQ Master Class - Rikita Wadhwa.pdf
Discover -CQ Master Class - Rikita Wadhwa.pdfDiscover -CQ Master Class - Rikita Wadhwa.pdf
Discover -CQ Master Class - Rikita Wadhwa.pdf
 
CALL ON ➥8923113531 🔝Call Girls Charbagh Lucknow best sexual service
CALL ON ➥8923113531 🔝Call Girls Charbagh Lucknow best sexual serviceCALL ON ➥8923113531 🔝Call Girls Charbagh Lucknow best sexual service
CALL ON ➥8923113531 🔝Call Girls Charbagh Lucknow best sexual service
 
internal analysis on strategic management
internal analysis on strategic managementinternal analysis on strategic management
internal analysis on strategic management
 
Dealing with Poor Performance - get the full picture from 3C Performance Mana...
Dealing with Poor Performance - get the full picture from 3C Performance Mana...Dealing with Poor Performance - get the full picture from 3C Performance Mana...
Dealing with Poor Performance - get the full picture from 3C Performance Mana...
 
Unlocking the Future - Dr Max Blumberg, Founder of Blumberg Partnership
Unlocking the Future - Dr Max Blumberg, Founder of Blumberg PartnershipUnlocking the Future - Dr Max Blumberg, Founder of Blumberg Partnership
Unlocking the Future - Dr Max Blumberg, Founder of Blumberg Partnership
 
Reviewing and summarization of university ranking system to.pptx
Reviewing and summarization of university ranking system  to.pptxReviewing and summarization of university ranking system  to.pptx
Reviewing and summarization of university ranking system to.pptx
 
BDSM⚡Call Girls in Sector 99 Noida Escorts >༒8448380779 Escort Service
BDSM⚡Call Girls in Sector 99 Noida Escorts >༒8448380779 Escort ServiceBDSM⚡Call Girls in Sector 99 Noida Escorts >༒8448380779 Escort Service
BDSM⚡Call Girls in Sector 99 Noida Escorts >༒8448380779 Escort Service
 
VIP 7001035870 Find & Meet Hyderabad Call Girls Ameerpet high-profile Call Girl
VIP 7001035870 Find & Meet Hyderabad Call Girls Ameerpet high-profile Call GirlVIP 7001035870 Find & Meet Hyderabad Call Girls Ameerpet high-profile Call Girl
VIP 7001035870 Find & Meet Hyderabad Call Girls Ameerpet high-profile Call Girl
 
Disrupt or be Disrupted - Kirk Vallis.pdf
Disrupt or be Disrupted - Kirk Vallis.pdfDisrupt or be Disrupted - Kirk Vallis.pdf
Disrupt or be Disrupted - Kirk Vallis.pdf
 
Imagine - HR; are handling the 'bad banter' - Stella Chandler.pdf
Imagine - HR; are handling the 'bad banter' - Stella Chandler.pdfImagine - HR; are handling the 'bad banter' - Stella Chandler.pdf
Imagine - HR; are handling the 'bad banter' - Stella Chandler.pdf
 
situational leadership theory by Misba Fathima S
situational leadership theory by Misba Fathima Ssituational leadership theory by Misba Fathima S
situational leadership theory by Misba Fathima S
 
Agile Coaching Change Management Framework.pptx
Agile Coaching Change Management Framework.pptxAgile Coaching Change Management Framework.pptx
Agile Coaching Change Management Framework.pptx
 
Intro_University_Ranking_Introduction.pptx
Intro_University_Ranking_Introduction.pptxIntro_University_Ranking_Introduction.pptx
Intro_University_Ranking_Introduction.pptx
 
Peak Performance & Resilience - Dr Dorian Dugmore
Peak Performance & Resilience - Dr Dorian DugmorePeak Performance & Resilience - Dr Dorian Dugmore
Peak Performance & Resilience - Dr Dorian Dugmore
 
Construction Project Management | Coursera 2024
Construction Project Management | Coursera 2024Construction Project Management | Coursera 2024
Construction Project Management | Coursera 2024
 
Continuous Improvement Infographics for Learning
Continuous Improvement Infographics for LearningContinuous Improvement Infographics for Learning
Continuous Improvement Infographics for Learning
 

The Likelihood Ratio Test in Structural Equation Models: A Multi-Group Approach to Portuguese Material Deprivation

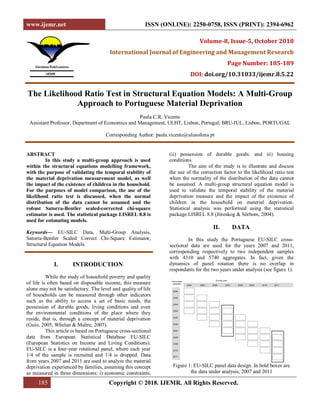
  • 1. www.ijemr.net ISSN (ONLINE): 2250-0758, ISSN (PRINT): 2394-6962 185 Copyright © 2018. IJEMR. All Rights Reserved. Volume-8, Issue-5, October 2018 International Journal of Engineering and Management Research Page Number: 185-189 DOI: doi.org/10.31033/ijemr.8.5.22 The Likelihood Ratio Test in Structural Equation Models: A Multi-Group Approach to Portuguese Material Deprivation Paula C.R. Vicente Assistant Professor, Department of Economics and Management, ULHT, Lisbon, Portugal; BRU-IUL, Lisbon, PORTUGAL Corresponding Author: paula.vicente@ulusofona.pt ABSTRACT In this study a multi-group approach is used within the structural equations modelling framework, with the purpose of validating the temporal stability of the material deprivation measurement model, as well the impact of the existence of children in the household. For the purposes of model comparison, the use of the likelihood ratio test is discussed, when the normal distribution of the data cannot be assumed and the robust Satorra-Bentler scaled-corrected chi-square estimator is used. The statistical package LISREL 8.8 is used for estimating models. Keywords— EU-SILC Data, Multi-Group Analysis, Satorra-Bentler Scaled Correct Chi-Square Estimator, Structural Equation Models. I. INTRODUCTION While the study of household poverty and quality of life is often based on disposable income, this measure alone may not be satisfactory. The level and quality of life of households can be measured through other indicators such as the ability to access a set of basic needs, the possession of durable goods, living conditions and even the environmental conditions of the place where they reside, that is, through a concept of material deprivation (Guio, 2005; Whelan & Maître, 2007). This article is based on Portuguese cross-sectional data from European Statistical Database EU-SILC (European Statistics on Income and Living Conditions). EU-SILC is a four-year rotational panel, where each year 1/4 of the sample is recruited and 1/4 is dropped. Data from years 2007 and 2011 are used to analyze the material deprivation experienced by families, assuming this concept as measured in three dimensions: i) economic constraints; (ii) possession of durable goods; and iii) housing conditions. The aim of the study is to illustrate and discuss the use of the correction factor to the likelihood ratio test when the normality of the distribution of the data cannot be assumed. A multi-group structural equation model is used to validate the temporal stability of the material deprivation measure and the impact of the existence of children in the household on material deprivation. Statistical analysis was performed using the statistical package LISREL 8.8 (Jöreskog & Sörbom, 2004). II. DATA In this study the Portuguese EU-SILC cross- sectional data are used for the years 2007 and 2011, corresponding respectively to two independent samples with 4310 and 5740 aggregates. In fact, given the dynamics of panel rotation there is no overlap in respondents for the two years under analysis (see figure 1). Panel year selected 2004 2005 2006 2007 2008 2004 2004 2004 2004 2005 2006 2007 2008 2009 2009 2010 2011 2010 Survey year 2011 Figure 1: EU-SILC panel data design. In bold boxes are the data under analysis, 2007 and 2011
  • 2. www.ijemr.net ISSN (ONLINE): 2250-0758, ISSN (PRINT): 2394-6962 186 Copyright © 2018. IJEMR. All Rights Reserved. The variables under study were obtained as sums of items for each of the three dimensions of material deprivation considered: i) economic constraints; (ii) possession of durable goods; and iii) housing conditions. The economic constraints dimension includes the lack of financial capacity to: i1) have a meal of meat or fish at least every two days, or the equivalent if vegetarian; i2) pay one week annual holidays away from home; i3) bear unexpected expenses, without resorting to credit; i4) keep the house adequately warm; and i5) meet the usual expenses and charges without difficulty. The possession dimension of durable goods considers the lack of economic availability to own: ii1) fixed or mobile telephone; ii2) color TV; ii3) washing machine; and ii4) car (passenger or mixed). The dimension housing conditions includes problems such as: iii1) leaking damp walls/floors/foundations, or rot in window frames or floor; iii2) insufficient light; iii3) absence of indoor toilet for sole use of the household; and iii4) absence of indoor bath or shower. Thus, the economic constraints dimension takes values from 0 to 5 items of deprivation, the possession dimension of goods assumes values between 0 and 4 missing items, and the dimension housing conditions takes values between 0 and 4 problems. The distribution of deprivation observed in each of the three dimensions for the two years under analysis is shown in table 1. Regarding the economic constraints, analysis of table 1 shows that 67.1% of the households do not have the financial capacity to meet 2 or more items in 2007, decreasing this percentage to 61% in 2011. Conversely, it should be noted that the high percentage of households that are not deprived of any item in possession of goods dimension, 82.7% and 85.8%, respectively, in 2007 and 2011. Also, the housing conditions dimension presents a high number of households with no problems, 67.2% and 73.5%, in 2007 and 2011, respectively. When asked about the existence of children in the household, 36.83% of the families have children, in 2007, and that percentage is 31.8%, in 2011. Table 1: Percentage of households with deprivation in each dimension (more items corresponds to more deprivation) III. METHODOLOGICAL APPROACH A structural equation model is used to explain the material deprivation, measured in the three dimensions mentioned above, as a function of the existence of children in the household, as represented in figure 2. Material Deprivation Economic Constrains Possession of Durable Goods Housing Conditions Children in the household γ λ1 λ2 λ3 δ1 δ2 δ3 Figure 2: Structural equation model: having children is a possible determinant of material deprivation (measured by three indicators – the three material deprivation dimensions) Structural equation modelling is one of the most important statistical techniques of multivariate analysis and can be seen as a combination of confirmatory factorial analysis (the measurement model) and linear regression (the structural model). The measurement model represents the relationship between the observed variables and the latent variables, while the structural model represents the dependencies among latent variables. It has the great advantage of allowing the simultaneous estimation of a set of dependency relationships between variables that may be latent, considering the component of the measurement error, Bollen (1989). Regarding the model considered in this study and presented in figure 2, it should be noted that in terms of modeling, it is necessary to consider a latent variable underlying the observed explanatory variable, existence of children in the household, where γ the regression coefficient measures the relation between this latent variable and the latent material deprivation variable. The relationship between observed variables, economic constraints, possession of durable goods and housing conditions, with the latent variable material deprivation being measured by the factorial loadings represented by λ1, λ2 and λ3, respectively. The measurement errors associated with the three observed variables are represented by δ1, δ2 and δ3. A longitudinal approach to the problem of material deprivation is proposed, using a multi-group structural equation model (Bollen, 1989; Schumacker & Lomax, 2010). In a multi-group analysis, it is possible to verify the existence of different behaviors by the different groups in relation to the concept under study, these groups being different temporal moments. For each of these groups a model must be defined. Then, equality constraints are imposed on parameters of the different groups.
  • 3. www.ijemr.net ISSN (ONLINE): 2250-0758, ISSN (PRINT): 2394-6962 187 Copyright © 2018. IJEMR. All Rights Reserved. Considered a baseline model (M1), and a model in which restrictions are imposed to the parameters (M0). M0 can be considered a nested model of the baseline model, M1. From a statistical point of view, two nested models can be compared by calculating the difference between the chi- square values of the two models (∆χ2 ). Assuming data are normally distributed the difference is chi-square distributed. The corresponding degrees of freedom (∆df) are given by the difference of degrees of freedom of the two nested models. The null hypothesis under test is the invariance of the parameters in both models, and the value of ∆χ2 obtained must be compared with the critical value of a chi-square distribution with degrees of freedom given by ∆df. Rejecting the null hypothesis corresponds to concluding that the two models are not equivalent, that is, the baseline model (M1) fits the data better than the restricted model (M0). This chi-square difference test is also known as the likelihood ratio test. IV. THE LIKELIHOOD RATIO TEST AND THE CORRECTION FACTOR In structural equation models and for model estimation purposes, when the multivariate normality of the data distribution cannot be assumed, statistical packages such as LISREL and Mplus provide the use of a robust estimator or an ADF (Asymptotically Distribution Free) estimator: the Satorra-Bentler scaled-corrected chi- square. Such an estimator was proposed for data whose distribution deviates from the normal in terms of skewness and / or kurtosis (for metric variables or for ordinal variables for which a metric latent variable is assumed). When the normality of the data distribution cannot be assumed, and if the purpose is model comparison, the likelihood ratio test cannot be directly applied, since, due to the correction factor, the chi-square difference distribution is no longer a chi-square. In these circumstances, Bryant & Satorra (2012) recommend the application of a correction factor on the likelihood ratio test, for which an EXCEL macro for LISREL, EQS and Mplus users was made available in 2013, (Bryant & Satorra, 2013). Using the adjustment measures provided by the statistical package, Min Fit Function Maximum Likelihood chi-square (T1), Normal Theory Weighted Least Squares chi-square (T2) and Satorra-Bentler chi-square (T3), the procedure consists of two steps. First, a correction factor for the chi-square difference test (cd) is calculated as follows , (1) in which, and are the degrees of freedom for the two models M0 (model with imposed restrictions) and M1 (baseline model), respectively. and are the correction factors for each of the models (M0 and M1) and are calculated as and , (2) with and the obtained values of T2 and T3, for M0 model, and the obtained values of T2 and T3 for M1 model. Then Satorra-Bentler scaled difference chi-square test value (Td) is computed as follows , (3) with and the obtained Min Fit Function Maximum Likelihood chi-square values for the M0 and M1 models, respectively. The degrees of freedom for this corrected chi-square difference test are ( ). V. RESULTS This study aims to illustrate the use of the macro built by Bryant and Satorra to estimate the proposed model to explain material deprivation in the years 2007 and 2011, using a multi-group approach. Thus, for each of the years 2007 and 2011, the model represented in figure 2 is specified, and a multi-group analysis was carried out to assess the temporal stability of the proposed factor structure, as well as the stability of the impact of the existence of children in the household at each of the two time points. The models considered for comparison in multi- group analysis are : Baseline model, with no restrictions of invariance between the two groups (subpopulations in 2007 and 2011); : Model with factor loadings invariance restriction in the two groups, that is, ; : Model with regression coefficient invariance restriction, that is, ; : Model with factor loadings and regression coefficient invariance restrictions, that is, and . Adjustment measures calculated by LISREL 8.8 statistical package for the four models under analysis are shown in Table 2. These results allow to calculate the chi- square test difference values for each of the three hypotheses, H0 (1) , H0 (2) and H0 (3) , in order to measure the invariance of the weights of different dimensions of material deprivation at the two time points, as well as the temporal invariance of the effect of the existence of children in the household on the material deprivation level. Models degrees of freedom T1 T2 T3 M1 4 256.98 246.57 72.16 M0 (1) 6 273.64 262.81 84.00 M0 (2) 5 261.35 251.25 78.53 M0 (3) 7 278.21 268.74 88.75 Table 2: Adjustment measures given by LISREL 8.8, for the models under analysis
  • 4. www.ijemr.net ISSN (ONLINE): 2250-0758, ISSN (PRINT): 2394-6962 188 Copyright © 2018. IJEMR. All Rights Reserved. : is valid, that is, exists factor loadings invariance at the two time points, 2007 and 2011; : is valid, that is, exists coefficient regression invariance at the two time points, 2007 and 2011; : is valid, that is, exists factor loadings and coefficient regression invariance at the two time points, 2007 and 2011. Table 3 presents the test values for the usual chi- square difference (assuming normal distribution of data) and for this difference with correction factor. The degrees of freedom of each one of the tests carried out are presented in the first column. The second and third columns correspond to the results of tests with no correction factor. The fourth column corresponds to chi- square tests with correction factor. The analysis of this table allows identical conclusions when comparing the models M0 (1) vs M1, and M0 (3) vs M1, using the chi-square difference test without the correction factor and with the correction factor. That is, the hypotheses of the invariance of the factorial loadings in the first case and, in the second case, of invariance of the factorial loadings and the regression coefficient in the years 2007 and 2011 are rejected. Consequently, M1 must be chosen instead of M0 (1) and of M0 (3) . When comparing M0 (2) versus M1 (that is, testing the hypothesis, H0 (2) , that M0 (2) is valid), using the chi- square difference test without the correction factor (procedure considered incorrect), it is possible to conclude about the rejection of the hypothesis of regression coefficient invariance at the two different time points (2007 and 2011) and the consequent choice of M1. Using the chi-square difference test with the correction factor (procedure considered appropriate) the opposite conclusion is obtained. Thus, it is possible to conclude that there is no significant difference in the value of γ at the two different moments. In fact, the null hypothesis that M0 (2) is valid, and must be the chosen model, is not rejected. ∆ degrees of freedom ∆ Min Fit ML χ2 ∆ Satorra- Bentler χ2 ∆ Satorra- Bentler scaled corrected χ2 M0 (1) vs M1 2 16.66 (0.0001) 11.84 (0.0013) 6.528 (0.0382) M0 (2) vs M1 1 4.37 (0.0215) 6.37 (0.0065) 1.8763 (0.1708) M0 (3) vs M1 3 21.23 (0.0000) 16.59 (0.0004) 9.4596 (0.0374) Table 3: Obtained values of the chi-square difference (p values) and degrees of freedom The factorial loadings of the indicators obtained in the model M0 (2) adjustment are presented in table 4, and it is possible to conclude that the economic constraints and possession of goods are the indicators that present greater weight in material deprivation in the years 2007 and 2011. The possession of goods dimension had an increasing relative weight from 2007 to 2011 in terms of material deprivation (from 0.78 to 0.83), while the relative weight of the housing condition dimension decreased in the same period (from 0.53 to 0.45). 2007 2011 λ1 0.71 0.71 λ2 0.78 0.83 λ3 0.53 0.45 γ -0.14 Table 4: Obtained values for structural equation model parameters, in 2007 and 2011 The estimated value for the impact of children in the household on material deprivation is negative, -0.14, which means that households with children have lower levels of material deprivation. VI. CONCLUSION The application of the multi-group analysis within the structural equation modelling framework allows testing the stability of the factorial structure of the material deprivation concept at the two time periods, 2007 and 2011, and / or the stability of the impact of the existence of children in the material deprivation level experienced by the families. Thus, it is possible to conclude that there is no stability of the material deprivation measurement model in the two time periods, 2007 and 2011, increasing the weight of the possession of goods and decreasing the problems in housing conditions. On the contrary, there is evidence that the impact of the existence of children in the household on material deprivation levels remains constant from 2007 to 2011. On the other hand, it is possible to conclude, that performing a multi-group analysis ignoring the correction factor on the statistic of the likelihood ratio test (and not using the Satorra-Bentler scaled chi-square difference test) may lead to statistically incorrect results. In some cases, these results can be contradictory. ACKNOWLEDGMENT The author acknowledges the support of Maria de Fátima Salgueiro, Instituto Universitário de Lisboa (ISCTE-IUL), Portugal.
  • 5. www.ijemr.net ISSN (ONLINE): 2250-0758, ISSN (PRINT): 2394-6962 189 Copyright © 2018. IJEMR. All Rights Reserved. REFERENCES [1] Bollen, K. (1989). Structural equations with latent variables. New York: Wiley. [2] Bryant, F. B. & Satorra, A. (2012). Principles and practice of scaled difference chi-square testing. Structural Equation Modelling, 19(3), 372-398. [3] Bryant, F. B. & Satorra, A. (2013). EXCEL macro file for conducting scaled difference chi-square tests via LISREL 8, LISREL 9, EQS and Mplus. Retrieved from: www.eco.upf.edu/~satorra. [4] Guio, A. (2005) Material deprivation in the EU. Statistics in Focus, Population and Social Conditions and Welfare, 21. [5] Jöreskog, K.G. & Sörbom, D. (2004). LISREL8, Chicago IL: Scientific Software International, Inc. [6] Schumacker, R.E. & Lomax, R.G. (2010). A beginner’s guide to structural equation modelling. (3rd ed.). Routledge, New York: Taylor & Francis Group. [7] Whelan, C.T. & Maître, B. (2007). Measuring material deprivation with EU-SILC: Lessons from the Irish survey. European Societies, 9, 147-173.