Tricumen / European vs US i-banks_Revenue dynamics 2007-15_210316
•
1 gostou•159 visualizações

European vs US investment banks: Revenue dynamics 2007-2015 European banks have lost market share in capital markets in a trend that began in 2010. This is most apparent in FICC, but Europeans have also lost ground in bond issuance, M&A/Advisory, ECM, and cash and equity derivatives. Prime services is the only product area in which European banks advanced strongly - at least until a modest downturn in 2015. The 2016 outlook for European banks is particularly weak in primary activities and cash equities.

Recomendados
Mais conteúdo relacionado
Destaque
Mais de Tricumen Ltd
Mais de Tricumen Ltd (20)
Último
Último (20)
Tricumen / European vs US i-banks_Revenue dynamics 2007-15_210316
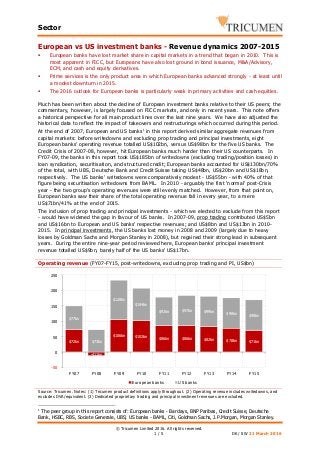
- 1. Sector © Tricumen Limited 2016. All rights reserved. 1 / 5 DK / SW 21 March 2016 European vs US investment banks - Revenue dynamics 2007-2015 European banks have lost market share in capital markets in a trend that began in 2010. This is most apparent in FICC, but Europeans have also lost ground in bond issuance, M&A/Advisory, ECM, and cash and equity derivatives. Prime services is the only product area in which European banks advanced strongly - at least until a modest downturn in 2015. The 2016 outlook for European banks is particularly weak in primary activities and cash equities. Much has been written about the decline of European investment banks relative to their US peers; the commentary, however, is largely focused on FICC markets, and only in recent years. This note offers a historical perspective for all main product lines over the last nine years. We have also adjusted the historical data to reflect the impact of takeovers and restructurings which occurred during this period. At the end of 2007, European and US banks1 in this report derived similar aggregate revenues from capital markets: before writedowns and excluding prop trading and principal investments, eight European banks' operating revenue totalled US$102bn, versus US$98bn for the five US banks. The Credit Crisis of 2007-08, however, hit European banks much harder than their US counterparts. In FY07-09, the banks in this report took US$185bn of writedowns (excluding trading/position losses) in loan syndication, securitisation, and structured credit; European banks accounted for US$130bn/70% of the total, with UBS, Deutsche Bank and Credit Suisse taking US$48bn, US$20bn and US$18bn, respectively. The US banks' writedowns were comparatively modest - US$55bn - with 40% of that figure being securitisation writedowns from BAML. In 2010 - arguably the first 'normal' post-Crisis year - the two group’s operating revenues were still evenly matched. However, from that point on, European banks saw their share of the total operating revenue fall in every year, to a mere US$71bn/41% at the end of 2015. The inclusion of prop trading and principal investments - which we elected to exclude from this report - would have widened the gap in favour of US banks. In 2007-09, prop trading contributed US$5bn and US$16bn to European and US banks' respective revenues; and US$8bn and US$13bn in 2010- 2015. In principal investments, the US banks lost money in 2008 and 2009 (largely due to heavy losses by Goldman Sachs and Morgan Stanley in 2008), but regained their strong lead in subsequent years. During the entire nine-year period reviewed here, European banks' principal investment revenue totalled US$9bn, barely half of the US banks' US$17bn. Operating revenue (FY07-FY15, post-writedowns, excluding prop trading and PI, US$bn) Source: Tricumen. Notes: (1) Tricumen product definitions apply throughout. (2) Operating revenue includes writedowns, and excludes DVA/equivalent. (3) Dedicated proprietary trading and principal investment revenues are excluded. 1 The peer group in this report consists of: European banks - Barclays, BNP Paribas, Credit Suisse, Deutsche Bank, HSBC, RBS, Societe Generale, UBS; US banks - BAML, Citi, Goldman Sachs, J.P.Morgan, Morgan Stanley. $72bn -$11bn $106bn $102bn $86bn $86bn $82bn $78bn $71bn $77bn $73bn $128bn $104bn $92bn $97bn $99bn $98bn $98bn -50 0 50 100 150 200 250 FY07 FY08 FY09 FY10 FY11 FY12 FY13 FY14 FY15 European banks US banks
- 2. Sector © Tricumen Limited 2016. All rights reserved. 2 / 5 DK / SW 21 March 2016 DCM Bonds, ECM, M&A/Advisory Outside of securitisation and loan syndication, in dollar terms, European banks' total fee revenue from bond issuance, ECM and M&A/Advisory declined by US$4bn between 2007 and 2015 from US$17bn to US$13bn, while US banks' fees remained unchanged, at US$23bn. In bond issuance, the eight European banks barely held on to their market share of total fees even though their home region provided better revenue opportunity, especially in 2014. The outlook for European banks is weak: the sluggish growth in the eurozone suggests the corporate financing will remain subdued. More worryingly, European banks' share of the ECM fee pool steadily declined since 2012, even though the revenue opportunity in EMEA has been stronger than that in the US throughout this period. A healthy APAC market (e.g. in 2015) benefitted US banks more than their European counterparts. In M&A/Advisory, European banks have been steadily losing ground: in 2010, their share of the fee pool peaked at 40% before steadily declining to just 27% in 2015. A particularly pronounced drop in the last two full years reflect regional dynamics: US M&A deal volumes jumped in both 2014 and 2015, while in Europe M&A volumes grew 10% in 2014, but then declined by 8% in 2015. The gap could widen further in 2016: the US market will probably continue to benefit from low interest rates, resilient stock markets and abundant cash reserves at US firms and the private equity industry. Meanwhile, the next two largest M&A markets in 2015, UK and China, have slowed down due to fears of Brexit (in 1H16) and economic worries. DCM Bonds, ECM, M&A/Advisory (FY07-FY15) Source: Tricumen. Notes: (1) Tricumen product definitions apply throughout. (2) Operating revenue includes writedowns, and excludes DVA/equivalent. 20% 30% 40% 50% 60% FY07 FY08 FY09 FY10 FY11 FY12 FY13 FY14 FY15 FY16E DCM Bonds ECM M&A / Advisory European banks' % total operating revenue $0bn $5bn $10bn $15bn $20bn $25bn $30bn Europe USA Europe USA Europe USA Europe USA Europe USA Europe USA Europe USA Europe USA Europe USA Europe USA FY07 FY08 FY09 FY10 FY11 FY12 FY13 FY14 FY15 FY16E DCM Bonds ECM M&A / Advisory Pre-writedown operating revenue (US$bn)
- 3. Sector © Tricumen Limited 2016. All rights reserved. 3 / 5 DK / SW 21 March 2016 FICC The European banks' loss of ground to US banks was even greater in FICC. In FY07, the eight European peers' FICC operating revenue (excluding securitisation which, for the purposes of this report, we include in primary activities) reached US$48bn, far ahead of US banks' US$38bn. In 2008 and 2009, the revenue pool was equally divided between the two groups (US$45bn and US$77bn for both in 2008 and 2009), but US banks then powered ahead, increasing their lead to 7% in 2010 and growing it in each year until 2015, when they grossed US$43bn, 39% more than Europeans. All in all, European banks' revenue dropped by US$17bn between 2007 and 2015, while the US banks grew their revenue by US$5bn. The greatest contributor to European banks' decline were rates markets, as the earlier adoption of Basel 3 market risk rules led European banks to cut structured or long-dated business (which was in itself more prevalent in Europe than the US), where their FY15 revenue totalled US$12bn, barely half of that in 2007; US banks' earnings also fell, but by comparatively modest US$3bn/13%. The European banks' wholesale withdrawal from commodities markets (with exception of some derivatives and metals) removed an additional US$2.3bn from their revenue base (vs US$1.2bn for US banks) in the same period. At the same time, revenue from FX markets - narrowly the greatest contributor to European banks' 2015 revenue and the only FICC product area where Europeans have a strong lead - weakened by 9% since 2007, while the US banks advanced. This may reflect the shift to electronic trading where on balance US banks have had greater capabilities and seen greater IT investments. In credit markets, European banks initially held up better in the post-Crisis world, as European governments sought to support sovereign and corporate bond markets during the Eurozone crisis. However, Europeans have been hit harder by Basel 3 rules on CDS trading, bond balance sheets and structured credit and are now losing ground to Americans who in some cases have profited by helping European banks clean up their balance sheets. The FICC outlook for 2016 is muted, at best. G-SIB surcharge may weigh more heavily on US majors, but European banks remain vulnerable to a structural decline in their capital markets earnings and to regulatory pressure, especially on maintaining higher levels of capital and TLAC. FICC sales & trading (FY07-FY15) Source: Tricumen. Notes: (1) Tricumen product definitions apply throughout. (2) Operating revenue includes writedowns, and excludes DVA/equivalent. (3) The charts above includes net losses in credit markets - FY07: SocGen (US$3bn); FY08: Barclays (US$2bn), Royal Bank of Scotland (US$8.5bn), Goldman Sachs (US$900m) and Morgan Stanley (US$3bn). (4) Dedicated proprietary trading and principal investment revenues are excluded. 10% 20% 30% 40% 50% 60% 70% FY07 FY08 FY09 FY10 FY11 FY12 FY13 FY14 FY15 FY16E FX Rates Credit Commodities European banks' % total operating revenue -262% -$20bn $0bn $20bn $40bn $60bn $80bn Europe USA Europe USA Europe USA Europe USA Europe USA Europe USA Europe USA Europe USA Europe USA Europe USA FY07 FY08 FY09 FY10 FY11 FY12 FY13 FY14 FY15 FY16E FX Rates Credit Commodities Pre-writedown operating revenue (US$bn)
- 4. Sector © Tricumen Limited 2016. All rights reserved. 4 / 5 DK / SW 21 March 2016 Equities The Equity markets is one area where Europeans have held their ground, and advanced in prime services. European banks' combined equities revenue in 2015 reached US$22bn, compared to US$29bn in 2007 - a decline of US$6bn/22%. US banks grossed US$24bn (-5% vs 2007), overtaking their European counterparts for the first time since 2009, when they had a (very) narrow lead. In cash equities, which was largely spared the impact of regulation, European banks have been able to retain their market share until the inherently weak profitability of this product area - except for the few leaders - forced them to scale down their operations. Most recently, Barclays pulled out of most cash equity markets in APAC, and relinquished its DMM status on NYSE. American banks, by contrast, are (cautiously) investing: in addition to selective hiring by its peers, Citi in 3Q15 started a major investment in equities, including hi-touch cash. In derivatives, Europeans have lost 10% of the revenue pool since 2010 as the former derivatives powerhouses - Barclays, BNPP, Deutsche Bank and UBS – have seen their revenue drop by, on average, 47% between 2007 and 2015. SocGen and Credit Suisse - which grew revenues at a healthy rate following FY08 losses2 - are the only two European tier 1 players remaining. Among the US banks, J.P.Morgan, Morgan Stanley and Bank of America Merrill Lynch have made the greatest improvement during the period under review. Prime Services have been the one area where European banks have steadily advanced: aggregate revenue in 2015 totalled US$6bn, 30% ahead of 2007; US banks' revenue fell 5%. This partly reflects European banks' strength in synthetic prime and an institutionalisation of hedge fund AuM that has removed some of the advantages that US banks had in providing services such as capital introduction. In 2016, we expect that European banks will maintain their market share in equity derivatives, with any loss of the share of the revenue pool by some banks being picked up by BNP Paribas and/or SocGen. The outlook for prime services seems uncertain; European banks may make cuts due to capital constraints, to the benefit of US banks. Equities sales & trading (FY07-FY15) Source: Tricumen. Notes: (1) Tricumen product definitions apply throughout. (2) Operating revenue includes writedowns, and excludes DVA/equivalent. (3) Dedicated proprietary trading and principal investment revenues are excluded. 2 In 2008, the largest losses were incurred by Credit Suisse (US$3.3bn in flow, structured and corporate derivatives) and Deutsche Bank (US$2.5bn). Deutsche Bank suffered losses in 4Q15, due to 'challenging risk management in certain areas'. 30% 35% 40% 45% 50% 55% 60% 65% FY07 FY08 FY09 FY10 FY11 FY12 FY13 FY14 FY15 FY16E EQ Cash EQ Derv & Converts Prime Services European banks' % total operating revenue $0bn $5bn $10bn $15bn $20bn $25bn $30bn Europe USA Europe USA Europe USA Europe USA Europe USA Europe USA Europe USA Europe USA Europe USA Europe USA FY07 FY08 FY09 FY10 FY11 FY12 FY13 FY14 FY15 FY16E EQ Cash EQ Derv & Converts Prime Services Pre-writedown operating revenue (US$bn)
- 5. Sector © Tricumen Limited 2016. All rights reserved. 5 / 5 DK / SW 21 March 2016 About Tricumen Tricumen was founded in 2008. It quickly became a strong provider of diversified market intelligence across the capital markets and has since expanded into transaction and corporate banking coverage. Tricumen’s data has been used by many of the world’s leading investment banks as well as strategy consulting firms, investment managers and ‘blue chip’ corporations. Situated near Cambridge in the UK, Tricumen is almost exclusively staffed with senior individuals with an extensive track record of either working for or analysing banks; and boasts what we believe is the largest capital markets-focused research network of its peer group. Caveats This document may be reproduced or transmitted, provided that the information released is sourced to Tricumen and that it does not prejudice Tricumen Limited’s business or compromise the company’s ability to analyse the financial markets. Full acknowledgement of Tricumen Limited must be given. Tricumen Limited has used all reasonable care in writing, editing and presenting the information found in this report. All reasonable effort has been made to ensure the information supplied is accurate and not misleading. For the purposes of cross- market comparison, all numerical data is normalised in accordance to Tricumen Limited’s proprietary product classification. Fully-researched dataset may contain margin of error of 10%; for modelled datasets, this margin may be wider. The information and commentary provided in this report has been compiled for informational purposes only. We recommend that independent advice and enquiries should be sought before acting upon it. Readers should not rely on this information for legal, accounting, investment, or similar purposes. No part of this report constitutes investment advice, any form of recommendation, or a solicitation to buy or sell any instrument or to engage in any trading or investment activity or strategy. Tricumen Limited does not provide investment advice or personal recommendation nor will it be deemed to have done so. Tricumen Limited makes no representation, guarantee or warranty as to the suitability, accuracy or completeness of the report or the information therein. Tricumen Limited assumes no responsibility for information contained in this report and disclaims all liability arising from negligence or otherwise in respect of such information. Tricumen Limited is not liable for any damages arising in contract, tort or otherwise from the use of or inability to use this report or any material contained in it, or from any action or decision taken as a result of using the report. © Tricumen Limited 2016. All rights reserved.