

Recomendados
Mais conteúdo relacionado
Semelhante a Weekly Activity 28May-3Jun14
Semelhante a Weekly Activity 28May-3Jun14 (17)
Weekly Activity 28May-3Jun14
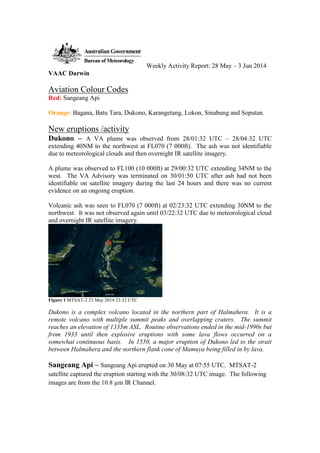
- 1. Weekly Activity Report: 28 May – 3 Jun 2014 VAAC Darwin Aviation Colour Codes Red: Sangeang Api Orange: Bagana, Batu Tara, Dukono, Karangetang, Lokon, Sinabung and Soputan. New eruptions /activity Dukono – A VA plume was observed from 28/01:32 UTC – 28/04:32 UTC extending 40NM to the northwest at FL070 (7 000ft). The ash was not identifiable due to meteorological clouds and then overnight IR satellite imagery. A plume was observed to FL100 (10 000ft) at 29/00:32 UTC extending 34NM to the west. The VA Advisory was terminated on 30/01:50 UTC after ash had not been identifiable on satellite imagery during the last 24 hours and there was no current evidence on an ongoing eruption. Volcanic ash was seen to FL070 (7 000ft) at 02/23:32 UTC extending 30NM to the northwest. It was not observed again until 03/22:32 UTC due to meteorological cloud and overnight IR satellite imagery. Figure 1 MTSAT-2 23 May 2014 23:32 UTC Dukono is a complex volcano located in the northern part of Halmahera. It is a remote volcano with multiple summit peaks and overlapping craters. The summit reaches an elevation of 1335m ASL. Routine observations ended in the mid-1990s but from 1933 until then explosive eruptions with some lava flows occurred on a somewhat continuous basis. In 1550, a major eruption of Dukono led to the strait between Halmahera and the northern flank cone of Mamuya being filled in by lava. Sangeang Api – Sangeang Api erupted on 30 May at 07:55 UTC. MTSAT-2 satellite captured the eruption starting with the 30/08:32 UTC image. The following images are from the 10.8 µm IR Channel.
- 2. Figure 1 MTSAT-2 30 May 2014 08:32 UTC 10.8 µm IR Figure 2 MTSAT-2 30 May 2014 10:32 UTC 10.8 µm IR The ash was caught up in a strong mid-level trough and quickly moved SE towards Australia. Figure 3 MTSAT-2 30 May 12:01 UTC 10.8 µm IR A notification was received for SO2. On the IASI MetOp-B image you can clearly see the correlation of SO2 with ash. Both the SO2 brightness temperature index and Ash Index are indicating high levels of confidence for SO2 and ash. Figure 4 IASI MetOp-B 30 May, 13:31 UTC Left: SO2 Brightness Temperature Index Right: Ash Index A second high level eruption occured at Sangeang Api at 30/17:32 UTC. It is seen on the MTSAT-2 image at 30/17:32 UTC.
- 3. Figure 5 MTSAT-2 30 May 17:32 UTC 10.8 µm IR The CIMSS Satellite Blog has archived several movie files of the eruptions from Sangeang Api on 30 May. The second high level eruption was also captured by the Suomi NPP VIIRS satellite which passed overhead at 17:45 UTC on 30 May. EUMETSAT posted images of the second eruption on its website. Figure 6 Suomi NPPVIIRS image 30 May 17:45 UTC Figure 2 Suomi NPP VIIRS image 30 May 17:45 UTC The VIIRS also included a Day-Night Band image. Figure 7 VIIRS Day-Night Band 30 May 17:45 UTC
- 4. The eruption over the next 24 hours is continuous. RGB and Split Window images from 31 May 04:32 UTC and 08:32 UTC show the ongoing significant eruption. Figure 8 MTSAT-2 RGB 31 May 04:32 UTC Figure 9MTSAT-2 Split Window 31 May 04:32 UTC Figure 10 MTSAT RGB 31 May 08:32 UTC Figure 3 MTSAT-2 Split Window 31 May 08:32 UTC Aqua MODIS had a pass over Sangeang Api on 31 May at 05:25 UTC. Ash (brownish colour) is seen spreading out across Indonesia and south of Sangeang Api. In Figure 18, a plume of ash is seen near the Kimberley in Western Australia. Figure 4 Aqua MODIS 31 May 2014 05:25 UTC Figure 5 Aqua MODIS 31 May 2014 05:25 UTC
- 5. The MTSAT-2 Split Window image shows that the eruption is beginning to decrease in intensity by 31/12:32 UTC. The height of the eruption at the volcano is lowered from FL450 (45 000ft) to FL200 (20 000ft). The volcanic ash cloud at FL450 has detached itself from the volcano. Figure 6 MTSAT-2 Split Window 31 May 12:32 UTC The IASI MetOp-A image in Figure 20 shows SO2 across the Top End of Australia down towards the Kimberley region and Top End but has a hole in its data over part of the two regions. The Ash Index in MetOp-B includes this analysis in its coverage for the Top End and the Kimberley region and show ash reach the Australian coast and pushing inward in Figure 21. Figure 15 IASI Met-Op-A. 31 May 2014, 13:55 UTC Left: SO2 Brightness Temperature Right: Ash Index
- 6. Figure 16 IASI Met-Op-B. 31 May 2014, 13:10 UTC Left: SO2 Brightness Temperature Right: Ash Index The ash to FL200 in Figure 22 can be seen heading south of the volcano. There is some discrepancy in this steady movement to the south with the wind profiles from the region. Figure 17 MTSAT-2 Visible 1 June 00:32 UTC Figure 18 GOME-2 SO2 1 June 2014 00:14 UTC A SACS multi-sensor notification of exceptional SO2 concentration was received on 1 June at 01:21 UTC for SO2. SO2 is seen from Indonesia to the Top End of Australia.
- 7. Figure 19 IASI Met-Op-B. 1 June 2014, 00:13 UTC Left: SO2 Brightness Temperature Right: Ash Index LANDSAT-8 flew over Sangeang Api on 1 June at 02:10 UTC. Peter Webley posted images from LANDSAT-8 and pointed out in addition to the plume there was a change in the ocean colour seen moving south-east away from the volcanic island. Figure 20 LANDSAT 8, NASA - Band 8, 02:10 UTC 1 June Figure 7 LANDSAT-8, NASA – RGB, 02:10 UTC 1 June The ash is seen moving south steadily on MTSAT-2 Visible from 01/00:32 – 01/05:32 UTC.
- 8. Figure 21 MTSAT-2 Visible, 1 June 05:32 UTC SO2 is seen on the OMI SO2 image from 01/ 06:18 UTC in an arc to the north and northeast of Sangeang Api. Figure 22 OMI SO2 1 June 06:18 UTC Ash is seen pushing south through the last visible image of the day at 01/08:32 UTC. The low level ash to FL200 (20 000ft) is not seen on overnight IR satellite imagery. Figure 238 MTSAT-2 1 June 08:32 UTC
- 9. Figure 24 MTSAT-2 1 June 23:32 UTC A low level eruption is seen on MTSAT-2 visible satellite at 01/23:32 UTC. Ash is seen 25NM from the volcano. Figure 25 GOME-2 SO2, 2 June 2014 01:33 Left: SO2 vertical column Right: Absorbing aerosol index SO2 is shown just to the east of Bali. VAAC Darwin received a call at 14:50 UTC on 2 June that 3 aircraft had a reported a sulphur smell around 5000-7000ft. near Denpasar. Ash was only detectable a short distance from the volcano but SO2 as shown in Figure 30 was seen east of Denpasar. Sangeang Api (8.2˚S and 119.07˚E) is a volcanic island located in the Flores Sea off the NE coast of Sumbawa. It is one of the most active volcanoes in the Lesser Sunda
- 10. Islands. The 13-km-wide island is formed by two volcanic cones, 1949m Doro Api and 1795m Dor Montoi. Sangeang Api is a complex type of volcano which exhibits both effusive and explosive eruptions. There have been at least 14 Volcanic Explosivity (VEI) 2 & 3 eruptions recorded at Sangeang Api since 1512, most of which have occurred in the 20th century. The island was evacuated after a VEI-3 eruption in 1988 and is now only intermittently occupied by agricultural workers. Sangeang Api had exhibited only low level volcanic activity for the 15 years since the last explosive eruption in 1999. Observatory Reports Indonesia – Center for Volcanology and Geological Hazard Mitigation (CVGM) Volcano – Sangeang Api Level II to Level III (Lesser Sunda Islands, Indonesia) Prior to the eruption of Sangeang Api on 30 May 2014, there was no change in the observed activity in the visual monitoring. Seismic activity at Sangeang Api fluctuated over the year with the highest value on 24 March with 58 Shallow Volcanic Earthquakes (VB) and 110 Deep Volcanic Earthquakes (VA). A continuous swarm of volcanic earthquakes were recorded two hours before the eruption. CVGHM raised the Alert Level from Level II to Level III. January 2014 – Thin white smoke with weak pressure 5-20 metres above summit. There were 366 Blowing Earthquakes, 197 Shallow Volcanic Earthquakes (VB) and 378 Deep Volcanic Earthquakes (VA). February 2014 – Thin white smoke observed with a weak high pressure 10-20 metres above the summit. There were 337 Blowing Earthquakes, 350 Shallow Volcanic Earthquakes (VB) and 537 Deep Volcanic Earthquakes (VA). March 2014 – Thin white smoke observed with a weak high pressure 10-20 metres above the summit. There were 557 Blowing Earthquakes, 481 Shallow Volcanic Earthquakes (VB) and 762 Deep Volcanic Earthquakes. April 2014 – Thin white smoke observed with a weak high pressure 10-25 metres above the summit. There were 544 Blowing Earthquakes, 483 Shallow Volcanic Earthquake (VB) and 635 Deep Volcanic Earthquakes (VA). 1-29 May 2014 – Thin white smoke observed with a weak high pressure 10-25 metres above the summit. There were 404 Blowing Earthquakes, 337 Shallow Volcanic Earthquakes (VB) and 460 Deep Volcanic Earthquakes (VA). 30 May 2014 – There was an eruption to 3000 metres at 07:55 UTC. From 29/21:00 UTC – 30/03:14 UTC tremors were recorded continuously with a maximum amplitude of 40 mm. From the time period of 03:14 – 05:48 UTC tremors recorded with a maximum amplitude of 20 mm. At 05:48 UTC until 07:55 UTC a swarm of volcanic earthquakes were recorded preceding the eruption.
- 11. Papua New Guinea – Rabaul Volcano Observatory (RVO) None Changes to Volcanic Activity Summary (VAS) Update to Dukono, Sangeang Api, Soputan and Sinabung. Soputan from Aviation Colour Code Orange to Yellow. Sangeang Api from Aviation Colour Code Yellow to Red. Maps of volcano locations and close-up views created from http://gis.icao.int/flexviewer/. MODIS Thermal Alerts – http://modis.higp.hawaii.edu/cgi-bin/modis/modisnew.cgi Centre for Volcanology and Geological Hazard Mitigation (CVGHM) http://www.vsi.esdm.go.id/ Merapi Volcano Observatory Rabaul Volcano Observatory Department of Mineral Policy and Geohazards Management (PNG) Global Volcanism Program http://www.volcano.si.edu/index.cfm background Volcano Discovery http://www.volcanodiscovery.com/volcanoes.html background Badan Meteorologi Klimatologi dan Geofisika – radar data Cyndee O’Quinn Seals – Weekly Activity Report Editor c.seals@bom.gov.au