Programmes of work for Core Unit 2002
•Transferir como PPTX, PDF•
2 gostaram•1,158 visualizações

Introduction to programmes of work for Construction students

Recomendados
Mais conteúdo relacionado
Mais procurados
Mais procurados (18)
Destaque
Destaque (12)
Semelhante a Programmes of work for Core Unit 2002
Semelhante a Programmes of work for Core Unit 2002 (20)
Mais de Steve Jarvis
Mais de Steve Jarvis (14)
Último
Último (20)
Programmes of work for Core Unit 2002
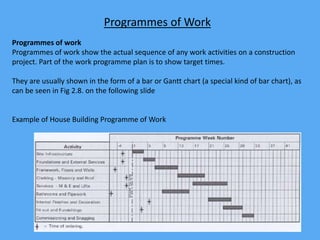
- 1. Programmes of Work Programmes of work Programmes of work show the actual sequence of any work activities on a construction project. Part of the work programme plan is to show target times. They are usually shown in the form of a bar or Gantt chart (a special kind of bar chart), as can be seen in Fig 2.8. on the following slide Example of House Building Programme of Work
- 2. In this figure: * On the left hand side all of the tasks are listed – note this is in logical Order * On the right the blocks show the target start and end date for each of the individual tasks * The timescale can be days, weeks or months.
- 3. Gantt Chart Far more complex forms of work programmes can also be created. The Gantt chart shown below (Fig 2.9) shows the construction of a house. This is a more complex example of a bar chart: There are two lines – they show the target dates and actual dates. The actual dates are shaded, showing when the work actually began and how long it actually took. If this bar chart is kept up to date an accurate picture of progress and estimated completion time can be seen.