L43026577
•
0 gostou•650 visualizações

International Journal of Engineering Research and Applications (IJERA) is an open access online peer reviewed international journal that publishes research and review articles in the fields of Computer Science, Neural Networks, Electrical Engineering, Software Engineering, Information Technology, Mechanical Engineering, Chemical Engineering, Plastic Engineering, Food Technology, Textile Engineering, Nano Technology & science, Power Electronics, Electronics & Communication Engineering, Computational mathematics, Image processing, Civil Engineering, Structural Engineering, Environmental Engineering, VLSI Testing & Low Power VLSI Design etc.

Recomendados
Recomendados
Mais conteúdo relacionado
Mais procurados
Mais procurados (16)
Destaque
Destaque (20)
Semelhante a L43026577
Semelhante a L43026577 (20)
Último
Último (20)
L43026577
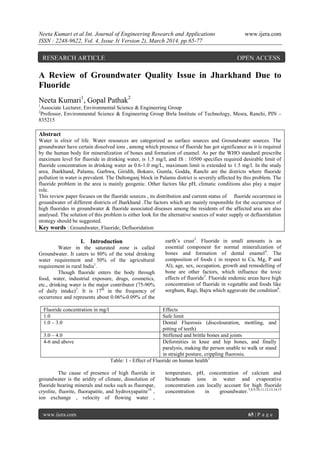
- 1. Neeta Kumari et al Int. Journal of Engineering Research and Applications www.ijera.com ISSN : 2248-9622, Vol. 4, Issue 3( Version 2), March 2014, pp.65-77 www.ijera.com 65 | P a g e A Review of Groundwater Quality Issue in Jharkhand Due to Fluoride Neeta Kumari1 , Gopal Pathak2 1 Associate Lecturer, Environmental Science & Engineering Group 2 Professor, Environmental Science & Engineering Group Birla Institute of Technology, Mesra, Ranchi, PIN – 835215 Abstract Water is elixir of life. Water resources are categorized as surface sources and Groundwater sources. The groundwater have certain dissolved ions , among which presence of fluoride has got significance as it is required by the human body for mineralization of bones and formation of enamel. As per the WHO standard prescribe maximum level for fluoride in drinking water, is 1.5 mg/l, and IS : 10500 specifies required desirable limit of fluoride concentration in drinking water as 0.6-1.0 mg/L, maximum limit is extended to 1.5 mg/l. In the study area, Jharkhand, Palamu, Garhwa, Giridih, Bokaro, Gumla, Godda, Ranchi are the districts where fluoride pollution in water is prevalent. The Daltonganj block in Palamu district is severely affected by this problem. The fluoride problem in the area is mainly geogenic. Other factors like pH, climatic conditions also play a major role. This review paper focuses on the fluoride sources , its distribution and current status of fluoride occurrence in groundwater of different districts of Jharkhand .The factors which are mainly responsible for the occurrence of high fluorides in groundwater & fluoride associated diseases among the residents of the affected area are also analysed. The solution of this problem is either look for the alternative sources of water supply or defluoridation strategy should be suggested. Key words : Groundwater, Fluoride, Defluoridation I. Introduction Water in the saturated zone is called Groundwater. It caters to 80% of the total drinking water requirement and 50% of the agricultural requirement in rural India1 . Though fluoride enters the body through food, water, industrial exposure, drugs, cosmetics, etc., drinking water is the major contributor (75-90% of daily intake)2 . It is 17th in the frequency of occurrence and represents about 0.06%-0.09% of the earth‟s crust3 . Fluoride in small amounts is an essential component for normal mineralization of bones and formation of dental enamel4 . The composition of foods ( in respect to Ca, Mg, P and Al), age, sex, occupation, growth and remodelling of bone are other factors, which influence the toxic effects of fluoride5 . Fluoride endemic areas have high concentration of fluoride in vegetable and foods like sorghum, Ragi, Bajra which aggravate the condition6 . Fluoride concentration in mg/l Effects 1.0 Safe limit 1.0 – 3.0 Dental Fluorosis (discolouration, mottling, and pitting of teeth) 3.0 – 4.0 Stiffened and brittle bones and joints 4-6 and above Deformities in knee and hip bones, and finally paralysis, making the person unable to walk or stand in straight posture, crippling fluorosis. Table: 1 - Effect of Fluoride on human health1 The cause of presence of high fluoride in groundwater is the aridity of climate, dissolution of fluoride bearing minerals and rocks such as fluorspar, cryolite, fluorite, fluorapatite, and hydroxyapatite10 , ion exchange , velocity of flowing water , temperature, pH, concentration of calcium and bicarbonate ions in water and evaporative concentration can locally account for high fluoride concentration in groundwater.7,8,9,10,11,12,13,14,15 RESEARCH ARTICLE OPEN ACCESS
- 2. Neeta Kumari et al Int. Journal of Engineering Research and Applications www.ijera.com ISSN : 2248-9622, Vol. 4, Issue 3( Version 2), March 2014, pp.65-77 www.ijera.com 66 | P a g e Mineral Composition Fluorite (Fluorspar CaF2 Fluorapatite Ca5(F,Cl)PO4 Micas Biotite Muscovite Lepidolite K(Mg Fe+2 )3(AlSi3)O10(OHF)2 KAl2(AlSi3 O 10)(OHF)2 K2(LiAl)5(Si 6 Al2 )O20 (OHF)4 Amphiboles Hornblende Tremolite Actinolite NaCa2(MgFe+2 )4 (AlFe+3 )(SiAl)8O22(OHF)2 Ca2(Mg Fe+2 )5(Si8O22) (OHF)2 Topaz Al2SiO4(OHF)2 Rock Phosphate NaCa2(MgFe+2 )4(AlFe+3 )(SiAl)8O22(OHF)2 Table - 2 showing the source of Fluoride in Groundwater16 Fig -1 Metabolism of Fluoride in the human body17 In endemic fluorosis zones, establishment of the relationship between various chemical characteristics like pH, total alkalinity, total hardness, Carbonate hardness, Non-Carbonate hardness, and excess alkalinity , with the Fluoride enrichment condition is an important aspect and can be used as indicators in delineation of fluorosis zones.18 II. Dental and Skeletal fluorosis Dental fluorosis, which is characterized by discolored, blackened, mottled or chalky white teeth, is a clear indication of overexposure to fluoride during childhood when the teeth were developing. Chronic intake of excessive fluoride can lead to the severe and permanent bone and joint deformations termed as skeletal fluorosis. UNICEF19 has published a simple guide to identify a fluorosis diseased person for they can not perform some basic exercise related to body posture. Left Column: Normal capacity person, Right Column: Fluorosis diseased person, Top – the person is unable to bend completely from the waist. ,Middle
- 3. Neeta Kumari et al Int. Journal of Engineering Research and Applications www.ijera.com ISSN : 2248-9622, Vol. 4, Issue 3( Version 2), March 2014, pp.65-77 www.ijera.com 67 | P a g e – unable to bend the neck to touch the chin on the chest and, Bottom – unable to bend arms to touch the back of head. Figure-2 showing. A simple guide to identify a fluorosis diseased person from body posture (UNICEF, 1996) There are different indices for dental fluorosis, which are illustrated in the following table Indices Developed by Weight Classification Dean‟s Index [20,21] H.T.Dean, 1934, 1942) 0-4 (0,0.5,1,2,3,4) Normal, questionable, very mild, Mild, Moderate, Moderately severe, severe Thylstrup and Fejerskov Index (TFI) [22] Thylstrup and Fejerskov (1978) 10 point ordinal scale (0 to 9) Based on histological changes that occur in dental fluorosis and increasing fluoride exposure Tooth surface index of fluorosis (TSIF) [23] Horowitz et.al. (1984) 8 point scale (0 to 7) Area of the teeth surface affected Fluorosis risk index (FRI) [24] Pendrys (1990) 6 point scale (0,1,2,3,7,9) Each tooth is divided into zones that correspond to the age at which they begin development. Table -3 Comparative chart of four indices for assessment of severity of Dental fluorosis III. International scenario for fluoride in their groundwater In 1984, WHO estimated that more than 260 million people living all over the world consume water with fluoride concentration above 1mg/l.25 UNICEF estimates that “ fluorosis is endemic in at least 25 countries” and Around 200 million people from 25 nations have health risks because of high fluoride in groundwater26 & in India , around 25 million people of 150 Districts are affected by fluorosis disease.27 Fig:3 Countries with endemic fluorosis because of high fluoride in drinking water28 IV. National scenario for fluoride in their groundwater In India In 2002, 17 states were affected by severe fluorosis29 and now the problem exist in 20 states indicating that endemic fluorosis has emerged as one of the most alarming public health problems of the country5 . In most part of the country , however , the water supplied through groundwater is beset with problems of quality30 . In some parts of india , the fluoride levels are below 0.5 mg/l, while at certain other places, fluoride levels are as high as 30 mg/l have been reported7 . World Bank , on 7th January 2014 ,Approved $500 Million to improve rural water supply and sanitation services in four indian states ,
- 4. Neeta Kumari et al Int. Journal of Engineering Research and Applications www.ijera.com ISSN : 2248-9622, Vol. 4, Issue 3( Version 2), March 2014, pp.65-77 www.ijera.com 68 | P a g e which includes Assam, Bihar, Jharkhand and Uttar Pradesh. About 7.8 million rural people are expected to directly benefit from the project. In India, about 62 million people are suffering from various levels of fluorosis , of which 6 million are children below the age of 14 years; they suffer from dental, skeletal, and/or non-skeletal fluorosis31 . Dental fluorosis is endemic in 14 states and 150,000 villages in india with the problem most pronounced in the states of Andhra Pradesh, Bihar, Gujarat,Madhya Pradesh, Punjab, Rajasthan,Tamil Nadu and Utter Pradesh32 . According to the Drinking Water Supply department, out of 593 districts , of whose data is available, groundwater in 203 districts has shown high fluoride33 . Region/State Fluoride concentration (mg per liter) Maximum severity of fluorosis observed North-West India 0.4 – 19 Severe Central India 0.2 – 10 Moderate South India 0.2 – 20 Severe Deccan Province 0.4 – 8 Moderate Table – 4 The distribution of fluoride in Indian groundwaters is shown in Table10, 34 Categories Percentage Name of States I 30% of the Districts Affected Jammu and Kashmir, Delhi, Kerala and Orissa II 30-50% of the Districts Affected Maharashtra, Karnataka and Bihar III 50-100% of the Districts Affected Uttar Pradesh, Rajasthan, Gujurat, Andhra Pradesh and Tamilnadu Table-5 Percentage Categories of Fluoride in Various States of India35,36,37,38 Source : UNICEF state of art report, 199928 . State in alphabetical order Source General range of Fluoride concentration in Groundwater Reference Central Rajasthan [40] Geological, Fluorine rich minerals and rock 0.5 – 5.8 mg/l J.Hussain et.al. (2013) Bassi tahsil of district Jaipur of Rajasthan [16] Geological, Fluorine rich minerals and rock 0.1 – 12.5 mg/l S.Saxena & saxena, (2013) Faridabad , Haryana [41] weathering of rocks and anthropogenic activities 1.0 – 40 mg/l Garg & Singh; (2013)
- 5. Neeta Kumari et al Int. Journal of Engineering Research and Applications www.ijera.com ISSN : 2248-9622, Vol. 4, Issue 3( Version 2), March 2014, pp.65-77 www.ijera.com 69 | P a g e Wailpalli watershed, Nalgonda district Andhra Pradesh [42] Geological and climatic conditions 0.97- 5.83 mg/l A.G.S.Reddy et.al (2010) Parts of Nalgonda district , Andhra Pradesh [43] Weathering of rocks & evaporation of Groundwater , Irrigation 0.1 – 8.8mg/l with a mean of 1.3 mg/l K.Brindha et.al. (2010) Ajmer (NW India) [44] Geological and climatic conditions 0.12 – 16.9 mg/l C.Vikas et.al. (2009) Mudhol Taluk , Karnataka [45] Less fluoride in water As per required prescribed limit because of more hardness in water. 0.06 - 0.573 mg/l P.D.Pol et.al. (2012) Patripal panchayat of Balasore , Odisha [35] Geological and climatic conditions 0.6 – 5.83 mg/l Kaushik kumar Das et.al. (2012) Karera block in Shivpuri district, Madhya Pradesh [46] Geological and climatic conditions 1.65 – 3.91 mg/l D.N.Saksena & Y.S.Narwaria (2012) Mathura district, Uttar Pradesh [47] Geological & anthropogenic 3.4 – 4.6 mg/l K.S.Rawat et.al. (2012) Anantapur District, Andhra Pradesh [48] Geological 1.8 – 5.2 mg/l V.Sunitha et.al. (2012) Talupula , Andhra Pradesh [49] Geological 0.78 – 6.10 mg/l Arveti Nagaraju et.al. (2010) Dindigul town, Tamilnadu [50] Geological and Anthropogenic 2.47 – 5.26 mg/l Mohamed Hanipha M. & Zahir Hussain A.(2013) Kommala area of Warangal district Andhra Pradesh [51] Geological 1.1 – 5.8 mg/l Veerati Radhika & G.V.Praveen (2012) Ottapidaram block Tamilnadu [52] Geological 0.936 – 4.34 mg/l V.Veeraputhiran & G.Alagumuthu (2010) Sonitpur District, Assam [53] Geological 0.17 – 5.602 mg/l Joydev Datta et.al. (2010) Guntur district, Andhra Pradesh [54] Hydro geochemical 0.3 – 1.8 mg/l N.Subba Rao (2010) Malpura Tehsil, Tonk, Rajasthan, India [55] Hydro geochemical 0.08 – 11.30 mg/l Girja Shankar Tailor & C.P.Singh Chandel (2010) Erode district, Tamilnadu [56] Geological and climatic condition 0.5 – 8.2 mg/l K.Karthikeyan et.al. (2010) Kadiri,Mudigubba & Nallamada mandals of Anantapur District, Andhra Pradesh [57] Geological and Climatic conditions 0.1 – 7.0 mg/l B.Muralidhara Reddy (2013) Dungarpur district of Rajasthan [58] Geological and Climatic conditions 1.5-4.4 mg/l S.L.Choubisa (2012) Rural habitations of central Rajasthan [59] Geological and Climatic conditions >1.5 – 5.91mg/l I.Hussain ,M.Arif & J.Hussain (2012) Kadayam block of Tirunelveli district [60] Geological, environmental & human activities 0.73 – 3.02 mg/l G.Alagumuthu & M.Rajan (2008) Rameswaram Area Tamilnadu, Southern India [61] Geological and Climatic conditions 1.5-2.5 mg/l V.Sivasankar & T Ramachandramoorthy. (2011)
- 6. Neeta Kumari et al Int. Journal of Engineering Research and Applications www.ijera.com ISSN : 2248-9622, Vol. 4, Issue 3( Version 2), March 2014, pp.65-77 www.ijera.com 70 | P a g e Mettur taluk of Salem District, Tamilnadu [62] Water-rock interaction 0.1-2.8 mg/l (pre- monsoon) 0.4-4.0 mg/l (Post- monsoon) K.Srinivasamoorthy et.al. (2010) Villages of Jind District, Haryana (India) [63] Water-rock interaction 0.2-2.0 mg/l Singh et.al. (2013) Deoli Tehsil (Tonk District) Rajasthan [64] Geological and Climatic conditions 0.3-9.6 mg/l Meena et.al. (2011) Table 7. Concentration of fluoride in groundwater and its sources in those states of India where fluoride problem is prevalent as per based on literature in last five years (2008-2013) apart from Jharkhand. Groundwater Scenario in the Study Area : Jharkhand Location of study area Fig : 3 Map Of Jharkhand [www.mapsofindia.com] Jharkhand means „The Forest Area‟,nearly 29% of the total geographical area is under forest foliage. Jharkhand is the 28th state in India having 13th rank as per the population and 15th rank considering the geographical area having 30% of the total population as tribal. The population of Jharkhand is 32,966,238 (2011 census) and covers an area of 79,714 km sq. Fig-4 showing percentage growth in population after each decade starting from 1901.(data obtained from Census 2011). On X-axis – Year, On Y-axis – Percentage growth. From this figure it is evident that the percentage growth was maximum in the year 1971. The Jharkhand ,mostly occupied by hard rocks (90% of the geographical area) where groundwater occurs in the irregularly distributed secondary porosities – the fractures. Groundwater occurrence and movement , the two cardinal parameters of water bearing zones , vary considerably in the state. The stage of groundwater development is less than 10% in the state & stress on 0 5 10 15 20 25 30 35 1880 1900 1920 1940 1960 1980 2000 2020 Series1
- 7. Neeta Kumari et al Int. Journal of Engineering Research and Applications www.ijera.com ISSN : 2248-9622, Vol. 4, Issue 3( Version 2), March 2014, pp.65-77 www.ijera.com 71 | P a g e groundwater regime is visible in some urban agglomerates like Ranchi. Hydrogeological set-up of the area Serial Number Geological Framework Or Formations District 1 Archean-Proterozoic schists, Phyllites, Granites , amphibolites, basic and ultra basic lavas Gumla, Ranchi, Lohardaga, Singhbhum, Hazaribagh, Deoghar, Giridih, Dumka 2 Vindhyans Garhwa and Palamu 3 Gondwanas Parts of Hazaribagh, Giridih, Dhanbad, Deoghar, Dumka, Palamu and Sahebganj, Pakur and Godda. 4 Rajmahal Trap Sahebganj, Pakur, Dumka and Godda 5 Tertiary deposits East Singhbhum 6 Quarternary Deposits Godda, Palamu, Sahebganj,and Pakur. Table-8 showing geological framework of the state / District wise distribution of different rock types.65 The state preserves the geological history ranging from Archean age (3300 million years) to recent deposits along the course of the major rivers like Subarnrekha, N & S Koel, Damodar etc. The major hydrogeological units are (i) Semi – consolidated formation ; where groundwater present in both primary and secondary porosities e.g. Gondwana sediments, with yield within 50 m3 /hr and (ii) Porous formations represented by an array of soft rocks. The Tertiary beds of singhbhum district and alluvium deposits along the northern or eastern borders of the state forms the major part of this unit having a yield potential up to 80 m3 /hr. Serial Number District Latitude Longitude Population As per 2011 census Population As per 2001 census Groundwater Quality problems as per CGWB 1 Ranchi 230 20‟ 55‟‟ 850 18‟ 45‟‟ 2914253 2785064 Sporadic fluoride contamination in Ormanjhi, Ranchi sadar and Silli blocks 2 Hazaribag 230 58‟ 02‟‟ 850 20‟ 52‟‟ 1734495 2277475 Nil 3 Lohardaga 230 28‟ 00‟‟ 840 42‟ 00‟‟ 461790 364521 NA 4 Palamu 23.40 – 24.60 N 84.00 – 84.90 E 1939869 1537465 Fluoride and Nitrate 5 Garhwa 240 08‟ 30‟‟ 830 48‟ 30‟‟ 1322784 1035464 Fluoride 6 Chatra 240 12‟ 00‟‟ 840 52‟ 30‟‟ 1042886 791434 NA 7 Bokaro 23.40 – 23.90 N 85.60 – 86.40 E 2,062,330 1777662 Fluoride, Iron, Mn, Zn, 8 Latehar 23° 44.4' north 84° 31' East 725673 560894 NA 9 Simdega 22°37' N & 22.62° N 84°31' E & 84.52°E 599813 514320 NA
- 8. Neeta Kumari et al Int. Journal of Engineering Research and Applications www.ijera.com ISSN : 2248-9622, Vol. 4, Issue 3( Version 2), March 2014, pp.65-77 www.ijera.com 72 | P a g e 10 Koderma 24.20 – 24.80 N 85.20 – 85.90 E 716259 540901 Fluoride 11 Giridih 240 10‟ 00‟‟ 860 18‟ 30‟‟ 2445474 1904430 Fluoride 12 Dhanbad 230 49‟ 30‟‟ 860 31‟ 40‟‟ 2684487 2397102 Fluoride and Nitrate at few places 13 Deoghar 240 29‟ 10‟‟ 860 42‟ 36‟‟ 1492073 1165390 Iron 14 Jamtara 23°10′ and 24°05′ north 86°30′ and 87°15′ east 790207 653081 NA 15 Dumka 240 16‟ 00‟‟ 870 15‟ 00‟‟ 1321096 1106521 NA 16 Godda 240 50‟ 12‟‟ 870 14‟ 20‟‟ 1313551 1047939 Fluoride and Nitrate 17 Pakur 240 38‟ 02‟‟ 870 52‟ 42‟‟ 900422 701664 Fluoride 18 Sahibganj 250 14‟ 00‟‟ 870 38‟ 20‟‟ 1150038 927770 Arsenic 19 Ramgarh 230 38‟ 34‟‟ 850 29‟ 10‟‟ 949159 Did not exist as district NA 20 West Singhbhum 22.00 – 23.10 N 85.10 – 86.20 E 1502338 1233945 NA 21 East Singhbhum 22.20 – 23.00 N 85.90 – 86.90 E 2293919 1982988 NA 22 Saraikela- Kharsawan 220 42‟ 15‟‟ 850 55‟ 15‟‟ 1065056 848850 NA 23 Khunti 230 04‟ 00‟‟ 850 16‟ 24‟‟ 531885 Did not exist as district NA 24 Gumla 230 02‟ 38‟‟ 840 33‟ 12‟‟ 1025656 832447 NA Table-9 showing Locality index, Population and quality problem in different Districts of Jharkhand. NA = Not available. As per CGWB survey report in 2010 In Jharkhand , following districts had Flouride in their groundwater more than permissible limit Table-10: Jharkhand districts showing fluoride > 1.5 mg/l 1 Bokaro Chas Chas 2.50 mg/l 2 Giridih Khijri Khijri 1.60 mg/l 3 Giridih Tisri Tisri 1.80 mg/l 4 Godda Boarijor Lalmatia 1.81 mg/l 5 Godda Godda Godda 1.77 mg/l 6 Palamu Chainpur Chainpur 2.18 mg/l 7 Palamu Bishrampur Bishrampur 2.46 mg/l 8 Ranchi Ormanjhi Chutupalu 2.60 mg/l 9 Ranchi Silli Silli 2.20 mg/l Table-11 showing the data collected for the fluoride level in different districts, from Drinking water and sanitation department (DW&SD) of Jharkhand for the year 2000. The major problem in terms of water collection is that 90-95 % of the rainfall is wasted as untapped runoff and so the groundwater level is depleting day by day as the demand is more and recharge is comparatively at slow rate , Therefore at the end the quality of water get worsely affected.
- 9. Neeta Kumari et al Int. Journal of Engineering Research and Applications www.ijera.com ISSN : 2248-9622, Vol. 4, Issue 3( Version 2), March 2014, pp.65-77 www.ijera.com 73 | P a g e Districts in Jharkhand Source General range of Fluoride concentration in Groundwater Prevalence of Dental fluorosis & Skeletal fluorosis Reference Palamu Geological 0.5 - 4.2mg/l A.C.Pandey et.al. (2012)66 0.1- 12mg/l 83% children with dental fluorosis & 47% adults with skeletal fluorosis R.Srikanth et.al. (2008)67 Garhwa Geological 0.018- 2.4mg/l K.avishek et.al. (2010)68 0.018-5.92mg/l Shekhar et.al (2012)69 0.52.7.62mg/l S.C.Samad et.al (2013)70 Hazaribag Geological 1.89-3.84mg/l Dental fluorosis among children has been observed Rajendra Kumar & D.N.Sadhu (2013)71 Barhait block of Sahibganj Geological 0.75-.88mg/l(children) 0.331-10.36mg/l(adult) Dental and skeletal fluorosis both. Nayak et.al. (2009)72 Jharkhand Geological Dental fluorosis among children has been observed L.H.McDonald et.al (2011)73 Garhwa Geological 3.5 mg/l Dental and Skeletal fluorosis cases in Garhwa district The Telegraph, (6th April, 2013)74 Garhwa Geological 1.83-3.15 mg/l Hindustan Times (October,15, 2011)75 Hazaribag (Keredari, Barkagaon, Barhi, Vishnugarh, Katkamsandi, Churchu.) Geological & Anthropogenic Samples with fluoride level more than prescribed limit Prabhat Khabar (1st July, 2009)76 Table-12 Fluoride in groundwater as per reported in literatures for Jharkhand only In the List of Districts Showing Localized Occurrence of Fluoride (>1.5mg/litre) in Ground Water in India39, Jharkhand has Bokaro, Giridih, Godda, Gumla, Palamu, Ranchi districts where fluoride in groundwater was found beyond permissible limit. Studies pertaining to fluoride concentration in groundwater of Jharkhand have been conducted by various researcher67,77,73,66,69,68,71,78,79,80 . In these work, water is sampled , then lab tested for fluoride. All have suggested fluoride pollution in the area is due to rock-water interaction & more exploitation of groundwater resources . Defluoridation is also suggested by eating some herbs which have medicinal value77 . R.Srikanth (2008) have also reported that in Palamu district ,where groundwater is the only source of drinking water , Ganke, Mukhiya Tola, Satyari Tola, Chukru, and Bakhari , these five villages have severe fluoride problem in their groundwater. On Socioeconomic front the inhabitants of these villages are very poor, depend entirely on agriculture and casual labor for their livelihood, rarely have proper food, suffer from various degree of malnutrition. In this study The highest F concentration found was 12 mg/L , detected in five water sources of Chukru and Andharbagh villages Sadhu et.al. have collected data on seasonal basis of three seasons (rainy, winter, summer) of the year July 2011 to June 2012 of Hazaribag district and calculated the percentage of children affected with dental fluorosis.L.H. McDonald paper have discussed the fluoride problem in Jharkhand (Palamu and Garhwa district) , defluoridation technique using fluoride removing material made by locally available material and the fluoride management on the community scale. A.C.Pandey(2012) and Shekhar, et.al.(2012) analysed a set of data of Palamu and Garhwa district to show the severity of problem. B.S. Thakur (2013)
- 10. Neeta Kumari et al Int. Journal of Engineering Research and Applications www.ijera.com ISSN : 2248-9622, Vol. 4, Issue 3( Version 2), March 2014, pp.65-77 www.ijera.com 74 | P a g e & V. Pandey (2013) found the reason of the problem is geogenic . K.avishek et.al used the data for Majhiaon block of Garhwa for mapping of fluoride quantity in different water sources likh public handpump, public well, private well, private handpump, school and health center. According to N.Priyadarshi, Bakhari village in Daltonganj where most of the people have problems like deformed limbs, cataract, or premature ageing, if people continuous consume significant amount of of Chakwad (ring worm plant) plant then they get less affected of fluoride toxicity. The presence of high calcium in this plant which binds fluorine –helps in safe excretion of fluorine, and also helping replenish body calcium depleted by fluorine. Jharkhand Government should promote these types of plants in Fluoride affected areas. As per 2011 census, Urban area of Ranchi has population of about 12, 57, 340 persons. Taking 135 litres daily consumption per person, the total water requirement of the Ranchi urban area comes out to be 1169.7 lakh litres /day (61.95 mcm/ annum). Due to excess withdrawal of groundwater, there is urgent need for recharging deeper aquifers in those areas where number of apartments are more. (Thakur,B.S.,2013). For the fluoride management in the groundwater following options can be taken with reference to the study area: Effective monitoring of drinking water sources should be made mandatory and Water with high fluoride concentration should be abandoned by regulation. Food items rich in Ca and P should be consumed because it reduces fluoride retention capacity of human body. The places where fluoride levels are in the range of 1.5-2mg/l, some nutritional additives like food that are rich in iron, Ca and vitamin C is advised to consume. The black salt or the products containing black salt and fluoridated toothpaste consumption must be avoided in these places. Defluoridation techniques suitable to the area is to be adopted Rain water harvesting and artificial recharge of aquifer results in reduction of fluoride in groundwater. Environmental awareness and full community participation can ensure safe water supply in the area. References:- [1] Meenakshi and Maheshwari R.C.,2006, Fluoride in drinking water and its removal, Journal of Hazardous Matter, 137(1), pp 456-463. [2] Sarala K. and P.R. Rao., 1993, Endemic fluorosis in the village Ralla Anantapuram in Andhra Pradesh: An Epidemiological Study, Fluoride, 26, pp 177-180. [3] Ibrahim M.et.al., 2011, Flouride contents in groundwater: a review, International Journal.of Pharmaceutical applications ISSN 0976-2639, Vol 2 (2), pp 128-134. [4] Wood J.M., 1974, Biological Cycle for toxic elements in the environment, Science, 183, pp 1049-1052. [5] Teotia S.P.S. and Teotia. M., 1984, Endemic fluorosis in India: challenging national health problem, J.Assoc.Phys.India, , 32, pp 347-352. [6] Krishna Kodalirama.& SasiKiran NOA.,2013, Fluorosis – An Update, Int.J.Research in Pharmaceutical and Biomedical sciences, Vol 4(4) . pp 1084- 1088. [7] Handa BK., 1975, Geochemistry and genesis of fluoride-containing ground waters in India. Ground Water ,13, pp 275–281. [8] Apambire W. M.et.al.,1997, Geochemistry, genesis, and health implications of fluoriferous groundwater in the upper regions of Ghana, Environmental Geology , 35(1), pp 13-24. [9] Jacks, G. et. al., 1993, Genesis of high F groundwater, Southern India, Applied geochemistry, Vol 2 , pp - 3. [10] Agrawal V.et.al.,1997, Groundwater quality: Focus on fluoride and fluorosis in Rajasthan. Curr Sci ,73, pp 743–746. [11] Saxena V. K. & Ahmed, S., 2003, Inferring the chemical parameters for the dissolution of fluoride in groundwater, Environ. Geol., 43, pp 731–736. [12] Ramesam V & Rajagopalan K ,1985, Fluoride ingestion into the natural waters of hard-rock areas, Peninsular India, J Geol Soc India, 26, pp 125–132. [13] Sivashankar V & Ramachandramoorthy T.,2011, Fluoride in groundwater and Dental fluorosis in Rameswaram Area, Tamil Nadu, Southern India., Journal of Environment Analytic Toxicol, 1(3), pp 1-6. [14] Chandra et. al., 1981, Water Quality and Dental fluorosis., Ind. J.Pub.Hlth.,25,pp 47- 51. [15] Largent E.J.,1961, The Health aspects of fluoride compounds, Ohio State University press, Columbus,O.H. [16] Saxena,S.& Saxena, U.,2013, Study of Fluoride contamination status of groundwater in Bassi Tehsil of district Jaipur, Rajasthan, India., Int.J. of
- 11. Neeta Kumari et al Int. Journal of Engineering Research and Applications www.ijera.com ISSN : 2248-9622, Vol. 4, Issue 3( Version 2), March 2014, pp.65-77 www.ijera.com 75 | P a g e Environmental Sciences, Vol 3(6), pp 2251- 2260, 2013.ISSN 0976-4402. [17] Aniruddha Ghosh et.al., 2013, Sources and toxicity of fluoride in the environment, Research on chemical intermediates ,Vol 39(7) , pp 2881 – 2915, 01/2013; DOI:10.1007/s11164-012-0841-1. [18] Subba Rao,N.,2011, High Fluoride groundwater , Environ Monit Assess, Vol 176 , pp 637-645, DOI 10.1007/s10661-010- 1609-y. [19] UNICEF ,1996, Plan of action of UNICEF assisted pilot projects of Fluorosis control in Dungarpur District, Rajsthan” [20] Dean H.T.,1934, Classification of mottled enamel diagnosis, J.Am.Dent.Assoc 21, pp 1421-1426. [21] Dean H.T.,1942, The investigation of physiological effects by the epidemiological method. In: Moulton FR, editor. Fluorine and Dental health. Pub. No. 19. Washington (DC); American Association for the advancement of science, pp 23-31. [22] Thylstrup A. and Fejerskov O., 1978, Clinical appearance of dental fluorosis in permanent teeth in relation to histologic changes, Community Dentistry and Oral Epidemiology, 6, pp 315–328 [23] Horowitz, H.S.et.al., 1984, A new method for assessing the prevalence of dental fluorosis – the Tooth Surface Index of fluorosis., Journal of the American Dental Association, 109, pp 37 [24] Pendrys D.G.,1990, The fluorosis risk index: a method for investigating risk factors, J Publ Hlth Dent, 50, pp 291-298. [25] WHO,1984, Guidelines for Drinking Water Quality. In: Health Criteria and Other Supporting Information , second ed., vol. 2. World Health Organization, Geneva [26] Ayoob S., & Gupta A. K., 2006, Fluoride in drinking water: A review on the status and stress effects . Critical Reviews in Environmental Science and Technology , 36, pp 433–487. [27] Rajiv Gandhi National Drinking Water Mission, 1986 & 1993, Prevention and control of Fluorosis in India , pp 8 - 9. [28] UNICEF ,1999, State of the art report on the extent of fluoride in drinking water and the resulting endemicity in India., Report by Fluorosis Research & Rural Development Foundation for UNICEF, New Delhi. [29] Choubisa, S.L., 2001,.Endemic fluorosis in Southern Rajasthan, India., Fluoride, 34, pp 61-70. [30] Central Ground Water Board of India, 2002, Technical Report, pp - 38. [31] Susheela, A.K. and Majumdar, K., 1992, Fluorosis control programme in India., Water Environment and Management, 18th WEDC Conference, Kathmandu, Nepal, pp. 229-233. [32] Subba Rao,N., 1992, Factors affecting optimum development of groundwaters in crystalline terrain of the eastern ghats, Vishakhapatnam area, Andhra Pradesh, India., Jour. Geol.Soc.India., 40(5), pp 462- 467. [33] Susheela AK.,2001, Fluorosis: Indian scienario: A treatise on fluorosis. Fluorosis Research and Rural Development Foundation; New Delhi, India. [34] Yadav, S., et.al., 1999, Fluorosis in India with special reference to Rajasthan. In: Proceedings of the International Conference on Water, Environment, Ecology, Socioeconomics and Health Engineering (WEESHE), Seoul National University, 18– 21st October, pp 3–10 [35] Das,K.K. et.al.,2012, Occurrence of fluoride in groundwater of Patripal Panchayat in Balasore District, Odisha, India., Journal of Environment, 01(2), pp 33-39. [36] Susheela, A.K.,1987, Fluorosis in India, the magnitude and severity of the problem, Sci. Dev. Env., pp. 147-157. [37] Susheela, A.K.,1999, Fluorosis management programme in India, Curr. Sci., 77, pp. 1250-1256. [38] Susheela, A.K. , 2007, Fluorosis management programme in India. Curr. Sci., 77, pp. 1250-1256. [39] CGWB, 2010, Groundwater quality in shallow aquifers of India, pp 9. [40] Hussain J.et.al.,2013, Fluoride contamination in groundwater of Central Rajasthan, India and its toxicity in rural habitants”. Toxicological & Environmental Chemistry, Vol 95(6), pp – 1048 – 1055. [41] Garg K. & Singh B.,2013, Fluoride signatures in groundwater and dental fluorosis in permanent teeth of school children in rural areas of Haryana state, India., Int. J. Occup Environ Med ,Vol 4(2), Pp 107-108 [42] Reddy, A.G.S.et.al., 2010, Hydrogeochemical characterization of fluoride rich groundwater of Wailpalli watershed , Nalgonda District, Andhra Pradesh, India, Environ. Monit. Assess. Vol 171, pp 561-577. DOI 10.1007/s10661-009- 1300-3.
- 12. Neeta Kumari et al Int. Journal of Engineering Research and Applications www.ijera.com ISSN : 2248-9622, Vol. 4, Issue 3( Version 2), March 2014, pp.65-77 www.ijera.com 76 | P a g e [43] Brindha,K.,et.al., 2010, Fluoride contamination in groundwater in parts of Nalgonda District, Andhra Pradesh India, Environ Monit assess, DOI 10.1007/s10661- 010-1348-0. [44] Vikas,C.et.al.,2009, Hydrochemical status of groundwater in District Ajmer ( NW India) with reference to fluoride distribution, Journal geological society of India, Vol. 73 pp 773-784. [45] Pol,P.D.et.al.,2012, Fluoride contamination status of groundwater in Mudhol taluk, Karnataka, India: Correlation of fluoride with other physic-chemical parameters, Rasayan J.Chem., 5(2), pp 186-193. [46] Saksena D.N. & Narwaria Y.S.,2012, Incidence of fluoride in groundwater and its potential health effects in ten villages of Karera block in Shivpuri District, Madhya Pradesh, India, International Journal of Environmental Sciences, 3(3) , pp 1141- 1149. [47] Rawat , K.S.et.al.,2012, Identification of geospatial variability of fluoride contamination in groundwater of Mathura District, Uttar Pradesh. Journal of Applied and Natural Science. , 4(1) pp 117-122. [48] V.,Sunitha.et.al.,2012, Variation of fluoride and correlation with alkalinity in groundwater of shallow and deep aquifers – A case study in and around Anantapur district, Andhra Pradesh., Int.J. of applied sciences and Engineering research, 1(4). pp 569-575. [49] Arveti nagaraju.,2011, Fluoride incidence in groundwater: a case study from Talupula, Andhra Pradesh, India., Environmental monitoring assessment, 172. pp 427-443. [50] Mohamed Hanipha M. & Zahir Hussain A.,2013, Study of groundwater quality at Dindigul Town, Tamilnadu, India., Int. Res.J.Environment Sciences.,2(1), pp 68-73. [51] Radhika,veerati & Praveen G.V., 2012, Determination of fluoride status in groundwater of Kommala area of District Warangal, Andhra Pradesh, India. : A case study, Advances in applied science research, 3 (4), pp 2523-2528. [52] Veeraputhiran.V, & Alagumuthu.G., 2010, A report on fluoride distribution in drinking water, International Journal of Environmental Sciences, 1(4) pp 558-566. [53] Dutta,J.et.al., 2010, Monitoring of Fluoride concentration in groundwater of small tea gardens in Sonitpur District, Assam,India: correlation with physic-chemical parameters, Internatonal J. of chemtech Research, 2(2), pp 1199-1208. [54] Subba Rao, N.,2010, Groundwater quality : focus on fluoride concentration in rural parts of Guntur district, Andhra Pradesh, India., Hydrogeological Sciences Journal, Vol 48(5), 835-847. [55] Tailor,G.S. & Singh Chandel, C.P., 2010, To assess the quality of groundwater in Malpura Tehsil (Tonk, Rajasthan, India) with emphasis to fluoride concentration, Nature and Science , 8 (11), pp 20-26. [56] Karthikeyan K.et.al. , 2010, Prevalence of certain inorganic constituents in groundwater samples of Erode district Tamilnadu, India, with special emphasis on fluoride , fluorosis and its remedial measures., Environmental Monitoring Assessment, 160(1-4), pp 141-155. [57] Reddy,B.M.et.al.,2013, Fluoride and Nitrate geochemistry of Groundwater from Kadiri, Mudigubba, and Nallamada Mandals of Anantapur District, Andhra Pradesh, India. Journal of Agricultural engineering and biotechnology, 1(2) pp 37-42. [58] Choubisa. S.L., 2012, Fluoride in drinking water and its toxicosis in tribals of Rajasthan, Proceedings of the National academy of sciences, India section B:Biological sciences., 82 (2) pp 325-330 [59] Hussain, I. et.al., 2012, Fluoride contamination in drinking water in rural habitations of Central Rajasthan, India. , Environmental monitoring and assessment, 184(8) pp 5151-8 [60] Alagumuthu, G. & Rajan, M.. ,2008, Monitoring of fluoride concentration in groundwater of Kadayam block of Tirunelveli District, India : Correlation with physic chemical parameters., Rasayan.J.Chem. ,1(4). ,pp 757-765. [61] Sivasankar V. & Ramachandramoorthy T, 2011, Fluoride in groundwater and Dental Fluorosis in Rameswaram area, Tamilnadu, Southern India., J. Environmental & analytical toxicology, 1(3) .Doi : 10.4172/2161-0525.1000110. [62] Srinivasamoorthy,K.et.al., Assessment of groundwater quality with special emphasis on fluoride contamination in crystalline bed rock aquifer of Mettur region, Tamilnadu,India., Arab J. Geosciences, DOI 10.1007/s12517-010-0162-x [63] Singh,A.et.al., 2013, Fluoride distribution in groundwater and prevalence of Dental fluorosis among school children in villages of Jind District, Haryana (India).,
- 13. Neeta Kumari et al Int. Journal of Engineering Research and Applications www.ijera.com ISSN : 2248-9622, Vol. 4, Issue 3( Version 2), March 2014, pp.65-77 www.ijera.com 77 | P a g e International Journal of current research, Vol 5(4), pp-998-1002. [64] Meena,K.S.et.al., 2011, Fluoride contaminated ground water and its implications on human health in Deoli Tehsil (Tonk District) in Rajasthan., Journal of Chemical, Biological, and Physical Sciences, Vol 1(2),pp 275-282. [65] CGWB ,2007 , A report on Hydrogeological framework and groundwater development prospects of Jharkhand state. [66] Pandey, A.C.et.al., 2012, Evaluation of Fluoride in Groundwater sources in Palamu district of Jharkhand . Journal of Applied Sciences 12(9). 882-887. [67] Srikanth, R..,2008, Endemic fluorosis in five villages of the Palamau district, Jharkhand, India. Fluoride, 41(3), pp 206–211 [68] Avishek, K.et.al., 2010, Water quality assessment of Majhiaon block of Garhwa District in Jharkhand with special focus on fluoride analysis, Environmental Monitoring assessment ,167: 617-623. [69] Shekhar,S.et.al.,2012, Evaluation of fluoride contamination in groundwater sources in hard rock terrain in Garhwa district, Jharkhand,India.,.International Journal of Environmental Sciences, Vol 3(3), pp- 1022-1030. DOI:10.6088/ijes.2012 0301330 10. [70] Samad, S. C. et. al.,2013, Fluoride geochemistry and assessment of the exposure dose of fluoride from drinking water in Garhwa district of Jharkhand, India., Advances in applied science research (Pelagia research library), Vol 4(5), pp 325- 329. [71] Kumar & Sadhu.,2013, Assessment of Drinking water quality in tribal dominated villages of Barkagaon, Hazaribag, Jharkhand, India”. European Scintific Journal , Vol 9(35), pp 331-338. [72] Nayak,B.et.al.,2009, Health effects of groundwater fluoride contamination., Clinical toxicology (Phila.), 47(4), pp 292- 295. [73] MacDonald et.al.,2011, An integrated approach to address endemic fluorosis in Jharkhand, India . Journal of water resource and protection, 3 ,pp 457-472 [74] The Telegraph ,2013, Fluoride in the groundwater of Garhwa district specially in three villages Pratappur, Darmi and Parsi. , dated 6th April, 2013. [75] Hindustan Times , dated 15th October,2011, Central team confirms high fluoride in Garhwa water, page – 1 [76] Prabhat Khabar ( hindi), dated 1st July, 2009. , Jile ke bhumigat jal main fluoride ki matra badhi (increase of fluoride in the groundwater of district) was in reference of Hazaribag district. [77] Priyadarshi,N.,2012, Fluoride toxicity in Jharkhand state of India http://fluoridealert.org/news, fluoride action network.. [78] Thakur,B.S.,2013, Sustainable management of deeper aquifers in hard rock areas of Ranchi urban area, Proceeding of National Conference on Earth Sciences in India : Challenges and Emerging trends (ESICET- 2013) 7-9 November, 2013. [79] Pandey,V.,2013, Impact of fluoride rich water on human health – A case study of Palamau district, Jharkhand, India., Proceeding of National Conference on Earth Sciences in India : Challenges and Emerging trends (ESICET-2013) 7-9 November, 2013. [80] Thakur,B.S.,2013, Urgent need for Sustainable management of Ground water in fractured Aquifers in hard rock terrains of Ranchi urban area,Jharkhand., Proceeding of National Conference on Earth Sciences in India : Challenges and Emerging trends (ESICET-2013) 7-9 November, 2013. www.mapsofindia.com Census-2001 & Census – 2011.