Av24317320

This document discusses using data mining techniques to visualize association rules in customer relationship management (CRM) systems. It begins with an introduction to data mining and association rule mining. It then discusses challenges with existing visualization methods for large sets of association rules. The paper proposes a grouped matrix-based visualization approach that organizes rules into nested hierarchical groups to aid exploration of large rule sets. This approach aggregates rows and columns of a rule matrix to represent groups. It also uses coloring and positioning to guide the user to interesting groups and rules. The paper concludes the proposed approach addresses limitations of existing methods for visualizing large association rule sets.

Recomendados
Mais conteúdo relacionado
Mais procurados
Mais procurados (18)
Destaque
Semelhante a Av24317320
Semelhante a Av24317320 (20)
Av24317320
- 1. S. Thiripura Sundari, A. Padmapriya / International Journal of Engineering Research and Applications (IJERA) ISSN: 2248-9622 www.ijera.com Vol. 2, Issue 4, July-August 2012, pp.317-320 Data Mining Application-Usage of Visualizing Association Rules in CRM System S. Thiripura Sundari*, Dr.A. Padmapriya** *(Department of Computer Science and Engg, AlagappaUniversity, Karaikudi-630 003) ** (Department of Computer Science and Engg, AlagappaUniversity, Karaikudi-630 003) ABSTRACT Data Mining, simply called DM, is a kind mining is the key to the successful implementation of of method for data analyses at deep level. Data CRM. And to use data mining techniques to customer Mining can be described as this: It is, in light of the analysis to help enterprise to better implement CRM set target of an enterprise, an effective and and develop customized marketing strategies. This advanced method in probing and analyzing huge kind of customer relationship management, customer- numbers of enterprise data and revealing the centric business strategy, is based on information unknown regularities or verifying the known technology. It restructures the work processes in order disciplines and model them better. Association rule to give businesses better customer communication mining is one of the most popular data mining skills, to maximize customer profitability. methods. However, mining association rules often results in a very large number of found rules, The main objective of its management is to leaving the analyst with the task to go through all increase efficiency, expand markets and retain the rules and discover interesting ones. Sifting customers. Data mining is data processing in a high- manually through large sets of rules is time level process, which from the data sets to identify in consuming and strenuous. Visualization has a long order to model to represent knowledge. The so-called history of making large amounts of data better high-level process is a multi-step processing, multi- accessible using techniques like selecting and step interaction between the repeated adjustments, to zooming. In this paper we introduces the form a spiral process. Visualizing Association Rules using CRM based data mining and the concept of Clustering The knowledge of mining expresses as Analysis, and then started from Customer Concepts, Rules, Regularities and other forms. relationship management’s core values-Customer Clustering Analysis is a widely used data mining Value, deeply expound the meaning of customer analytical tools. After clustering, the same types of value and it is in a key position in the customer data together as much as possible, while the separation relationship management. of different types of data as possible. The enterprise customer classification, through the customer’s buying Keywords - Customer Relationship Management, behavior, consumption habits, and the background to Data mining identify the major clients, customers, and tap potential customers. There are many clustering algorithms, this I. INTRODUCTION means using K-means algorithm. K-means algorithm Many organizations are generating a large is a specific means: for a given number of classes K, amount of transaction data on a daily basis. the n objects assigned to a class K to go, making Enterprises must rely on customers to achieve within-class similarity between objects the most, while profitable. In the fierce market competition, in order to the similarity between the smallest class. maintain superiority and long-term and stable development, we must attach importance to customer II. BACKGROUND OF THE STUDY relationship management. And only continued to gain Association rule mining is a well-known data and maintain valuable customers and achieve customer mining task for discovering association rules between demand for personalized, in-depth excavation in order items in a dataset. It has been successfully applied to to achieve the corporation-customer win-win. This different domains especially for business applications. paper describes in depth the importance of customer However, the mined rules rely heavily on human value for the company, noting that customer value interpretation in order to infer their semantic meanings. In this paper, we mine a new kind of 317 | P a g e
- 2. S. Thiripura Sundari, A. Padmapriya / International Journal of Engineering Research and Applications (IJERA) ISSN: 2248-9622 www.ijera.com Vol. 2, Issue 4, July-August 2012, pp.317-320 association rules, called conceptual association rules, antecedents and consequents in rules. Graph-based which imply the relationships between concepts. visualization offers a very clear representation of rules Conceptual association rules can convey more but they tend to easily become cluttered and thus are semantic meanings than those classical association only viable for very small sets of rules. rules. Parallel coordinates plots are designed to In Data Mining, the usefulness of association visualize multidimensional data where each dimension rules is strongly limited by the huge amount of is displayed separately on the x-axis and the y-axis is delivered rules. In this paper we propose a new shared. Each data point is represented by a line approach to prune and filter discovered rules. Using connecting the values for each dimension. Domain Ontologies, we strengthen the integration of user knowledge in the post-processing task. Double decker plots use only a single Furthermore, an interactive and iterative framework is horizontal split. Introduced double decker plots to designed to assist the user along the analyzing task. visualize a single association rule. On the one hand, we represent user domain knowledge using a Domain Ontology over database. 1.2. Drawbacks in Existing Method Two key plot - There is not enough space in K-means clustering is a popular clustering the plot the display the labels of the items in the rules. algorithm based on the partition of data. However, this still makes exploring a large set of rules time- there are some shortcomings of it, such as its requiring consuming. a user to give out the number of clusters at first, and its sensitiveness to initial conditions, and its easily getting This visualization is powerful for analyzing a to the trap of a local solution et cetera. The global K- single rule; it cannot be used for large sets of rules. means algorithm proposed by Likas et al is an incremental approach to clustering that dynamically III. PROPOSED CRM SYSTEM USING adds one cluster center at a time through a VISUALIZING ASSOCIATION RULES deterministic global search procedure consisting of N Matrix-based visualization techniques (with N being the size of the data set) runs of the K- organize the antecedent and consequent item sets on means algorithm from suitable initial positions. the x and y-axes, respectively. Matrix-based visualization is limited in the number of rules it can Data mining technology has emerged as a visualize effectively since large sets of rules typically means for identifying patterns and trends from large also have large sets of unique antecedents/consequents quantities of data. Mining encompasses various Grouped Matrix-based Visualization- Groups algorithms such as clustering, classification, and of rules are presented by aggregating rows/columns of association rule mining. In this paper we take the matrix. The groups are nested and organized advantage of the genetic algorithm (GA) designed hierarchically allowing the user to explore them specifically for discovering association rules. We interactively by zooming into groups. This paper propose a novel spatial mining algorithm, called attempts to use data mining - clustering method, ARMNGA(Association Rules Mining in Novel combined with customer life cycle assessment system Genetic Algorithm), the ARMNGA algorithm avoids for the value of customer segmentation. Through data generating impossible candidates, and therefore is mining technology can effectively support the use of more efficient in terms of the execution time. appropriate evaluation methods to make up a simple application of conventional evaluation methods lack of 1.1. Existing Methodology customer value. A straight-forward visualization of association rules is to use a scatter plot with two 1.1. The Advantages are listed below interest measures (typically support and confidence) Matrix-based visualization is very limited on the axes. This is introduced a special version of a when facing large rule sets. scatter plot called Two-key plot. Here support and confidence are used for the x and y-axes and the color Since minimum support used in association of the points is used to indicate “order,” i.e., the rule mining leads in addition to relatively short rules number of items contained in the rule. resulting in extremely sparse data. Graph-based techniques visualize association IV. PERFORMANCE ANALYSIS rules using vertices and directed edges where vertices In Data Mining, the subject to be studied is typically represent items or itemsets and edges connect the core of the whole process. It drives the whole 318 | P a g e
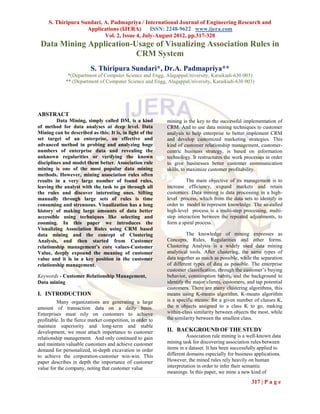
- 3. S. Thiripura Sundari, A. Padmapriya / International Journal of Engineering Research and Applications (IJERA) ISSN: 2248-9622 www.ijera.com Vol. 2, Issue 4, July-August 2012, pp.317-320 process and is the basis of examining the final results policy. The pie chart analysis all the input values and and directing the analyst to complete mining. calculates the position of the customer using Naive Bayesian Classification after shows the result. So we easily get which one will get insurance pother than deep analysis. V. CONCLUSION The method addresses the problem that sets of mined association rules are typically very large by grouping antecedents and allowing the user to interactively explore a hierarchy of nested groups. Coloring and the position of elements in the plot guide the user automatically to the most interesting groups/rules. Finally, the ability to interpret the grouped matrix-based visualization can be easily acquired since it is based on the easy to understand concepts of matrix-based visualization of association rules and grouping. Customer value analysis is the enterprise implementation of customer relationship management core. For companies to develop customized marketing strategies, it is necessary to segment Fig. 1 Graph bar chart customer groups. This paper analyzes the shortcoming of traditional method of evaluation of customer value. 1.1. Clustering or Grouping of Data Through the introduction of data mining-clustering The data collected using any one of the algorithm to improve the traditional methods of prediction or description method and that data are evaluation, to enable enterprises to more accurate stored as a record. The collected records called as a positioning for target groups with limited enterprise training set that data are called as training set data. resources to the implementation of targeted Each record contains a set of attributes; one of the personalized marketing policy for the enterprise-to attributes is class. Find a model for class attribute as a help customers achieve a win-win. function of the values of other attributes. Unlike methods based on a single clustering Attribute values are numbers or symbols of the data, the approach computes the probability that assigned to an attribute. Same attribute can be mapped two genes belong to the same cluster while taking into to different attribute values. Different attributes can be account the main sources of model uncertainty, mapped to the same set of values. including the number of clusters and the location of clusters. 1.2. Data classification The method used here to obtain a predictive .References model, and to answer the questions above, is naive [1] Abd. Manan Ahmad, AG. Noorajis Ag. Bayesian learning. Boosting was tried also, and some Nordin, Emrul Hamide Md. Saaim, Fairol derived attributes were added to the training set. After Samaon and Mohd Danial Ibrahim, “An two important derived attributes were added, boosting architecture design of the intelligent agent did not give any significant increase in accuracy on a for speech recognition and translation,” in validation set taken from the training set, and neither IEEE, 2004. did adding more derived attributes. Therefore, the [2] Bala, J., Weng, Y., Wiliams, A.I., Gogia, results here do not use boosting, and only use two B. K. and H. K. Lesser, “Applications of derived attributes. distributed mining techniques for 1.3. Analysis with graph bar chart knowledge discovery in dispersed sensory The results are shown using Graph chart. data”, in 7th Joint Conference on Here we have used 2 numerical parameters that Information Sciences- JCIS,2003. parameters are 0 and 1.The result shows 1 means the [3] Bose, R. and V. Sugumaran, “Application customer ready to get insurance policy. The result of intelligent agent technology for shows 0 means the customer not ready to get insurance managerial data analysis and mining,” in The DATABASE for Advance in 319 | P a g e
- 4. S. Thiripura Sundari, A. Padmapriya / International Journal of Engineering Research and Applications (IJERA) ISSN: 2248-9622 www.ijera.com Vol. 2, Issue 4, July-August 2012, pp.317-320 Information Systems, 3 (1): pp. 77-94, [8] Ping Luo, Qing He, Rui Huang, Fen Lin 1999. and Zhongzhi Shi, “Execution engine of [4] Freitas, A. Data mining and knowledge meta-learning system for kdd in multi- discovery with evolutionary algorithms, agent environment,” in AIS-ADM 2005: Natural Computing Series, Springer: pp. 149-160, 2005M. Berlin, 2002. [9] Witten, I. H. and E. Frank. Data mining: [5] Han, J. and Kamber, M. Data Mining : practical machine learning tools and Concept and Techniques, Morgan techniques with java implementation. Kaufmann Publisher: San Francisco, USA, Morgan Kaufmann Publishers, San 2001. Francisco,USA,2000.http:/www.cs.waikato [6] Kehagias, D., Chatzidimitriou, K.C., .ac.nz/ml/weka/. Symeonidis, A.L. and P.A. Mitkas, [10] Fayyad, U., Piatetsky-Shapiro, G. and P. “Information agents cooperating with Smyth. The KDD process for extracting heterogeneous data sources for customer- useful knowledge from volumes of data. order management,” in ACM Symposium Communications of the ACM, 39(11): 27- on Applied Computing: pp. 52-57, 2004. 34, 1996. [7] Lourenço, A., Gonçalves, J. and O. Belo, “Agent-based knowledge extraction services inside enterprise data warehousing systems environments,” IEEE: pp. 887- 891, 2001. S.Thiripura Sundari, a very enthusiastic and energetic Dr.A.Padmapriya is the Assistant Professor in the scholar in M.Phil degree in Computer Science. Her Department of Computer Science and Engineering, research interest is in the field of data mining. It will Alagappa University, Karaikudi. She has been a member further be enhanced in future. She is equipping herself to of IACSIT. She has presented a number of papers in that by attending National Conferences and by both National and International Conferences. publishing papers in International Journals. 320 | P a g e