Briefing Book: Labor Market Trend in Metro Boston
•
1 gostou•347 visualizações

In this briefing we will explore the wage differences in the occupations and industries typically employing members of Boston’s native and foreign-born populations. In addition, we will examine labor market projections for our region for the year 2018, with an eye towards understanding the education, training, and skill requirements for jobs expected to grow in the near future.

Recomendados
Recomendados
Mais conteúdo relacionado
Mais procurados
Mais procurados (20)
Semelhante a Briefing Book: Labor Market Trend in Metro Boston
Semelhante a Briefing Book: Labor Market Trend in Metro Boston (20)
Mais de Instituto Diáspora Brasil (IDB)
Mais de Instituto Diáspora Brasil (IDB) (20)
Último
Último (20)
Briefing Book: Labor Market Trend in Metro Boston
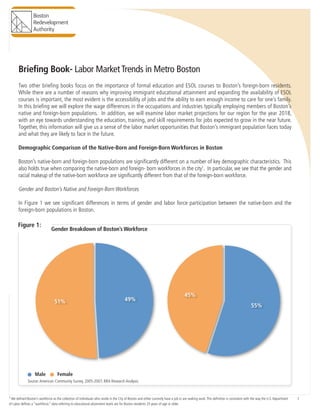
- 1. Source: American Community Survey, 2005-2007; BRA Research Analysis. 11 We defined Boston’s workforce as the collection of individuals who reside in the City of Boston and either currently have a job or are seeking work.This definition is consistent with the way the U.S. Department of Labor defines a “workforce.” data referring to educational attainment levels are for Boston residents 25 years of age or older. Two other briefing books focus on the importance of formal education and ESOL courses to Boston’s foreign-born residents. While there are a number of reasons why improving immigrant educational attainment and expanding the availability of ESOL courses is important, the most evident is the accessibility of jobs and the ability to earn enough income to care for one’s family. In this briefing we will explore the wage differences in the occupations and industries typically employing members of Boston’s native and foreign-born populations. In addition, we will examine labor market projections for our region for the year 2018, with an eye towards understanding the education, training, and skill requirements for jobs expected to grow in the near future. Together, this information will give us a sense of the labor market opportunities that Boston’s immigrant population faces today and what they are likely to face in the future. Demographic Comparison of the Native-Born and Foreign-Born Workforces in Boston Boston’s native-born and foreign-born populations are significantly different on a number of key demographic characteristics. This also holds true when comparing the native-born and foreign- born workforces in the city1 . In particular, we see that the gender and racial makeup of the native-born workforce are significantly different from that of the foreign-born workforce. Gender and Boston’s Native and Foreign-Born Workforces In Figure 1 we see significant differences in terms of gender and labor force participation between the native-born and the foreign-born populations in Boston. Briefing Book- Labor MarketTrends in Metro Boston Figure 1: Gender Breakdown of Boston’s Workforce 45% 55% Male Female Source:American Community Survey, 2005-2007; BRA Research Analysis.
- 2. 2 Briefing Book: Labor Market Trends in Metro Boston 2 This is the category name on the Census. In reality, most “African Americans” are not foreign-born.As a result, the majority of these individuals are “Black”. Overall, men makeup slightly less than half of the native-born workforce. Comparatively, men make up 56% of the foreign-born workforce. Given that marriage rates in the foreign-born population are much higher than in the native-born population (41% to 24% respectively), the gender makeup of Boston’s foreign-born workforce may speak to traditionalized notion of gender roles inside nuclear families within Boston’s foreign-born communities. Race and Boston’s Native and Foreign-Born Workforces As one would expect, the racial composition of the native-born and foreign-born workforces in Boston are quite different. As, Figure 2 shows, the foreign-born workforce is much more racially diverse than the native- born workforce. The vast majority of the native-born workforce is White (70%), while the foreign-born workforce is made up of almost equal portions of Hispanics/ Latinos (30%), Black/African Americans2 (23%), and Whites (22%).Asian/Pacific Islanders also make up a significant portion of the foreign-born workforce (17%). Differences in Labor Force Outcomes and Participation in Boston’s Native-Born and Foreign-Born Workforces In this section, we focus on how the labor force outcomes and participation patterns differ between Boston’s native-born and foreign-born workforces. Of particular interest will be how salary, occupational structure, and industrial makeup vary between the two groups. Figure 2: Source: American Community Survey, 2005-2007; BRA Research Analysis 0% 20% 40% 60% 80% White Black or African American Asian or Pacific Islander Hispanic or Latino Some other race Two or more races ?5;+@/F47.2 *7./+,2F47.2 Source:American Community Survey 2005-2007; BRA Research Division Analysis. Racial Breakdown of Boston’s Workforce
- 3. 3 Briefing Book: Labor Market Trends in Metro Boston 3 This set of occupational groupings was developed by the Boston Redevelopment Authority Research Division, collapsing the 23 major occupational grouping established by the Bureau of Labor Statistics into eight categories. Occupational Structure of Boston’s Native-Born and Foreign-Born Workforces One possible explanation for why the native-born and the foreign-born workforces earn different salaries, even at the same level of education, are the types of jobs each population holds. Obviously, some occupations make more money than others, even if they require similar levels of education. As a result, it is important to consider the types of occupations typically held by Boston’s native- born and foreign-born workforces. As Figure 3 shows, Boston’s native-born workforce is over-represented in managerial and professional occupations and technical, sales, and administrative occupations. Conversely, the foreign-born workforce tends to be employed in service occupations, constructions, extraction, and transportation occupations, and production occupations. In short, we see that Boston’s native-born workforce is much more likely to be employed in white-collar jobs than the foreign- born workforce. On the other hand, the foreign- born workforce is much more likely to be working blue-collar and service related jobs than the native-born workforce. While working in different types of occupations can help to explain the relative income inequality between the native-born and foreign-born workforces in Boston, closer inspection of the data shows that members of the foreign-born workforce tend to be paid less than members of the native-born workforce, even within the same occupational classifications. As Figure 4 demonstrates, foreign-born workers earn less than native-born workers within each occupational classification. Figure 3: Boston’s Labor Force by Occupational Category Source:American Community Survey; 2005-2007; BRA Research Analysis3 Services Occupations 37531 &#D 30034 %CD Constructions, Extraction & Transportation Occupations 19357 $D 13898 &'D Production Occupations 4598 %D 6998 GD Community and Social Services Occupations 7221 'D 1896 %D Arts, Design, Entertainment, Sports and Media Occupations 8544 'D 1004 &D Other 224 !D 21 !D Source: American Community Survey, 2005-2007; BRA Research Analysis- source has footnote- see pdf 0% 10% 20% 30% 40% Managerial and Professional Occupations Technical, Sales and Administrations Support Services Occupations Constructions, Extraction & Transportation Occupations Production Occupations Community and Social Services Occupations Arts, Design, Entertainment, Sports and Media Occupations Native-Born Foreign-Born Services Occupations 37531 &#D 30034 %CD Constructions, Extraction & Transportation Occupations 19357 $D 13898 &'D Production Occupations 4598 %D 6998 GD Community and Social Services Occupations 7221 'D 1896 %D Arts, Design, Entertainment, Sports and Media Occupations 8544 'D 1004 &D Other 224 !D 21 !D Source: American Community Survey, 2005-2007; BRA Research Analysis- source has footnote- see pdf 0% 10% 20% 30% 40% Managerial and Professional Occupations Technical, Sales and Administrations Support Services Occupations Constructions, Extraction & Transportation Occupations Production Occupations Community and Social Services Occupations Arts, Design, Entertainment, Sports and Media Occupations Native-Born Foreign-Born Managerial and Professional Occupations Technical, Sales and Administrations Support Services Occupations Constructions, Extraction & Transportation Occupations Production Occupations Community and Social Services Occupations Arts, Design, Entertainment, Sports and Media Occupations
- 4. Figure 1: 4 Briefing Book: Labor Market Trends in Metro Boston The most notable income differences within occupational groups exist in the technical sales and administrative support and the production occupations. Within both occupational classifications, foreign-born workers earn less than 74% of what native-born workers earn (72.8% and 73.5%, respectively). Characteristics of Metro Boston’s Labor Market Researchers and analysts often point to the reduced role of the manufacturing sector, the increased importance of the service and knowledge sectors, advancements in technology, and the spread of globalization as evidence that the ways in which we “do work” have fundamentally changed. With this is a change in the educational and skill requirements necessary for holding jobs in the economy. When discussing the human capital characteristics of a community, it is important to consider the educational and skill requirements for occupations and the role these factors play in the financial returns to education. Figure 4: Average Income by Occupational Category Arts, Design, Entertainment, Sports and Media Occupations $ 32,552 $ 29,462 U0 !"C& Source: American Community Survey, 2005-2007; BRA Research Analysis $0 $15,000 $30,000 $45,000 $60,000 Managerial and Professional Occupations Technical, Sales and Administrations Support Services Occupations Constructions, Extraction & Transportation Occupations Production Occupations Community and Social Services Occupations Arts, Design, Entertainment, Sports and Media Occupations H@/.5,/0J2>7E/0QR0S>>-L5;+725B0T5;/,7.R Native-Born Foreign-Born Source:American Community Survey, 2005-2007; BRA Research Analysis. Managerial and Professional Occupations Technical, Sales and Administrations Support Services Occupations Constructions, Extraction & Transportation Occupations Production Occupations Community and Social Services Occupations Arts, Design, Entertainment, Sports and Media Occupations
- 5. 5 Briefing Book: Labor Market Trends in Metro Boston 4 The current ES-202 data did not have employment for local and federal government.We estimate this employment by comparing Bureau of Economic Analysis (BEA) data for 2007 in the region and scale the employment in those two sectors according to the employment trends seen in the current 2008 ES-202 data. Characteristics of Metro Boston’s Current Labor Market Greater Boston’s labor market is made up of a diverse set of industries; from financial services to manufacturing. Overall, though, a few key industries stand out as being particularly important players in our local economy. As demonstrated in Figure 5, the Health Care and Social Assistance Industry, the Professional, Scientific, and Technical Services Industry, and Educational Services are the largest types of industries in the region. On average, the yearly salary for jobs in Metro Boston is just under $51,500. As one would expect, the average yearly salary varies from industry to industry. BPS Students and Language Source: English Learners in Boston Public Schools: Enrollment, Engagement and Academic Outcomes,AY 2003- 2006, The Mauricio Gaston Institute for Latino Community Development and Public Policy; Boston Public Schools. Figure 5: Source: Massachusetts Department of Labor and Workforce Development, ES-202 Data4 . Employment by Major Industrial Grouping: Metro Boston-2008 )$F)C P.5Q:L7.;5;+7205230=5./O7-:+2, #'X&(& #& J297.E5;+72 #CX#!' #% *+252>/05230J2:-.52>/ &%CXC)% #' Z/5B0V:;5;/05230Z/2;5B05230M/5:+2, %(X#GC #) I.79/::+725BX0N>+/2;+9+>X05230P/>O2+>5B0N/.@+>/: &$(X')) ## A525,/E/2;0790T7EL52+/:05230V2;/.L.+:/: ')X$&! #( H3E+2+:;.5;+@/05230N-LL7.;05230=5:;/0A525,/E/2;05230Z/E/3+5;+720N/.@+>/: C$X'C% (& V3->5;+725B0N/.@+>/: &()X)'$ (% K/5B;O0T5./05230N7>+5B0H::+:;52>/ %#)X'!& G& H.;:X0V2;/.;5+2/E/2;X05230Z/>./5;+72 %GXC#) G% H>>7EE735;+7205230*7730N/.@+>/: &%GX%!$ $& S;O/.0N/.@+>/:0[/>/L;0I-QB+>0H3E+2+:;.5;+72] #%X(() C& */3/.5B017@/.2E/2; $X))& C% N;5;/017@/.2E/2;X0/>"0V3->5;+7205230K7:L+;5B: %%X&!# C' M7>5B017@/.2E/2;:X0//"0V3->5;+7205230K7:L+;5B: ''XC'G &X(($X&$' Source: Massachusetts Department of Labor and Workforce Development, ES-202 Data.Source: Massachusetts Department of Labor and Workforce Development, ES-202 Data. 0;O+:0:7-.>/0>72;5+2:050977;27;/F0://0L39 Employment by Major Industrial Grouping-Metro Boston-2008Employment by Major Industrial Grouping-Metro Boston-2008Employment by Major Industrial Grouping-Metro Boston-2008Employment by Major Industrial Grouping-Metro Boston-2008 ?HJTN J23-:;.R %!!$0 VELB7RE/2; D0790P7;5B0VELB7RE/2; 11 Agriculture, Forestry, Fishing and Hunting 2,257 0.1% 21 Mining 510 0.0% 22 Utilities 66,113 4.0% 23 Construction 102,770 6.2% 31-33 Manufacturing 5,999 0.4% 42 Wholesale Trade 63,094 3.8% 44-45 Retail Trade 147,661 8.9% 48-49 Transportation and Warehousing 53,161 3.2% 51 Information 59,503 3.6% 52 Finance and Insurance 129,942 7.8% 53 Real Estate and Rental and Leasing 26,579 1.6% 54 Professional, Scientific, and Technical Services 186,344 11.2% 55 Management of Companies and Enterprises 34,810 2.1% 56 Administrative and Support and Waste Management and Remediation Services 98,392 5.9% 61 Educational Services 164,438 9.9% 62 Health Care and Social Assistance 254,301 15.2% 71 Arts, Entertainment, and Recreation 27,954 1.7% 72 Accommodation and Food Services 127,208 7.6% 81 Other Services (except Public Administration) 52,664 3.2% 91 Federal Government 8,441 0.5% 92 State Government, exc. Education and Hospitals 22,105 1.3% 93 Local Governments, exe. Education and Hospitals 33,937 2.0% 1,668,183 100.0%
- 6. 6 Briefing Book: Labor Market Trends in Metro Boston As Figure 6 demonstrates, there is a great deal of variability in the average wage by industry in our region. Overall, the highest paying industrial sectors in Metro Boston are Professional, Scientific, and Technical Services, the Finance and Insurance, and the Information Industry ($77,622, $70,004, and $67,996 respectively). The lowest paying industrial sectors in our region include Accommodation and Food Services and Retail Trade ($25,181 and $31,520 respectively). Other important dimensions to consider when examining the characteristics of the labor market are education and skill requirements. Within all of these different industrial classifications are hundreds of occupational titles, each requiring differing levels of education and skill. As mentioned previously, a great deal of attention has been paid in recent years to the changing nature of the economy, with the argument that work requires more education and skill than at other times in the past. While this may be true, a close inspection of Greater Boston’s labor market shows there are jobs available for people at a variety of levels of educational attainment. Employment and Average Salary by Sector: Metro Boston 2008 Source: Labor Market Assessment Tool; BRA Research Division Analysis. Figure 6: Agriculture,Forestry, FishingandHunting Mining Utilities Construction Manufacturing WholesaleTrade RetailTrade Transportationand Warehousing Information FinanceandInsurance RealEstateandRentaland Leasing Professional,Scientific,and TechnicalServices ManagementofCompanies andEnterprises EducationalServices HealthCareandSocial Assistance Arts,Entertainement,and Recreation AccommodationandFood Services OtherServices (exceptPublicAdministration) FederalGovernment StateGovernment,exc. EducationandHospitals LocalGovernments,exe. EducationandHospitals AdministrativeandSupportandWaste ManagementandRemediationServices $0 $20,000.00 $40,000.00 $60,000.00 $80,000.00 0 75000 150000 225000 300000 Chart 1 Average Wage 2008 Employment $80,000 $60,000 $40,000 $20,000 $0 300,000 225,000 150,000 75,000 0 Jobs 0 75000 150000 225000 300000 Chart 1 ge 2008 Employment EH=<=E(JI HIKI<K=JE E<<((FGGG =KJIIKG<F G(FGK(GF> E<K>GKGI< HGGF(JJ<G K>GJK=JEE G>GG(G><> ==FE<=IGJ G=>=IFGGG >J<FJKF=K HG<>G(JJJ GI(JKFK<E =IIG<=K=G H=K=FGJ>> (F=G>IFKF H==FFE>(I HGGJK=JI> E(HGGJ(GK HE>>>(EFF $0 $20,000.00 $40,000.00 $60,000.00 $80,000.00 Chart 1 Average Wage 2008 Employment
- 7. 7 5 In order to determine this, we used the Labor Market Assessment Tool (LMAT). For this analysis we used the industrial makeup and corresponding employment levels of the Metro Boston labor market. From there, we applied an industry/occupation matrix for the Commonwealth of Massachusetts to get the occupational titles and employment distribution within each industry. Next, LMAT accesses data on occupational charac- teristics based on incumbent surveys on the education and skill required to work in that job.Aggregated, these data can show us the education and skills needed within specific industries, as well as the labor market at large. For more information on LMAT, please see: Melnik, M.; Lima,A.; Introducing the Labor Market Assessment Tool; Boston Redevelopment Authority, Research Division, November 2007. Educational Requirements: Metro Boston’s Labor Market-2008 Figure 7: As Figure 7 shows, 28% of Metro Boston’s labor market requires a bachelor’s degree or higher5 .While this is a significant number of jobs, a large proportion of overall jobs in the Greater Boston region require no more than an associate’s degree (72%). Of course, the number of jobs available at each education level is only one aspect to consider when examining the relationship between educational requirements and the labor market. It is also extremely important to consider the economic return to education. As one would expect, there is a close relationship between the education required for an occupation and the average salary of those jobs. /;F%!!$/;F%!!$/;F%!!$/;F%!!$ / %D %D CD CD CD #D &D %D 2% 1% 5% 19% 9% 19% 32% 12% Less than H High Schoo Post HS Associate Bachelors Masters D Profession PhD % /20+2047:;720I-QB+>0N>O77B: English Spanish Haitian Creole Less than High School High School Graduate Post HS Associate Degree Bachelors Degree Masters Degree Professional Degree PhD Source: Labor Market Assessment Tool; BRA Research Division Analysis. Briefing Book: Labor Market Trends in Metro Boston
- 8. 8 Briefing Book: Labor Market Trends in Metro Boston Figure 8 clearly demonstrates the close relationship between educational requirements and wages. We see that there is a wide pay differential as educational requirement increases. For example, the average salary for occupations requiring a high school diploma in the Metro Boston region is slightly more than $37,000. For occupations that require just two more years of schooling the average salary increases to over $50,000. Occupations requiring a bachelor’s degree pay just under $73,000 on average. When discussing labor market participation for immigrants, perhaps no specific skill receives more attention than the ability to speak English. Numerous recent research reports have focused on the increased role immigrants are expected to take in the labor market as the Baby Boom generation moves towards retirement6 . As a result, English language ability of the workforce is an integral part of the human capital. Moreover, language skill requirement is a key characteristic in understanding the relationship between immigration and labor market participation. 6 Three local examples of such research is the MassInc report The Changing Face of Massachusetts and Boston Redevelopment Authority Research Division’s reports Language Skill Requirements in the Labor Market and Revisiting Language Skill Requirements in the Labor Market. Employment and Wage by Educational Attainment: Metro Boston, 2008 Figure 8: Source: Labor Market Assessment Tool; BRA Research Division Analysis. h School raduate Post HS Associate Degree Bachelors Degree Masters Degree Professional Degree PhD >F@L(> F(B;<@ (>BC<E F(L>EL B<(E@U@ (E(C(U@ FE>@<UE FB((F >CLFCU@ >BECBUB B@<F@UL BE<>;U( (C@L(F <;;@CUE $80,000.00 ss than High School Post HS Bachelors Degree Professional Degree 0 27500 55000 82500 110000 201350 532815 317492 157096 318568 79162.2 16101.2 36529.6 28420.9 37113 50830.2 57607.7 72932.8 76954.1 102813 94420.6 2008 Employment 2008 Wage ate e Bachelors Degree Masters Degree Professional Degree PhD BC<E F(L>EL B<(E@U@ (E(C(U@ FE>@<UE ECBUB B@<F@UL BE<>;U( (C@L(F <;;@CUE 000.00 st HS Bachelors Degree Professional Degree 0 27500 55000 82500 110000 7492 157096 318568 79162.2 16101.2 36529.6 50830.2 57607.7 72932.8 76954.1 102813 94420.6 nt 2008 Wage Less than High School High School Graduate Post HS Associate Degree Bachelors Degree Masters Degree Professional Degree PhD 8 Empl 8 Wage @C(F>C >F@L(> F(B;<@ (>BC<E F(L>EL B<(E@U@ (E(C(U@ FE>@<UE @L;@CU< FB((F >CLFCU@ >BECBUB B@<F@UL BE<>;U( (C@L(F <;;@CUE $60,000.00 $80,000.00 0 150000 300000 450000 600000 Less than High School Post HS Bachelors Degree Professional Degree 0 27500 55000 82500 110000 2008 Employment 2008 Wage Less than High School High School Graduate Post HS Associate Degree Bachelors Degree Masters Degree Professional Degree PhD 8 Empl 8 Wage @C(F>C >F@L(> F(B;<@ (>BC<E F(L>EL B<(E@U@ (E(C(U@ FE>@<UE @L;@CU< FB((F >CLFCU@ >BECBUB B@<F@UL BE<>;U( (C@L(F <;;@CUE $60,000.00 $80,000.00 0 150000 300000 450000 600000 Less than High School Post HS Bachelors Degree Professional Degree 0 27500 55000 82500 110000 201350 532815 317492 157096 318568 79162.2 16101.2 36529.6 28420.9 37113 50830.2 57607.7 72932.8 76954.1 102813 94420.6 2008 Employment 2008 Wage Less than High School High School Graduate Post HS Masters Degree Bachelors Degree Associate Degree Professional Degree PhD Jobs $110,000 $82,500 $55,000 $27,500 $0 600,000 450,000 300,000 150,000 0
- 9. 9 Briefing Book: Labor Market Trends in Metro Boston In order to understand language skill requirements in the labor market, we used the Labor Market Assessment Tool (LMAT)7 . We selected three language-based variables: speaking, writing, and reading comprehension8 and aggregated the scores into a language skill scale. The higher the score on the variable, the more important language proficiency is in performing the job. Next, we split occupations into four categories, or quartiles, of language skill: Low, Medium-low, Medium-high, and High. The occupations scoring in the lowest 25% of language skill requirements were placed in the Low category, occupations scoring between 26% and 50% were placed in the Medium-low category, jobs scoring between 51% and 75% were placed in the Medium-high category, and jobs scoring in the top 25% were placed in the High category. Using this taxonomy, we examined the proportion of total jobs in the labor market and the average wages in each of the language skill categories9 . As Figure 9 shows, approximately 62% of all jobs in Metro Boston’s labor market fall in the medium-low or the medium-high language skill categories. In short, the vast majority of jobs in Metro Boston’s labor market require at least medium-low language skill (approximately 82%). As expected, there is a clear connection between language skill requirements and salary. Occupations in the highest language skill category pay over three times more than occupations in the lowest language skill category. So, while there are jobs available to people with very limited language skill, there are significant social and economic issues to consider. Jobs that require low levels of language skill pay dramatically less than jobs that require high levels of language skill. This can be a significant quality of life issue for immigrants living in the Greater Boston region and speaks to the importance of ESOL training. Figure 9: Source: Labor Market Assessment Tool; BRA Research Division Analysis. 7 As discussed in footnote 4, LMAT employs a number of secondary data sources, including the Occupational Employment Statistics (OES) and the Occupational Information Network (O*NET), and makes it possible to examine the educational and skill requirements for various occupations. 8 These variables are measured on two separate Likert scales.Workers are asked to rate how important a particular skill is in doing their current job on a 1-5 scale, as well as what level of that skill is needed in doing their current job on a 1-7 scale.The higher the score on the scale, the more important language skills are in performing jobs tasks within the selected occupation.We tested the reliability within and between each language skill. 9 The steps in this research process are the same as the ones undertaken during the BRA Research Division report on Language Skill Requirements in the Labor Market piece. 0 250000 500000 750000 1000000 1 2 3 4 $0 $20,000 $40,000 $60,000 $80,000 Employment Average Wage 1 2 3 4 Employment Average Wage !"#$%& '%#'(# )(##)' ('"#$& "!#(% %%$((*) !%&+)*) +$$$&*') # & $ 0.00 250,000.00 500,000.00 750,000.00 1,000,000.00 1 2 3 4 $0 $21,250 $42,500 $63,750 $85,000 2008 Average Salary 2008 Average Salary Jobs $85,000 $63,750 $42,500 $21,250 $0 100,000,000 750,000 500,000 250,000 0 Employment and Wage by Language Skill Requirements: Metro Boston-2008
- 10. 10 Briefing Book: Labor Market Trends in Metro Boston 10 These numbers were estimated by applying the New England Economic Partnership’s (NEEP) 10-year projections to the 2008 employment estimates for the Metro Boston region. Figure 10: Characteristics of Projected New Jobs Created in Metro Boston- 2008-2018 Of course, most discussions about the economy today focus on the current high unemployment rate and with the belief that jobs continually require more education, training, and skills. In this section we will examine the projected employment change by major industrial grouping in Greater Boston between 2008 and 2018. In addition, we will look at educational and language skill requirements for new jobs expected to be created in our region. Figure 10 shows the expected job change in Greater Boston10 for each of the major industrial groupings between 2008 and 2018. The industries expected to create the largest number of new jobs include Health Care and SocialAssistance and Educational Services. The industry expected to suffer the greatest amount of job loss in our region is the Construction Industry. Source: Massachusetts Department of Labor and Workforce Development, ES-202 Data; New England Economic Partnership 10-year projections; BRA Research Division Analysis. Job Change by Major Industrial Grouping-Metro Boston-2008 to 2018Job Change by Major Industrial Grouping-Metro Boston-2008 to 2018 NAICS Industry Projected Change: 2008-2018 11 Agriculture, Forestry, Fishing and Hunting -84 21 Mining -74 22 Utilities 12,251 23 Construction -9,248 31-33 Manufacturing -643 42 Wholesale Trade 2,708 44-45 Retail Trade 6,198 48-49 Transportation and Warehousing 5,252 51 Information 2,343 52 Finance and Insurance 7,377 53 Real Estate and Rental and Leasing 309 54 Professional, Scientific, and Technical Services 25,611 55 Management of Companies and Enterprises 894 56 Administrative and Support and Waste Management and Remediation Services 7,140 61 Educational Services 43,586 62 Health Care and Social Assistance 64,255 71 Arts, Entertainement, and Recreation 413 72 Accommodation and Food Services 8,547 81 Other Services (except Public Administration) 6,728 91 Federal Government 169 92 State Government, exc. Education and Hospitals 442 93 Local Governments, exe. Education and Hospitals 678 184,852 Source: Massachusetts Department of Labor and Workforce Development, ES-202 Data; New England Economic Partnership 10-year projections; BRA Research Division Analysis.Source: Massachusetts Department of Labor and Workforce Development, ES-202 Data; New England Economic Partnership 10-year projections; BRA Research Division Analysis.Source: Massachusetts Department of Labor and Workforce Development, ES-202 Data; New England Economic Partnership 10-year projections; BRA Research Division Analysis. Job Change by Major Industrial Grouping: Metro Boston-2008 to 2018
- 11. 11 Briefing Book: Labor Market Trends in Metro Boston Characteristics of Projected New Jobs To understand how the labor market is changing, it is important to focus our attention on those new jobs projected for the local economy by 2018. In Figure 11 we see two prevailing themes. First, the educational requirement for new jobs created in Greater Boston is higher on average than the current labor market. Approximately 37% of the jobs in the region’s current labor require an associate’s degree or higher. However, of new jobs expected to be created in the region by 2018, over half of them (53%) will require at least an associate’s degree. This speaks to the notion of the economy fundamentally shifting towards jobs requiring more education and skills in the future. That said, there are still a substantial number of projected new jobs in the labor market that require limited educational attainment. In looking at the relationship between educational requirements and wages for projected new jobs in Greater Boston, we see similar trends to those observed in Figure 7. Less than High School High School Graduate Post HS Associate Degree Bachelor’s Degree Master’s Degree Professional Degree PhD Educational Requirements for New Jobs: Metro Boston’s Labor Market-2008 to 2018 Figure 11: Source: Labor Market Assessment Tool; BRA Research Division Analysis.
- 12. 12 Briefing Book: Labor Market Trends in Metro Boston 11 Wages are in 2006 dollars. In Figure 12, we see a strong positive relationship between educational requirements and the wages earned. Notably, of projected new jobs in our region, occupations requiring a bachelor’s degree pay more than twice as much on average than jobs requiring a high school diploma ($71,528 to $39,851, respectively)11 . Jobs requiring an associate’s degree pay over $15,000 more a year than jobs requiring a high school diploma. This is a substantial jump up in average wage, particulary with what amounts to roughly two additional years of training. Of particular importance for Boston’s immigrant communities, though, is the role English language skill is likely to play with new jobs created in the region. While we saw in Figure 9 that the vast majority of jobs in Greater Boston require at least medium-low language skill, the importance of language skill appears to be even greater for projected new jobs in the region. Figure 12: Source: Labor Market Assessment Tool; BRA Research Division Analysis. 0 27500 55000 82500 110000 Less than High School Post HS Bachelors Degree Professional Degree 0 12500 25000 37500 50000 New Wages New Jobs 0 27500 55000 82500 110000 Less than High School Post HS Bachelors Degree Professional Degree 0 12500 25000 37500 50000 New Wages New Jobs S Bachelors Degree Professional Degree 0 12500 25000 37500 50000 New Jobs Employment and Wage by Educational Attainment: Metro Boston, 2008-2018 $110,000 $82,500 $55,000 $27,500 $0 Less than High School High School Graduate Post HS Masters Degree Bachelors Degree Associate Degree Professional Degree PhD Jobs 50,000 37,500 25,000 12,500 0
- 13. 13 Briefing Book: Labor Market Trends in Metro Boston As discussed earlier, approximately 82% of all jobs in Metro Boston require at least medium-low language skill. However, close to 91% of projected new jobs in the region for 2018 require at least medium-low language skill. Interestingly, the proportion of expected new jobs requiring high language skill is significantly higher than the proportion of jobs requiring high language skill in the current labor market (34% versus 19.5%, respectively). Again, we see a strong link between language skill requirements and wages. Projected new jobs requiring high language skill pay almost four times more than projected new jobs requiring low language skill. These data further underscore the importance of ESOL training both for Boston’s immigrant communities, as well as the long term economic health of the region. First, projected new jobs in the region appear to require more education and language skill than is required in the current labor. In addition, there is a strong link between education and language skill requirements and average wages. This has obvious quality of life implications for members of Boston’s immigrant communities—specifically their ability to earn sufficient wages to care for their families. In terms of the economic health of Metro Boston, with the Baby Boomer generation approaching retirement age and the foreign-born accounting for most, if not all, of the population growth in the region, immigrants are expected to play an important role in filling critical job vacancies. As a result, the human capital of the foreign-born population, specifically educational attainment and English language proficiency, is an important economic development issue. New jobs in the region will require advanced education and at least moderate English language skill. If the workforce expected to fill these positions lacks the human capital necessary to hold these jobs, the labor market may be faced with significant skills gap issues. Employment and Wage by Language Skill Requirements: Metro Boston, 2008-2018 Figure 13: Source: Labor Market Assessment Tool; BRA Research Division Analysis. 0 25000 50000 75000 100000 1 2 3 4 $0 $20,000 $40,000 $60,000 $80,000 Employment Average Wage 1 2 3 4 $0 $20,000 $40,000 $60,000 $80,000 Employment Average Wage UC<;><<;@ U@@@F><@< UF;FCLCE> UFF<<ECEF 0 25000 50000 75000 100000 1 2 3 4 $0 $20,000 $40,000 $60,000 $80,000 Employment Average Wage 110,000 Jobs 75,000 50,000 25,000 0 $80,000 $60,000 $40,000 $20,000 $0
- 14. 14 Source: U.S. Census Bureau3 Briefing Book: Labor Market Trends in Metro Boston In this brief, we focused on Boston’s native-born and foreign-born workforces, examining some of the key attributes of these two populations, including demographic composition and economic outcomes. In addition, we examined key characteristics of Metro Boston’s current labor market and how our labor market is likely to change in the future. Overall, Boston’s native-born and foreign-born workforces are quite different. Boston’s native- born workforce is more educated on average. Boston’s foreign-born workforce is much more racially diverse. In terms of workforce participation outcomes, Boston’s native-born workforce earns higher salaries on average than Boston’s foreign-born workforce. In addition, Boston’s native-born workforce tends to work in white-collar industries and occupations, while Boston’s foreign-born workforces typically work in blue-collar and service industries and occupations. While both of these factors are likely related to educational attainment to some degree, close inspection of the data shows that Boston’s foreign- born workforce typically earns less money on average than Boston’s native-born workforce at the same levels of education. In fact, income inequality between the native-born and foreign-born workforces increases with educational attainment. In addition, Boston’s foreign-born workforce also earns less money on average than Boston’s native-born workforce within the same occupational classifications. Possible explanations as to why income disparities exist between the native-born and foreign-born workforces with the same level of education and within the same occupational classification include English language proficiency, social networks, and discrimination in the job market. Lastly, we looked at Greater Boston’s labor market in terms of industrial characteristics and educational and language skill requirements. Overall, we saw that there is a close connection between educational and language skill requirements and how much those jobs pay on average. While there are, and will continue to be, a number of jobs available for people with limited educational attainment and skills, it appears that occupations requiring advanced education and language skill are the jobs that are expected to grow the most in our region in the coming years. This has the potential to be a serious economic problem for our region. As noted throughout this report, there are segments of Boston’s foreign-born population with serious human capital deficiencies related to educational attainment and English language proficiency. As the Baby Boomer generation moves closer to retirement, it is often stated that immigrants will play an important role in filling critical job vacancies in our region. As a result, it is essential that members of both Boston’s public and private sector recognize the importance of improving the human capital characteristics of Boston’s foreign-born workforce, not just for improving the income and quality of life of our region’s immigration population, but also ensuring the long term economic viability of our region. Mayor’s Office of NEW BOSTONIANS Agnes Chang RESOURCE DEVELOPMENT MANAGER Boston City Hall, Room 803 1 City Hall Square, Boston MA 02201-1165 Phone: 617.635.1960 Fax: 617.635.4540 Email: agnes.chang@cityofboston.gov www.cityofboston.gov/newbostonians Mayor’s Office of NEW BOSTONIANS Agnes Chang RESOURCE DEVELOPMENT MANAGER Boston City Hall, Room 803 1 City Hall Square, Boston MA 02201-1165 Phone: 617.635.1960 Fax: 617.635.4540 Email: agnes.chang@cityofboston.gov www.cityofboston.gov/newbostonians Conclusions 14 Produced for the Mayor’s Office of New Bostonians By the Boston Redevelopment Authority’s (BRA) Research Division Research Team: Alvaro Lima - Research Director, BRA Mark Melnik - Deputy Director for Research, BRA Professor Barry Bluestone, Founding Director, Director, Dukakis Center for Urban and Regional Policy and Dean of the School of Public Policy and Urban Affairs at Northeastern University