Brazilian Self Employment
•Transferir como PPTX, PDF•
1 gostou•275 visualizações

Dados sobre o nível de emprego autonomo dos brasileiros nos Estados Undios.

Recomendados
Recomendados
Mais conteúdo relacionado
Mais de Instituto Diáspora Brasil (IDB)
Mais de Instituto Diáspora Brasil (IDB) (20)
Brazilian Self Employment
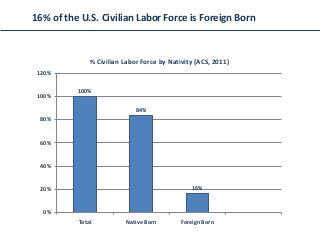
- 1. 16% of the U.S. Civilian Labor Force is Foreign Born % Civilian Labor Force by Nativity (ACS, 2011) 120% 100% 100% 84% 80% 60% 40% 20% 16% 0% Total Native Born Foreign Born
- 2. 0.0% 5.0% 10.0% 15.0% 20.0% 25.0% 30.0% 35.0% Tonga Denmark Czechoslovakia Jordan Greece Israel Lebanon BRAZIL Paraguay Hungary Senegal Northern Ireland Syria Switzerland Korea Yemen Iran Slovakia Georgia Netherlands Italy Latvia Lithuania Estonia Argentina Afghanistan Turkey Moldova Norway Kazakhstan Singapore USSR South Africa Romania Poland Bulgaria Croatia Belarus Ireland % Self Employed Among Civilian Population in the U.S. Labor Force (ACS, 2011) Algeria Pakistan Australia Chile Costa Rica Brazilians have the 8th largest self employed population Macedonia Uruguay Venezuela % Self Employed – Native Born (8.9%) % Self Employed – Foreign Born (11.1%) Czech Republic % Self Employed – Total Population (9.2%) Belgium England
- 3. $20,000.00 $40,000.00 $60,000.00 $80,000.00 $100,000.00 $120,000.00 $140,000.00 $160,000.00 $0.00 Brazil Costa Rica Colombia Macedonia Cameroon Trinidad & Tobago Bangladesh Yemen Samoa Nigeria Indonesia Uzbekistan Cuba Bosnia and Herzegovina Total Lithuania China Poland Kuwait Jordan Georgia Barbados Croatia Korea Turkey Czechoslovakia Russia Pakistan Spain Hungary USSR Finland Mean Income for Foreign Born Self Employed (ACS, 2011) Grenada Sweden Australia South Africa Israel Self Employed Brazilians have one of the lowest mean income Belgium Mean Income – Total Population - Self Employed - $29.975,35 Sri Lanka Mean Income – Self Employed Brazilians - $29.975,35 Bermuda Iceland
- 4. For more information visit www.digaai.com and search for Empreendedorismo… Para maisinformaçõesvisitewww.digaai.comebusqueotermoEmpreendedorismo