1. Tyler Bailey
9/21/2016
Dosenet Additions Report
The goal of Dosenet is to provide transparent, relevant measurements of radioactivity in
the environment for the purposes of outreach, public education, and research. These devices are
located throughout the Bay Area and are steadily being added to locations throughout Europe
and Asia. There are currently two devices that Dosenet utilizes: The Silicon Device and the
Kromek D3S. The Silicon Device is the original device and is a silicon detector connected to a
Raspberrypi Microcontroller. The actual silicon detector is sourced from the Japanese nonprofit,
Radiation-Watch. The detector counts the amount of gamma radiation (number of photons) that
are incident on detector’s surface area, converts the counts (number of photons that are incident
on the detector) into counts per minute averaged over a five-minute period, and then converts the
counts per minute to the rate of radiation dose (microsieverts per hour) that people are being
exposed to. This radiation dose is then sent to the central server which is displayed to the public
through the website URL https://radwatch.berkeley.edu/dosenet/map. The long term goal for
development of the Silicon Device is to prepare them for WIFI access (the devices are currently
connected to the internet through Ethernet), and to revamp the source code to facilitate future
software development. The main reason for preparing them for WIFI access is to allow device to
be located outside of buildings. This allows data to be collected on how weather conditions can
affect natural radiation levels.
The Kromek D3S is a Cs-I detector and is currently being prepared for deployment into
schools. The D3S is a spectrum detector which means it has the ability to distinguish the energy
of the gamma radiation that is incident on the detector. The appeal of this feature is that it
provides adequate information to determine which specific radioisotopes are located in the
2. environment. Like the Dosenet Device, the D3S is connected to a Raspberrypi microcontroller
and will send data to the same central server. To prepare the D3S devices for the public, the
original code that Kromek designed had to be modified and combined with code that will allow
the D3S to serve similar purposes as the Dosenet Device. Scripts also had to be designed to add
plotting features to the D3S for ease of data visualization.
The main improvement made to the Silicon Device code is the Data_Handler class. This
class’s main purpose is to decide and execute what to do with each cpm (counts per minute).
This cleans up the Manager class (Manager manages all the other classes) because Manager only
has to call a Data_Handler.handle_cpm method which only takes up one line in the Manager
class. The Data_Handler class also adds a data_log and a save_to_memory feature. The data_log
allows data to be collected in a text file. This data is envisioned to be used for future educational
purposes for high school or middle school students who are interested in programming and/or
nuclear science. The save_to_memory feature allows data not to be loss if the internet connection
goes down during device operation. If data fails to send or to be received by a server, it is added
to a deque object. The data is stored there until the network goes back up or if the device reboots.
If the device turns off (during a nightly reboot or a manual shut off), the data is sent to a backlog
file. Upon the initialization of the manager class (in other words a reboot or when a device is
manually turned on), saved data in this backlog file is resent to the deque object thus preventing
the loss of data.
The other improvement made is the switch from UDP to TCP network protocol. The
main allure of TCP protocol is that there is no need for a Network class. This old class included a
couple sub-processes which had the potential to make some features unnecessarily complex and
hard to update. The TCP protocol instead checks to see if the network is up just by trying to send
3. the data to the server. If everything is working correctly, nothing happens, and the data is
successfully sent. If the network is down, the program alerts the user, and the data is sent to the
deque object. To add this feature, the Data_Handler class had to be adjusted. The main method
essentially turned into a try and except block. The method will try to normally send the data. If a
socket error is raised (most commonly caused when the network is down), an error message will
be printed and the data will be sent to the deque object.
The newest Dosenet device, D3S, is a Cs-I detector. The device code is modeled
similarly to the Dosenet device code. It includes a Manager_D3S class, a Data_Handler_D3S
class, and uses some newly added methods from the Sender class (Sender is in charge of sending
data to the central server). The one challenge with the D3S code is incorporating the code that
came with the device. This code is not the easiest to read and also imports a substantial number
of objects from the Kromek library. To tackle this obstacle, the original code has been modified
and implanted into the run method of the Manager_D3S class. The device is structured to send
data every minute through a TCP network protocol. The Sender methods that were added are
specifically tailored to the type of data that the D3S device sends. The Manager_D3S also
collects the data in a Numpy array object for easier data manipulation in the future. There is also
some code that allows LED support for future development.
Plotting features have also been implemented for the D3S device. The first plotting script
plots the Total Spectrum that the D3S device gathers. The D3S device has a data_log feature
similar to the Silicon Device. After allowing the device to operate for some time under the
data_log mode (the device sends data to the data_log), the data can be extracted from the
data_log and put into a deque object. From there, a method exists that ensures the data is in a
Numpy array and then rebins to 256 bins (the default is 4096) to remove noise. The script then
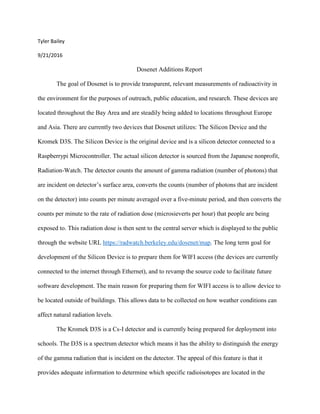
4. sums up all the data and outputs a Matplotlib plot of the total spectra. An example plot is located
below in Figure 1. The other plotting script that has been added plots a Waterfall plot. Once
again data is extracted from the data_log and put into a deque object. The data is made sure to be
a Numpy array and also rebinned as before. The goal of this Waterfall plot is to take data from
the deque and show the progression of the spectra versus time. For ease of visibility, the plot will
display each spectra as a color map where each index will represent a bin and each color will
represent an amount of counts. Each individual spectrum will be represented by a row and each
row will be stacked together forming an array-like plot. An example waterfall plot is located
below in Figure 2.
Figure 1
Figure 1 shows an example of the Total Spectrum Plotting feature. Data was collected from the
natural radiation levels in the basement of Etcheverry Hall. The y-axis is the number of counts
while the x-axis is the channel number (or bin number).
5. Figure 2
Figure 2 shows an example of the Waterfall Plotting feature. Data was collected from the natural
radiation levels in the basement of Etcheverry Hall. The y-axis labels each spectrum while the x-
axis is the channel number (or bin number). For this colormap, red indicates the highest amount
of counts while blue indicates low or no counts.
Overall, the Silicon Device’s code has been revamped to be more object-orientated.
Along with this, the device now operates under TCP network protocol, and a memory buffer has
been implemented which prevents data from being loss in the case when the network is down or
when the data fails to send. This has all been done in order to pave way for the inevitable switch
to wireless from wired network connection. The D3S device’s original code has been modified
and combined with code so the device can interact with the Dosenet Network. The framework
has also been established for plotting features on the D3S with plotting scripts including the
6. Total Spectrum Plot and the Waterfall Plot. Other features that are still in development or need to
be developed are modifying how different devices reboot nightly to check for new software
updates, adding a TCP ‘handshake’ feature where the network will check which git repository
the software on a certain device is from and which repository should perform a git pull from to
try to update the software, and enabling for the Waterfall plot to run and update in real time.