
Recomendados
Mais conteúdo relacionado
Mais procurados
Mais procurados (20)
Destaque
Semelhante a LARGE SCALE INSTALLATION OF SUBSURFACE DRAINAGE SYSTEM
Semelhante a LARGE SCALE INSTALLATION OF SUBSURFACE DRAINAGE SYSTEM (20)
Mais de Tushar Dholakia
Mais de Tushar Dholakia (20)
Último
Último (20)
LARGE SCALE INSTALLATION OF SUBSURFACE DRAINAGE SYSTEM
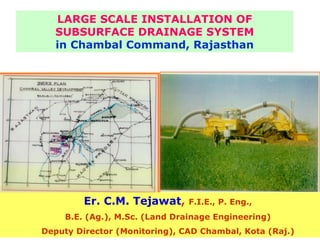
- 1. LARGE SCALE INSTALLATION OF SUBSURFACE DRAINAGE SYSTEM in Chambal Command, Rajasthan Er. C.M. Tejawat, F.I.E., P. Eng., B.E. (Ag.), M.Sc. (Land Drainage Engineering) Deputy Director (Monitoring), CAD Chambal, Kota (Raj.)
- 4. Gandhi Sagar Dam (M.P.) Rana Pratap Sagar Dam (Raj.) Jawahar Sagar Dam (Raj.) Kota Barrage (Raj.)
- 5. LIFE LINE OF HADOTI
- 6. Left Main Canal (Rajasthan) Right Main Canal (Rajasthan & M.P.)
- 7. G.C.A. 4,85,000 ha Command Area - Chambal C.C.A. 2,29,000 ha Districts wise CCA Kota – 1,04,000 ha Baran - 28,000 ha Bundi – 97,000 ha
- 8. Chambal Command Area, Rajasthan Irrigable Area 2,29,000 ha. Irrigation 1960 Started Soils Uniform Clay – Loam Vertisols Below 1.5 – 2.0 m • Yellowish brown heavy clay layer Yellow silty clay (murrum layer) 20-30 m with higher permeability
- 9. PROBLEMS Waterlogging in the fields of head reaches. Increase in Salinity and Alkalinity of Soil. Decrease in Crop Production. Wastage of Irrigation Water .
- 10. Extent of Problem Water logging : 1,61,000 ha. Soil Salinity : 25,000 ha.
- 11. UNDP Project To find means to protect the Land from Salinity and Waterlogging. To study problem of weed control in existing Irrigation Canals and Drains. To Design and Execute Irrigation Improvement, Land Shaping and Drainage on Pilot Areas. To develop proper Water Management Principals and to make recommendations. To develop proper Land Use Pattern and Farm Practices for Intensification of Agriculture.
- 12. World Bank Project Started in 1974 Planned to provide Surface Drainage in 1,67,000 ha area. 74 Drainages Sub-basins identified having Waterlogging problem. Sub-basin 1000-10,000 ha A Main Drain Several Secondary Drains at about 500 m spacing. Seepage drains alongside the canals.
- 15. Command Area Development Project Main Objectives Improvement and increase in the Capacity of Canal. Increase in Crop production with the help of improved Agriculture Techniques. On-Farm Development Works. The Major thrust was given to On Farm Development Works.
- 16. On Farm Development Works Objectives Efficient water utilization to increase Irrigated Cropping Intensity. Maximum yields by scheduling Irrigation water application, providing adequate drainage & better cultivation techniques. Easy access to individual field through improved road network. Shaping the Land to enable efficient Irrigation of field Crops.
- 17. O.F.D. Works Construction of Irrigation & Drainage ditches for each field. Providing road network to each field. Land shaping for efficient Irrigation. Re-alignment of the farm boundaries.
- 23. RAJAD Rajasthan Agriculture Drainage Research Project (1992-1999) INSTALLATION OF R SUBSURFACE DRAINAGE SYSTEM A in Chambal Command, Rajasthan J A D
- 24. Selection of Reclamation Technology Subsurface Drainage + Surface Drainage + On Farm Development Works Provides an integrated soil and water management program to optimize sustainable crop production in saline & waterlogged lands. Chambal Command Area-Rajasthan
- 25. Area Selection •RAJAD Project - 25,000 ha Salinity Ec > 4 dS/m in top 1.5 m soil profile in at least 50% of the selected area. Waterlogging Water table depth < 40 cm in 70% of the area for duration of at least 3 days. Water table depth < 1.2 m in 70% of the area for a continuous duration of at least 30 days during an average rabi/kharif season.
- 26. Area Selection
- 27. Drainage Investigation ECe (dS/m) Area Area (ha) (%) 0-2 24569 48.90 2-4 7743 15.41 Sub Total for 32312 64.31 non saline area 4-8 12869 25.61 8-16 4510 8.98 >16 555 1.10 Sub Total for 17934 35.69 saline area Grand total 50246 100.0
- 28. Area Selection •280 Observation wells installed •256 ha (1600 m grid) •2.5 m deep & 1.5 m deep •Measurements were taken on weekly basis •Farmers Participation was involved •Data of 275 wells were analysed •Monitoring period Dec. 94 to Jan. 97
- 29. Area Selection
- 30. Area Selection
- 31. Drainage Investigation Use of Total Station Survey Equipment
- 32. Drainage Investigation Auger Hole Method
- 33. Data Storage and Retrieval Computerized Central Data Base System
- 34. Development of Design Criteria • 12 Research Sites International • 4 years of data monitoring Panel of Experts & analysis
- 35. DESIGN OF SUBSURFACE DRAINAGE SYSTEMS Design Criteria for SSD in Chambal Command Area Saturated Hydraulic Conductivity • Measured at 1.0, 1.5, 2.0 & 2.5 m depth • Grid 8.58 ha • Test plot results indicated: •Top 1 m 0.25 – 0.55 m/day •1 – 1.5 m 0.02 – 0.20 m/day •Below 1.5 m 0.75 m/day
- 36. DESIGN OF SUBSURFACE DRAINAGE SYSTEMS Geometry of a Transient State Drainage System
- 37. DESIGN OF SUBSURFACE DRAINAGE SYSTEMS Modified Glower Dumn Equation 0.5 −0.5 ⎡K *d *t ⎤ ⎡ ⎛ H 0 ⎞⎤ L=π⎢ ⎥ * ⎢ln⎜1.16 * ⎟⎥ ⎣ μ ⎦ ⎣ ⎝ Ht ⎠⎦ H0 d = de + 2 L de = 8*f h 2 [L- D* 2.0 ] 1 D fh = + * ln 8 * D* L π r 0 * 2.0
- 38. DESIGN OF SUBSURFACE DRAINAGE SYSTEMS Design Criteria for SSD in Chambal Command Area Drainable Porosity μ = {0.0376 * (Ksat) 0.25} Chambal Varient (68%) μ = {0.0386 * (Ksat) 0.25} Kota Varient (28%)
- 39. DESIGN OF SUBSURFACE DRAINAGE SYSTEMS Design Criteria for SSD in Chambal Command Area Water Table Draw Down 20 cm in 3 days to control irrigation induced salinity Used for spacing calculation in transient equation
- 40. DESIGN OF SUBSURFACE DRAINAGE SYSTEMS Design Criteria for SSD in Chambal Command Area Average Drain Depth Depending on soil properties, crop, extent of soils salinity, gravity outlet 1-1.5 m below ground surface with average of 1.2 m
- 41. DESIGN OF SUBSURFACE DRAINAGE SYSTEMS Design Criteria for SSD in Chambal Command Area Simple Equations for Drain Spacing For Chambal Soil Series • Drain Spacing = 8.71 + 73.36 * Ksat0.5 For Kota Soil Series • Drain Spacing = 13.61 + 67.92 * Ksat0.5
- 42. DESIGN OF SUBSURFACE DRAINAGE SYSTEMS Design Criteria for SSD in Chambal Command Area Computer Program for Drain Spacing For calculating drain spacing grid wise • Auger hole Ksat dat • Drainable porosity v/s Ksat • Design Criteria
- 43. DESIGN OF SUBSURFACE DRAINAGE SYSTEMS Design Criteria for SSD in Chambal Command Area Drain Spacing Calculated for each grid (8.58 ha) Geometric mean of calculated spacing (100- 150 ha area block) Rounded to next multiple of 5 m Range of spacing 35-85 m
- 44. DESIGN OF SUBSURFACE DRAINAGE SYSTEMS Design Criteria for SSD in Chambal Command Area Drainage Coefficient • Laterals 1.5 mm/day • Collectors 3.0 mm/day For pipe capacity calculation only
- 45. DESIGN OF SUBSURFACE DRAINAGE SYSTEMS Design Criteria for SSD in Chambal Command Area Pipe Size ⎡ q *S *L*n ⎤ d =⎢ 8 d 3 ⎥ ⎣ 0.31168 * i ⎦ 1 2 Minimum pipe diameter --- 72/80 mm
- 46. DESIGN OF SUBSURFACE DRAINAGE SYSTEMS Manning’s Roughness Coefficient & Grade I.D. (mm) O.D. (mm) n Minimum Grade (%) 72 80 0.015 0.10 88 100 0.015 0.10 144 160 0.016 0.09 178 200 0.017 0.08 258 294 0.018 0.07 315 355 0.019 0.06 401 455 0.019 0.05
- 47. DESIGN OF SUBSURFACE DRAINAGE SYSTEMS Design Criteria for SSD in Chambal Command Area Length of Lateral 8/3 1/2 0.31168 * d * i Lmax = qd * S * n Depends on physical limitation, farm size, layout pattern etc.
- 48. DESIGN OF SUBSURFACE DRAINAGE SYSTEMS Design Criteria for SSD in Chambal Command Area Minimum Soil Cover Depends on soil conditions & depth of outlet drain Minimum soil cover of 0.90 m Exceptional cases: Up to 100 mm dia 0.60 m 160-455 mm dia 0.80 m
- 49. DESIGN OF SUBSURFACE DRAINAGE SYSTEMS Design Criteria for SSD in Chambal Command Area Envelope Requirement Clay % Envelope Requirement >40 Not required 30-40 & SAR >8 Required <30 Required Pipe grade >0.4% --- not required
- 50. Design of SUBSURFACE DRAINAGE SYSTEMS
- 51. Design of SUBSURFACE DRAINAGE SYSTEMS
- 53. Computer Aided Design Procedure
- 54. Computer Aided Design Procedure
- 56. Position of Outlet Field Drain Carrier Drain Main Drain
- 57. Minimum Permissible Clearance for SSD Outlet Depth of Base Flow Allowance for Free Depth to SSD Outlet (db) Sedimentation Board Invert (ds) (df) Less than 65 cm 20 cm 15 cm SDBE+db+df Min 45 cm & Max. 85 cm More than 65 cm 20 cm Nil SDBE+db
- 58. Drainage Material Up to 100 mm corrugated PVC pipes were available Smooth Wall Rigid Pipes were used
- 59. Drainage Material Plant set up at Kota for Corrugated PVC pipes of 80, 100, 160, 200, 294, 355 and 455 mm dia. At Sangli 80-160 mm PVC & HDPE as well as double wall corrugated pipes up to 315 mm are produced Envelope Material
- 60. SSD Installation Excavation of trench Laying of Pipe on the grade Backfilling of the trench Restoration of ROW Manual
- 61. SSD Installation Manual Excavator Grade Control ???????
- 63. SSD Installation Laser Excavator
- 65. SSD Installation Drain Laying Plow
- 66. SSD Installation Drain Laying Plow
- 67. SSD Installation Drain Laying Plow
- 68. SSD Installation Drain Laying Plow
- 71. SSD Installation
- 73. SSD Installation V Plow
- 74. SSD Installation V Plow
- 75. SSD Installation
- 76. SSD Installation
- 77. SSD Installation
- 78. SSD Installation Import of Drain Laying Equipments Right of Way Crop Compensation Irrigation Shut Off
- 79. SSD Installation Physical progress achieved S.No. SSD installation method at RAJAD 1 Manual installation 50 m/day with 20 labours 100 - 150 m/day per 2 Installation using excavator excavator Installed using a trenchless 4000 - 6000 m/day per 3 drain laying plow plow 1000 - 2000 m/day per 4 Installation using a trencher trencher About 2500 km of pipe installed in CCA
- 80. Supervision, Inspection and Quality Control Preparation of Contract Document Specification of Drainage Material & Installation Development of Contractors – national, international
- 81. Human Resources Development •Post Graduation in Drainage Engineering •National & international Drainage Courses •Use of Computers, Total Station, EM 38, GIS etc. •Several workshops, seminars, awareness camps etc. Assistance of International/National Experts and Local/GOR Staff People Participation Subsidy Coordination with State Government Maintenance
- 82. Subsurface Drainage Installation in Chambal Command, Rajasthan Project Area installed Year (ha) Small Test Sites 410 1991-1993 Large Test Sites 1,010 1993-1994 Pre-CON/1 700 1995-1996 (Training Phase) CON/1 10,671 1996-1999 Areas with Patchy 2,134 1997-1999 Salinity Total 14,925 1991-1999
- 83. Pre Monsoon - 93
- 84. Post Monsoon - 93
- 85. Yield 0 q/ha ECe 19.2 dS/m
- 86. Yield 9.45 q/ha ECe 11.3 dS/m
- 87. Yield 12.8 q/ha ECe 10.4 dS/m
- 88. Yield 25.2 q/ha ECe 5.1 dS/m
- 89. Yield 34.1 q/ha ECe 2.7 dS/m
- 90. Yield 43.0 q/ha ECe 2.36 dS/m
- 91. Yield 0 q/ha ECe 19.2 dS/m Yield 9.45 q/ha ECe 11.3 dS/m Yield 12.8 q/ha ECe 10.4 dS/m Yield 25.2 q/ha ECe 5.1 dS/m Yield 34.1 q/ha ECe 2.7 dS/m Yield 43.0 q/ha ECe 2.36 dS/m
- 92. IMPACT OF SUBSURFACE DRAINAGE Soil Salinity Reclamation • Continuous reduction in the salinity in the upper 15 cm depth. • For the lower depths salinity levels increased during first 3 years then salinity levels declined. • Over a period of 5 years, the salinity level reduced to below 4 dS/m • After SSD salinity reclamation could be achieved in 2 to 3 years for about 60% areas & within 3 to 4 years for 90-95% of the affected areas. • About 5-10% of the affected area could take more than 4 years for satisfactory reclamation
- 93. Crop Yield in Saline & Waterlogged areas and non-saline & non-waterlogged areas in the Chambal Command Area of Rajasthan. Crop Crop Yield (Quintals/ha) Saline Non-saline / /waterlogged Non waterlogged Wheat 17.0 34.0 Mustard 6.1 14.7 Paddy 17.0 29.0 Soybean 10.2 21.8 Berseem 360.0 520.0 Sugarcane na 567.5
- 94. Relationship between Soybean Yield and Water table Depth Average Water Soybean Relative Yield Table Depth (cm) Yield (t/ha) (%) 80.0 2.18 100 70.0 1.93 88 59.6 1.69 77 50.0 1.44 66 40.0 1.20 55
- 95. Water Table Control A drainage rate of 1.5 mm/day (an equivalent water table draw down of 20 cm from soil surface in three days) was considered adequate to maintain a favorable salt balance. Field observations since SSD installation in various test sites have indicated that a water table draw down of 20-40 cm in three days is achievable.
- 96. Water Table Control The water table control has an added positive impact in advancing soil trafficability conditions (tilth) by 6-10 days after a rainfall or irrigation event, thereby allowing farmers more time for farming operations Good tilth conditions also provide a further benefit, namely an opportunity to save fuel in machinery operations.
- 97. Crop Performance Increase in Crop Yield The average increase in the crop yield in SSD test sites compared with non-SSD sites was about • 56 percent for soybean and • 55 percent for wheat. Farmers have also reported improvements in the quality and quantity of produce, particularly vegetables.
- 98. Relationship with Soybean Yield, Water Table depth and Soil Salinity The analysis showed that soybean yield was independent of the water table when its depth was greater than 80 cm below ground surface. The yield decreased as the water table depth approached soil surface. The average optimum desirable water table depth during growth season of soybean is 80 cm for the CCA conditions.
- 99. Relationship with Soybean Yield, Water Table depth and Soil Salinity Monitoring at RAJAD indicated that an average water table draw down of 20 – 40 cm within three days was achieved. The majority of the drain flow rates from these sites ranged from 1-4 mm per day. The relationship between soybean yield and soil salinity showed that crop yield is independent of soil salinity, upto a threshold ECe value of 4.1 dS/m. Beyond that, the yield decreases.
- 100. Increase in Cropping Intensity Water table control and salinity reclamation in the test sites significantly alleviated these constraints, which resulted in a 20-25 percent reduction in the amount of fallow land in the Kharif season, and 5-6 percent reduction in fallow during the Rabi season. The pre-SSD cropping intensity was 150- 160 percent and the post – SSD cropping intensity was 170-185 percent. The cropping intensity is projected to further increase.
- 101. POSITIVE IMPACTS OF SUBSURFACE DRAINAGE S.No. Impact Improvement 1. Salinity reclamation I. Soils with EC 4-8 dS/m 2-3 years to achieve II. Soils with EC 8-16dS/m 3-4 years to achieve III. Soils with EC>16 dS/m > 4 years to achieve 2. Water table control 20-40 cm draw down in 3-4 days 3. Soil trafficability Advanced by 6-10 days
- 102. POSITIVE IMPACTS OF SUBSURFACE DRAINAGE S.No. Impact Improvement 4. Crop Yield 56 % increase in soybean; 55 % increase in wheat yields 5. Cropping intensity Increased from 150- 160 percent to 170- 185 percent
- 103. Economics of Subsurface Drainage As per economic and financial analysis of SSD Assuming • capital cost of SSD of RS. 34,250 per ha, • using a discount rate of 12 percent and • assuming that benefits would accrue from the entire SSD installed area, • the economic benefits of SSD for a 30 year life expectancy were calculated as follows. Benefit/cost ratio : 2.6 Net present value (NPV) per ha : Rs.54,900
- 104. The internal rate of return (IRR) = 28 %. This relates to a 2.4 times return over the market rate of interest that a farmer would have to pay, if it was to be fully financed by the farmer. The above analysis indicated that SSD is a cost effective method to reclaim waterlogged and saline lands in the CCA. This system can be replicated in other areas of Rajasthan and India.
- 105. THANK YOU
- 106. Selection of Reclamation Technology
- 107. Selection of Reclamation Technology
- 108. Selection of Reclamation Technology
- 111. Relationship between Soybean yield and Soil Salinity Average ECe (dS/m) Soybean Relative Yield for the 0-30 cm Yield (t/ha) (%) Soil Depth 4.1 1.81 100 6.0 1.60 88 8.0 1.39 77 10.0 1.17 65