Cloud Frontiers: A Deep Dive into Serverless Spatial Data and FME
Linreg
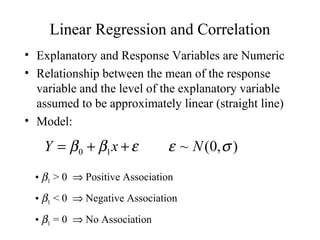
1. Linear Regression and Correlation
• Explanatory and Response Variables are Numeric
• Relationship between the mean of the response
variable and the level of the explanatory variable
assumed to be approximately linear (straight line)
• Model:
Y = β 0 + β1 x + ε ε ~ N (0, σ )
• β1 > 0 ⇒ Positive Association
• β1 < 0 ⇒ Negative Association
• β1 = 0 ⇒ No Association
2. Least Squares Estimation of β0, β1
∀ β0 ≡ Mean response when x=0 (y-intercept)
∀ β1 ≡ Change in mean response when x increases
by 1 unit (slope)
• β0, β1 are unknown parameters (like µ)
• β0+β1x ≡ Mean response when explanatory
variable takes on the value x
• Goal: Choose values (estimates) that minimize the
sum of squared errors (SSE) of observed values to
the straight-line:
2 2
^ ^ ^
^
n ^ ^
SSE = ∑i =1 yi − y i = ∑i =1 yi − β 0 + β 1 xi
n
y = β 0+ β1 x
3. Example - Pharmacodynamics of LSD
• Response (y) - Math score (mean among 5 volunteers)
• Predictor (x) - LSD tissue concentration (mean of 5 volunteers)
• Raw Data and scatterplot of Score vs LSD concentration:
80
70
60
Score (y) LSD Conc (x)
78.93 1.17 50
58.20 2.97
67.47 3.26 40
37.47 4.69
45.65 5.83 30
SCORE
32.92 6.00
20
29.97 6.41 1 2 3 4 5 6 7
LSD_CONC
Source: Wagner, et al (1968)
4. Least Squares Computations
S xx =∑−
x x( ) 2
S xy =∑ − )(y − )
(x x y
∑− )
(y y 2
S yy =
β=
^
∑ − )(y − ) =
(x x y S xy
∑− )
(x x
1 2
S xx
β β
^ ^
0 = − 1 x
y
2
^
∑ −
y y
=SSE
s2 =
n− 2 n−2
6. SPSS Output and Plot of Equation
Coefficientsa
Unstandardized Standardized
Coefficients Coefficients
Model B Std. Error Beta t Sig.
1 (Constant) 89.124 7.048 12.646 .000
LSD_CONC -9.009 1.503 -.937 -5.994 .002
a. Dependent Variable: SCORE
Math Score vs LSD Concentration (SPSS)
80.00
Linear Regression
70.00
60.00
score
50.00
40.00
30.00
score = 89.12 + -9.01 * lsd_conc
1.00 2.00 R-Square = 0.88 5.00
3.00 4.00 6.00
lsd_conc
7. Inference Concerning the Slope (β1)
• Parameter: Slope in the population model (β1)
^
• Estimator: Least squares estimate: β 1
• Estimated standard error: σ β = s / S
^
^
1 xx
• Methods of making inference regarding population:
– Hypothesis tests (2-sided or 1-sided)
– Confidence Intervals
8. Hypothesis Test for β1
• 2-Sided Test • 1-sided Test
– H0: β1 = 0 – H0: β1 = 0
– HA: β1 ≠ 0 – HA+: β1 > 0 or
– HA-: β1 < 0
^
β1 ^
T .S . : tobs = ^ T .S . : tobs =
β1
σ β1 ^ ^
σ β1
^
R.R. : | tobs | ≥ tα / 2,n − 2 R.R.+ : tobs ≥ tα ,n − 2 R.R.− : tobs ≤ − tα ,n − 2
P − val : 2 P(t ≥| tobs |) P − val + : P (t ≥ tobs ) P − val − : P (t ≤ tobs )
9. (1-α)100% Confidence Interval for β1
^ ^ ^ s
β 1 ± tα / 2 σ β 1 ≡ β 1 ± tα / 2
^
S xx
• Conclude positive association if entire interval above 0
• Conclude negative association if entire interval below 0
• Cannot conclude an association if interval contains 0
• Conclusion based on interval is same as 2-sided hypothesis test
10. Example - Pharmacodynamics of LSD
^
n = 7 β 1 = −9.01 s = 50.72 = 7.12 S xx = 22.475
^ 7.12
σ β1 ^
= = 1.50
22.475
• Testing H0: β1 = 0 vs HA: β1 ≠ 0
− 9.01
T .S . : tobs = = −6.01 R.R. :| tobs |≥ t.025,5 = 2.571
1.50
• 95% Confidence Interval for β1 :
− 9.01 ± 2.571(1.50) ≡ − 9.01 ± 3.86 ≡ (−12.87,−5.15)
11. Correlation Coefficient
• Measures the strength of the linear association
between two variables
• Takes on the same sign as the slope estimate from
the linear regression
• Not effected by linear transformations of y or x
• Does not distinguish between dependent and
independent variable (e.g. height and weight)
• Population Parameter - ρ
• Pearson’s Correlation Coefficient:
S xy
r= −1 ≤ r ≤1
S xx S yy
12. Correlation Coefficient
• Values close to 1 in absolute value ⇒ strong
linear association, positive or negative from sign
• Values close to 0 imply little or no association
• If data contain outliers (are non-normal),
Spearman’s coefficient of correlation can be
computed based on the ranks of the x and y values
• Test of H0:ρ = 0 is equivalent to test of H0:β1=0
• Coefficient of Determination (r2) - Proportion of
variation in y “explained” by the regression on x:
S yy − SSE
r = (r ) =
2 2
0 ≤ r2 ≤ 1
S yy
13. Example - Pharmacodynamics of LSD
S xx = 22.475 S xy = −202.487 S yy = 2078.183 SSE = 253.89
− 202.487
r= = −0.94
( 22.475)(2078.183)
2078.183 − 253.89
r = 2
= 0.88 = ( −0.94) 2
2078.183
Syy SSE
80.00 80.00
Mean Linear Regression
70.00
70.00
60.00
60.00
score
score
50.00
50.00
Mean = 50.09
40.00
40.00
30.00
score = 89.12 + -9.01 * lsd_conc
30.00
1.00 2.00 R-Square = 0.88
3.00 4.00 5.00 6.00
1.00 2.00 3.00 4.00 5.00 6.00
lsd_conc
lsd_conc
14. Example - SPSS Output
Pearson’s and Spearman’s Measures
Correlations
SCORE LSD_CONC
SCORE Pearson Correlation 1 -.937**
Sig. (2-tailed) . .002
N 7 7
LSD_CONC Pearson Correlation -.937** 1
Sig. (2-tailed) .002 .
N 7 7
**. Correlation is significant at the 0.01 level (2-tailed).
Correlations
SCORE LSD_CONC
Spearman's rho SCORE Correlation Coefficient 1.000 -.929**
Sig. (2-tailed) . .003
N 7 7
LSD_CONC Correlation Coefficient -.929** 1.000
Sig. (2-tailed) .003 .
N 7 7
**. Correlation is significant at the 0.01 level (2-tailed).
15. Analysis of Variance in Regression
• Goal: Partition the total variation in y into
variation “explained” by x and random variation
^ ^
( yi − y ) = ( yi − y i ) + ( y i − y )
^ 2 ^ 2
∑ ( y − y) = ∑ ( y − y ) + ∑ ( y − y)
2
i i i i
• These three sums of squares and degrees of freedom are:
•Total (Syy) dfTotal = n-1
• Error (SSE) dfError = n-2
• Model (SSR) dfModel = 1
16. Analysis of Variance in Regression
Source of Sum of Degrees of Mean
Variation Squares Freedom Square F
Model SSR 1 MSR = SSR/1 F = MSR/MSE
Error SSE n-2 MSE = SSE/(n-2)
Total Syy n-1
• Analysis of Variance - F-test
• H0: β1 = 0 HA: β1 ≠ 0
MSR
T .S . : Fobs =
MSE
R.R. : Fobs ≥Fα1, n −
, 2
P−val : P ( F ≥Fobs )
17. Example - Pharmacodynamics of LSD
• Total Sum of squares:
S yy = ∑ ( yi − y ) 2 = 2078.183 dfTotal = 7 − 1 = 6
• Error Sum of squares:
^
SSE = ∑ ( yi − y i ) 2 = 253.890 df Error = 7 − 2 = 5
• Model Sum of Squares:
^
SSR = ∑ ( y i − y ) 2 = 2078.183 − 253.890 = 1824.293 df Model = 1
18. Example - Pharmacodynamics of LSD
Source of Sum of Degrees of Mean
Variation Squares Freedom Square F
Model 1824.293 1 1824.293 35.93
Error 253.890 5 50.778
Total 2078.183 6
•Analysis of Variance - F-test
• H0: β1 = 0 HA: β1 ≠ 0
MSR
T .S . : Fobs = = .93
35
MSE
R.R. : Fobs ≥F.05,1, 5 = .61
6
P−val : P ( F ≥ .93)
35
19. Example - SPSS Output
ANOVAb
Sum of
Model Squares df Mean Square F Sig.
1 Regression 1824.302 1 1824.302 35.928 .002a
Residual 253.881 5 50.776
Total 2078.183 6
a. Predictors: (Constant), LSD_CONC
b. Dependent Variable: SCORE
20. Multiple Regression
• Numeric Response variable (Y)
• p Numeric predictor variables
• Model:
Y = β0 + β1x1 + ⋅⋅⋅ + βpxp + ε
• Partial Regression Coefficients: βi ≡ effect (on the
mean response) of increasing the ith predictor
variable by 1 unit, holding all other predictors
constant
21. Example - Effect of Birth weight on
Body Size in Early Adolescence
• Response: Height at Early adolescence (n =250 cases)
• Predictors (p=6 explanatory variables)
• Adolescent Age (x1, in years -- 11-14)
• Tanner stage (x2, units not given)
• Gender (x3=1 if male, 0 if female)
• Gestational age (x4, in weeks at birth)
• Birth length (x5, units not given)
• Birthweight Group (x6=1,...,6 <1500g (1), 1500-
1999g(2), 2000-2499g(3), 2500-2999g(4), 3000-
3499g(5), >3500g(6))
Source: Falkner, et al (2004)
22. Least Squares Estimation
• Population Model for mean response:
E (Y ) = β 0 + β1 x1 + + β p x p
• Least Squares Fitted (predicted) equation, minimizing SSE:
2
^ ^ ^ ^
^
Y = β 0 + β 1 x1 + + β p x p SSE = ∑ Y − Y
• All statistical software packages/spreadsheets can
compute least squares estimates and their standard errors
23. Analysis of Variance
• Direct extension to ANOVA based on simple
linear regression
• Only adjustments are to degrees of freedom:
– dfModel = p dfError = n-p-1
Source of Sum of Degrees of Mean
Variation Squares Freedom Square F
Model SSR p MSR = SSR/p F = MSR/MSE
Error SSE n-p-1 MSE = SSE/(n-p-1)
Total Syy n-1
S yy − SSE SSR
R = 2
=
S yy S yy
24. Testing for the Overall Model - F-test
• Tests whether any of the explanatory variables are
associated with the response
• H0: β1=⋅⋅⋅=βp=0 (None of the xs associated with y)
• HA: Not all βi = 0
MSR R2 / p
T .S . : Fobs = =
MSE (1 − 2 ) /( n −p − )
R 1
R.R. : Fobs ≥Fα p , n −p −
, 1
P−val : P ( F ≥Fobs )
25. Example - Effect of Birth weight on
Body Size in Early Adolescence
• Authors did not print ANOVA, but did provide following:
• n=250 p=6 R2=0.26
• H0: β1=⋅⋅⋅=β6=0
• HA: Not all βi = 0
MSR R2 / p
T .S . : Fobs = = =
MSE (1 −R ) /( n −p − )
2
1
0.26 / 6 .0433
= = = .2
14
(1 − .26) /( 250 − − )
0 6 1 .0030
R.R. : Fobs ≥Fα 6 , 243 =2.13
,
P−val : P ( F ≥ .2)
14
26. Testing Individual Partial Coefficients - t-tests
• Wish to determine whether the response is
associated with a single explanatory variable, after
controlling for the others
• H0: βi = 0 HA: βi ≠ 0 (2-sided alternative)
^
βi
T .S . : t obs = ^
σβ ^
i
R.R. : | t obs | ≥ tα / 2 , n − p −1
P − val : 2 P (t ≥| tobs |)
27. Example - Effect of Birth weight on
Body Size in Early Adolescence
Variable b sb t=b/sb P-val (z)
Adolescent Age 2.86 0.99 2.89 .0038
Tanner Stage 3.41 0.89 3.83 <.001
Male 0.08 1.26 0.06 .9522
Gestational Age -0.11 0.21 -0.52 .6030
Birth Length 0.44 0.19 2.32 .0204
Birth Wt Grp -0.78 0.64 -1.22 .2224
Controlling for all other predictors, adolescent age,
Tanner stage, and Birth length are associated with
adolescent height measurement
28. Models with Dummy Variables
• Some models have both numeric and categorical
explanatory variables (Recall gender in example)
• If a categorical variable has k levels, need to create
k-1 dummy variables that take on the values 1 if
the level of interest is present, 0 otherwise.
• The baseline level of the categorical variable for
which all k-1 dummy variables are set to 0
• The regression coefficient corresponding to a
dummy variable is the difference between the
mean for that level and the mean for baseline
group, controlling for all numeric predictors
29. Example - Deep Cervical Infections
• Subjects - Patients with deep neck infections
• Response (Y) - Length of Stay in hospital
• Predictors: (One numeric, 11 Dichotomous)
– Age (x1)
– Gender (x2=1 if female, 0 if male)
– Fever (x3=1 if Body Temp > 38C, 0 if not)
– Neck swelling (x4=1 if Present, 0 if absent)
– Neck Pain (x5=1 if Present, 0 if absent)
– Trismus (x6=1 if Present, 0 if absent)
– Underlying Disease (x7=1 if Present, 0 if absent)
– Respiration Difficulty (x8=1 if Present, 0 if absent)
– Complication (x9=1 if Present, 0 if absent)
– WBC > 15000/mm3 (x10=1 if Present, 0 if absent)
– CRP > 100µg/ml (x11=1 if Present, 0 if absent)
Source: Wang, et al (2003)
30. Example - Weather and Spinal Patients
• Subjects - Visitors to National Spinal Network in 23 cities
Completing SF-36 Form
• Response - Physical Function subscale (1 of 10 reported)
• Predictors:
– Patient’s age (x1)
– Gender (x2=1 if female, 0 if male)
– High temperature on day of visit (x3)
– Low temperature on day of visit (x4)
– Dew point (x5)
– Wet bulb (x6)
– Total precipitation (x7)
– Barometric Pressure (x7)
– Length of sunlight (x8)
– Moon Phase (new, wax crescent, 1st Qtr, wax gibbous, full moon,
Source: Glaser, et al (2004)
wan gibbous, last Qtr, wan crescent, presumably had 8-1=7
31. Analysis of Covariance
• Combination of 1-Way ANOVA and Linear
Regression
• Goal: Comparing numeric responses among k
groups, adjusting for numeric concomitant
variable(s), referred to as Covariate(s)
• Clinical trial applications: Response is Post-Trt
score, covariate is Pre-Trt score
• Epidemiological applications: Outcomes
compared across exposure conditions, adjusted for
other risk factors (age, smoking status, sex,...)