SlideShare uma empresa Scribd logo
1 de 6
Baixar para ler offline
F

            (5009.TW/5009 TT)
                                                                                                                                       (     )                             (     )
4Q11                                                                      2012                                   100                                                                                             18

                                                                                                                 80     41                                                                                       17
                                                                                                                                   43            46         47        52         52         53            53
NT$31.55                                                                                                         60
                                                                                                                                                                                                                 16

                                                                                                                        21                                                                                       15
                                                                                                                                   25            25         21
                                                                                                                 40                                                   19         20         19            18
                                                                                                                        17                                                                                       14
                                                                                                                                   11            12         14
                                                                                                                 20                                                   13         13         13            13
                                                                                                                         9         11                                                                            13
1                                                     1                                                                 12
                                                                                                                                                  9         10         9          8          8             9
                                                                                                                                   10             8          8         7          7          7             7
                                                                                                                  0                                                                                              12
2     886.2.2181.8727                                 2       886.2.2181.8749
                                                                                                                       1Q11       2Q11       3Q11          4Q11      1Q12F      2Q12F      3Q12F      4Q12F
3     marc@kgisia.com.tw                              3       chienan.lai@kgisia.com.tw


      4Q11
      1Q12                                                                  52%(QoQ+5
                                                                                                                                        7             2Q                         15%
                 )                                   16.5%(QoQ+1                             )
                                          7          2Q12                             15%
                                                                                                                                                                                2~3
                                                                              NT$39
                                                                                                             4                                                          7
                                                                                                                          2Q12                                                  10                             2Q12
                       4Q11
                                                                                                                          30                (QoQ+15%)                                   16.6%
                       4Q11                                                            15.5%
                                                                                                                   3.06        EPS 0.78               (QoQ+28%)
                                  15.4%

                                                                                                                          VAR                         2012            3Q
                     2.95              EPS 0.75
                                                                                                                              2         VAR (                                                )
2.3     EPS 0.59
                                                                                                                                            2012            3Q
                                                                                                                                                                 2      ESR (                                         )
                 4Q11           1Q12
                                          4Q11F                                     1Q12F                                               30%
                             QoQ (%)     YoY (%)                   (%)              QoQ (%)      YoY (%)
                     2,816       (7.4)        33.4   2,816          0.0    2,600         (7.7)       (0.4)
                       436       (4.9)        62.3     434          0.6      429         (1.7)        31.2
                       253       (9.5)      131.7      251          1.1      252         (0.5)        43.6
                        67      (11.1)      570.2       61          8.2       48        (28.1)      (23.8)
                       295         1.5      206.2      229         28.5      239        (19.0)        28.1
         ( )          0.75         1.5      151.7     0.59         28.5     0.61        (19.0)        28.1
       (%)            15.5    0.4 ppts    2.8 ppts    15.4     0.1 ppts     16.5      1.0 ppts    4.0 ppts                                        2011
           (%)         9.0   (0.2)ppts    3.8 ppts      8.9    0.1 ppts       9.7     0.7 ppts    3.0 ppts
       (%)            10.5    0.9 ppts    5.9 ppts      8.1    2.3 ppts       9.2    (1.3)ppts    4.6 ppts


                                                                                                                                                                                           17
                             1Q12                                         52%
                                                                                                                                                                                      2014
        1Q12
52%(QoQ+5                          )                                                 48%
                                                                                                                               2011~2012
                                                                                                                                                      2011F                                      2012F
                                                                                                                                                                         (%)                                       (%)
                                                                                                                                        11,100        11,100             0.0     12,190          12,250            0.5
                                                                                                              EBIT                         892           895             0.3      1,230           1,331            8.3
                                                                   2012                                                                  1,059         1,067             0.7      1,321           1,412            6.9
(150             )                                                                                                                         916           981             7.1      1,143           1,285           12.5
                                                                                                                         ( )              2.34          2.51             7.1       2.91            3.28           12.5
                                                                                                                       (%)                14.3          14.3         0.0 ppts      15.8            16.6        0.8 ppts
                                                                                                                       (%)                 8.0           8.1         0.0 ppts      10.1            10.9        0.8 ppts
                                                                                                                       (%)                 8.3           8.8         0.6 ppts        9.4           10.5        1.1 ppts

                                           1Q12                                      16.5%(
                       15.5%)                                 2.39         EPS0.61


            http://research.kgi.com                                                                          2012      03         26                                                                                  1
f
                                                                                          12 31                                                                      EBITDA
                                                                                                             (        )       (          ) (        )            (         )           (        )                        ( )
                                                                                     2010A                      7,270                 764        247                     794                 247                         0.70
                                                                                     2011F                     11,100               1,592        895                   1,386                 981                         2.51
                                                                                     2012F                     12,250               2,038      1,331                   1,837               1,285                         3.28
                         2012               122.5            (YoY+10.4%)             2013F                     13,580               2,276      1,541                   2,094               1,504                         3.84
                                                                                       12 31                 EV/sales             EV/EBIT EV/EBITDA                                    EV/Inv. C
                  16.6%(YoY+0.8                 )                    12.85                                         (x)                 (x)        (x)                    (x)                  (x)                         (%)
                                                                                     2010A                        2.4               66.5       22.1                    45.3                  1.4                          5.1
(YoY+31%)            EPS 3.28                                                        2011F                        1.6               20.1       12.4                    12.6                  1.3                         16.6
                                                                                     2012F                        1.4               12.5         9.0                     9.6                 1.1                         17.8
2012                                1.62                                             2013F                        1.2               10.8         9.0                     8.2                 1.0                         18.4
                                                                                                                                                         52             ( / ):                                    19.4 - 36.5
           9.42                                 13                                   12                  (                )                     39.0             (          /               ):                      12.4/418
                                                                                           /              (%)                                   23.6                          (            ):                            392
                                                                                                         (percentile, %)                          83                                   (             ):                  393
                                                                                                      -12/11 (%)                                 3.5                           (           ):                             31
                                                                                                    -12/12 (NT$)                                19.5     3                            (             ):                    7.8
                                                                                                            -12/12 (x)                           1.6                           % (3,6,12           )
              2      (       1.8    )      2012        2013                                                                                                                                                    27.5; 62.6; 9.3
                                                                                                       -12/12 (%)                               55.3                           % (3,6,12           )          13.3; 44.7; 17.3
                             19.5                        39      (
NT$34         )                         23.6%


                                                     1Q11A      2Q11A        3Q11A    4Q11F                      1Q12F              2Q12F          3Q12F                 4Q12F                    2011F              2012F
       (NT$          )
                                                     2,610      2,633        3,041    2,816                      2,600              3,000          3,350                 3,300                   11,100            12,250
                                                     2,283       2,263       2,582        2,380                  2,171               2,502             2,787             2,752                     9,507            10,212
                                                      327         370         459           436                   429                  498               563              548                     1,592              2,038
                                                       151           185       179         183                    177                  177              178                175                      698                 706
                                                      176            185      280          253                    252                  321              385                373                     895              1,331
                                                        91            91       105         149                      95                   95               95                   95                   436                 380
                                                       35             40       46           39                     31                   31               31                 31                      160               125
  EBITDA                                              302            317      431          441                    379                  447              512                499                    1,491             1,837
                                                         0             0         0              1                    1                    1                1                    1                     1                   2
                                                        41            35        48             31                   42                   40               50                   43                   155                 175
                                                        22            47        27             34                    5                    5                  5                     5                130                  21
                                                        63            82        75             67                   48                   46               56                   49                   286                 198
                                                        29            21        23             41                   29                   29               29                   29                   114                 117
                                                       29             21       23           41                     29                   29               29                 29                      114               117
                                                      209            246      332          279                    271                  338              412                392                    1,067             1,412
                         (    )                         23            37        42          (16)                    32                   32               32                   32                        85             127
                                                      187            210      290          295                    239                  306              380                361                     981              1,285
                                                         0             0         0              0                    0                    0                  0                     0                      0               0
                                                       187        210          290         295                    239                  306               380              361                       981             1,285
        EPS                                           0.53       0.63         0.85        0.71                    0.69                0.86              1.05              1.00                     2.72              3.60
        EPS                                           0.48       0.53         0.74        0.75                    0.61                0.78              0.97              0.92                     2.51               3.28
       (%)
                                                      12.5        14.1        15.1         15.5                   16.5                 16.6             16.8               16.6                    14.3                16.6
                                                       6.7           7.0       9.2          9.0                    9.7                 10.7             11.5               11.3                     8.1                10.9
  EBITDA Margin                                       11.6        12.0        14.2         15.7                   14.6                 14.9             15.3               15.1                    13.4                15.0
                                                       8.0           9.4      10.9          9.9                   10.4                 11.3             12.3               11.9                     9.6                11.5
                                                       7.1           8.0       9.5         10.5                    9.2                 10.2             11.3               10.9                     8.8                10.5
       (%)
                                                      23.7           0.9      15.5         (7.4)                  (7.7)                15.4             11.7               (1.5)                   52.7                10.4
                                                      21.6        13.2        24.0         (4.9)                  (1.7)                16.1             13.0               (2.7)                  108.5                28.0
                                                      60.5           5.6      51.1         (9.5)                  (0.5)                27.3             20.0               (3.2)                  262.6                48.8
  EBITDA                                              23.8           5.0      36.1          2.5                  (14.2)                18.2             14.4               (2.4)                   87.7                23.2
                                                     118.8        17.5        34.9        (16.0)                  (3.0)                24.7             22.0               (4.7)                  276.7                32.4
                                                      93.8        12.3        38.6          1.5                  (19.0)                28.0             24.3               (5.1)                  297.4                31.0


              http://research.kgi.com                                                2012           03            26                                                                                                       2
F

                  1993                    39                  3.6
                                                                                                                                                                  16.5          16.6         16.8
                                                                                                                                         15.1         15.5
                                                                                                                             14.1
                                                                                                      12.7       12.5


                                                                                                     4Q10        1Q11        2Q11        3Q11     4Q11F           1Q12F         2Q12F       3Q12F


                                                      5%              (2010-2030)
                                                                                             EPS

6.0
                                                                                                                                                                                             0.97
5.0
                                                                                                                                         0.74         0.75                      0.78
4.0
                                                                                                                                                                  0.61
                                                                                                                             0.53
3.0                                                                                                              0.48

2.0                                                                                                  0.30

1.0

0.0                                                                                                  4Q10        1Q11        2Q11        3Q11     4Q11F           1Q12F         2Q12F       3Q12F

               Boeing


                                                                                              40                                                                                                    30
                                                            23              19.5
          34                 42              37                                               35                                                                                                    20

                                                                             28                                                                                                                     10
                                                            32                                30
          29                 17              24                                                                                                                                                     0
                                                                            20.5              25
                                                            20                                                                                                                                      (10)
          19                 21              18
                                                                    45%      17      52.5%    20
                   37%              41%              39%    15                                                                                                                                      (20)
          13                 14              14
                                                            10               15
           5                  6               7                                               15                                                                                                    (30)
          2008               2009           2010           2011             2012F               Mar-11       May-11     Jun-11      Aug-11   Sep-11      Nov-11     Dec-11        Feb-12      Mar-12


          1Q12

                                                                                                                                                                                           3.5x
4,000                                                                                         65
                                                                                                                                                                                                    3.0x
                                                                                              55
3,000                                                                                                                                                                                               2.5x
                                                                                              45
                                                                                                                                                                                                    2.0x
2,000                                                                                         35
                                                                                                                                                                                                    1.5x
                                                                                              25
                                                                                                                                                                                                    1.0x
1,000
                                                                                              15
                                                                                                                                                                                                    0.5x
                                                                                               5
      0
           4Q10       1Q11        2Q11    3Q11     4Q11F   1Q12F    2Q12F    3Q12F                 2007           2008               2009             2010               2011               2012


                 http://research.kgi.com                                                     2012         03      26                                                                                     3
f

  12       31         (           )             2009A       2010A       2011F     2012F     2013F     12      31    (        )         2009A       2010A       2011F       2012F        2013F
                                                9,645      12,630      15,049    16,157    17,788                                      4,167       7,270      11,100     12,250       13,580
                                                2,666       4,914       7,439     8,025     9,174                                       4,153       6,506      9,507      10,212       11,304
                                                   152         195      1,978     2,741     3,471                                           14        764      1,592       2,038        2,276
                                                 1,682       2,772      2,850     2,900     3,100
                                                                                                                                           254        517         698         706          735
                                                   682       1,619      2,129     2,014     2,232
                                                                                                                                         (240)        247        895       1,331        1,541
                                                   150         328        483       370       370
                                                                                                                                           (85)        (86)      (113)       (115)        (116)
                                                6,979       7,716       7,610     8,132     8,614
                                                   792         952      1,107     1,200     1,250                                            0           0          1           2            6
                                                 5,978       6,483      6,213     6,632     7,054                                           85          86        114         117          122
                                                   209         280        290       300       310                                          (95)         96        155         175          192
                                                4,974       7,606       8,264     8,518     9,115                                          (31)         27        130          21           36
                                                2,320       3,503       4,025     4,195     4,520                                            0           0          0           0            0
                                                   236         418        599       644       712                                         (450)       283      1,067       1,412        1,653
                                                 1,712       2,615      2,733     2,786     2,959                                          (90)         36         85         127          149
                                                   372         469        694       766       849                                        (360)        247        981       1,285        1,504
                                                2,655       4,103       4,239     4,323     4,595    EBITDA                                293        794      1,386       1,837        2,094
                                                 2,501       3,964      4,099     4,178     4,439
                                                                                                               (   )                    (1.12)       0.70       2.51        3.28         3.84
                                                   154         139        140       145       156
                                                4,670       5,024       6,785     7,639     8,673
                                                 3,312       3,390      3,920     3,920     3,920
                                                   670         698        948       948       948
                                                   688         935      1,917     2,771     3,804
                                                     0           0          0         0         0
                                                                                                      12      31    (        )         2009A       2010A       2011F      2012F        2013F
                                                                                                                                        2,136      (1,227)       980      1,910        1,598
                                                                                                                                         (360)        247        981      1,285        1,504
                                                                                                                                          533         547        491        505          553
  12       31         (           )             2009A       2010A       2011F     2012F     2013F                                       1,869      (1,925)      (338)       294         (267)
                (% )                                                                                                                       95         (96)      (155)      (175)        (192)
                                                 (59.0)       74.4       52.7      10.4      10.9                                        (878)     (1,188)      (231)      (853)        (843)
                                                   N.A.        N.A.     262.6      48.8      15.7                                        (720)       (935)        (61)     (800)        (850)
EBITDA                                           (75.6)      170.9       74.6      32.5      14.0                                           (4)       (65)          0        82          142
                                                   N.A.        N.A.     297.4      31.0      17.0
                                                                                                                                         (154)       (188)      (170)      (135)        (135)
                                                   N.A.        N.A.     259.5      30.9      17.0
                                                                                                     Free Cash Flow                     1,259      (2,415)       750      1,057          755
                           (%)
                                                   0.3        10.5       14.3      16.6      16.8                                      (1,513)      2,458      1,033       (294)         (25)
                                                  (5.8)        3.4        8.1      10.9      11.3                                         (27)        107        779       (431)        (470)
EBITDA                                             7.0        10.9       12.5      15.0      15.4                                      (1,382)     2,367         252         132            434
                                                  (8.6)        3.4        8.8      10.5      11.1                                        (105)       (16)          1           5             11
                                                  (3.4)        2.2        7.1       8.2       8.9                                        (255)        43       1,783         763            730
                                                  N.A.         5.1       16.6      17.8      18.4
       /
                  (%)                             90.2       131.0      100.7      91.2      85.3
                  (%)                             86.9       127.1       71.5      55.3      45.3
                          (X)                      (4.3)        4.3      10.4      13.0      14.5
                                          (X)      (0.2)        0.1        0.4       0.5       0.6   ROIC                (Return on Invested Capital)
Cash Flow Int. Coverage (X)                       25.2       (14.2)        8.6     16.3      13.1     12 31        1-              +                   +                     =
Cash Flow/Int. & ST Debt (X)                        1.2        (0.5)       0.3       0.7      0.5
                (X)                                 1.1         1.4        1.8       1.9       2.0   2009A               86.9%             12.8%                6.1%                 (5.8%)
                (X)                                 0.4         0.6        1.1       1.2       1.3   2010A               82.0%             7.5%                 7.1%                  3.4%
           (NT$              )                   4,624       5,222      5,619     4,538     4,075    2011F               81.2%             4.4%                 6.3%                  8.1%
                           (NT$       )                                                              2012F               79.2%             4.1%                 5.8%                 10.9%
                                                                                                     2013F               79.2%             4.1%                 5.4%                 11.3%
                                                 (1.12)       0.70       2.51      3.28      3.84
                                                  0.54        2.24       3.76      4.57      5.25     12 31        1/              +                   +                     =
                                                 14.50       14.17      17.31     19.49     22.13
                                                                                                     2009A                   0.5            1.4                  0.1                  0.5
                                                 12.94       20.51      28.32     31.25     34.64    2010A                   0.6            0.9                  0.0                  0.7
EBITDA/shr                                       (0.75)       0.70       2.28      3.40      3.93    2011F                   0.4            0.6                  0.0                  1.0
                                                   N.D.        N.D.      1.10      1.20      1.30    2012F                   0.4            0.5                  0.0                  1.1
                                                                                                     2013F                   0.4            0.5                  0.0                  1.1
                  (X)                              0.4         0.7        0.8       0.8       0.8     12 31                        x                   x 1-                  =          ROIC
                                                  59.7        81.3       70.0      60.0      60.0    2009A               (5.8%)             0.5                 80.0%                (2.3%)
                                                 147.3       139.2       93.7      86.4      83.3    2010A                3.4%              0.7                 87.2%                 2.0%
                                                  20.6        21.0       19.7      19.2      19.1    2011F                8.1%              1.0                 92.0%                 7.3%
                                                 186.4       199.5      144.0     127.2     124.2    2012F               10.9%              1.1                 91.0%                10.6%
                                                                                                     2013F               11.3%              1.1                 91.0%                11.5%


                          http://research.kgi.com                                                    2012      03       26                                                                     4
f
                              歷


45
40
35
30
25
20
15
10
 Mar-09        Jun-09     Sep-09      Dec-09    Mar-10   Jun-10   Sep-10     Dec-10        Mar-11   Jun-11   Sep-11   Dec-11   Mar-12


                              歷


                                        (   )
26-Mar-12                             31.55                                                                  34.0                39.0
15-Mar-12                             27.65                                                                  N.A.                34.0


            http://research.kgi.com                                   2012    03      26                                            5
100                     A    1907-1909                 104                 700
                                 200051                                                             886.2.2181.8888
                                                                                                    886.2.8501.1691


                                                   2014                 A     24D1
                                 518008


                          852.2878.6888                                                      8th - 11th floors, Asia Centre Building
                          852.2878.6800                                                      173 South Sathorn Road, Bangkok 10120, Thailand
                                                                                                    66.2658.8888
                                                                                                    66.2658.8014


                                (OP)                                                                (Excessive Return)
                                                          (        )                         40%
                          (N)                                                                                                          (   )
                                                                  40%        40%
                                (U)                                                                                                    (   )
                                                                  40%
                            (NR)
                                            (R )                                         /


                                                    *             =(                 /         )–1


http://research.kgi.com                                                     2012   03          26                                              6

Mais conteúdo relacionado

Mais procurados

Geom1-2hour3
Geom1-2hour3Geom1-2hour3
Geom1-2hour3kquarton
 
Assessing color reproduction tolerances in commercial print workflow
Assessing color reproduction tolerances in commercial print workflowAssessing color reproduction tolerances in commercial print workflow
Assessing color reproduction tolerances in commercial print workflowGiordano Beretta
 
Cloudcomputingdsp ip-100123124450-phpapp02
Cloudcomputingdsp ip-100123124450-phpapp02Cloudcomputingdsp ip-100123124450-phpapp02
Cloudcomputingdsp ip-100123124450-phpapp02Lamouchi Bassem
 
It's an A.R.M.'s Race (Acquisition, Retention and Monetization in Mobile Gaming)
It's an A.R.M.'s Race (Acquisition, Retention and Monetization in Mobile Gaming)It's an A.R.M.'s Race (Acquisition, Retention and Monetization in Mobile Gaming)
It's an A.R.M.'s Race (Acquisition, Retention and Monetization in Mobile Gaming)Betable
 
FPSO: Perspectives from the equity market
FPSO: Perspectives from the equity marketFPSO: Perspectives from the equity market
FPSO: Perspectives from the equity marketFPSO Network
 
Earnings deck 4_q12
Earnings deck 4_q12Earnings deck 4_q12
Earnings deck 4_q12Andy Solty
 
Attention flow by tagging prediction
Attention flow by tagging predictionAttention flow by tagging prediction
Attention flow by tagging predictionYONG ZHENG
 
Mlb graphs slide deck
Mlb graphs slide deckMlb graphs slide deck
Mlb graphs slide deckKevin Teh
 
2059 2012 04_16_c_tw
2059 2012 04_16_c_tw2059 2012 04_16_c_tw
2059 2012 04_16_c_twyo9889
 
Day 9 proportional relationships
Day 9 proportional relationshipsDay 9 proportional relationships
Day 9 proportional relationshipsErik Tjersland
 
Think Like A Search Engine and Win - September 2011
Think Like A Search Engine and Win - September 2011Think Like A Search Engine and Win - September 2011
Think Like A Search Engine and Win - September 2011WriterAccess
 
Think Like a Search Engine and Win
Think Like a Search Engine and WinThink Like a Search Engine and Win
Think Like a Search Engine and WinWriterAccess
 
adc converter basics
adc converter basicsadc converter basics
adc converter basicshacker1500
 
Citrix - Alternative For Server Virtualistion
Citrix - Alternative For Server VirtualistionCitrix - Alternative For Server Virtualistion
Citrix - Alternative For Server Virtualistiondataplex systems limited
 
Engagement Metrics Nov 2011
Engagement Metrics Nov 2011Engagement Metrics Nov 2011
Engagement Metrics Nov 2011Absolute Radio
 

Mais procurados (20)

Alt picketude
Alt picketudeAlt picketude
Alt picketude
 
Geom1-2hour3
Geom1-2hour3Geom1-2hour3
Geom1-2hour3
 
Assessing color reproduction tolerances in commercial print workflow
Assessing color reproduction tolerances in commercial print workflowAssessing color reproduction tolerances in commercial print workflow
Assessing color reproduction tolerances in commercial print workflow
 
Cloudcomputingdsp ip-100123124450-phpapp02
Cloudcomputingdsp ip-100123124450-phpapp02Cloudcomputingdsp ip-100123124450-phpapp02
Cloudcomputingdsp ip-100123124450-phpapp02
 
It's an A.R.M.'s Race (Acquisition, Retention and Monetization in Mobile Gaming)
It's an A.R.M.'s Race (Acquisition, Retention and Monetization in Mobile Gaming)It's an A.R.M.'s Race (Acquisition, Retention and Monetization in Mobile Gaming)
It's an A.R.M.'s Race (Acquisition, Retention and Monetization in Mobile Gaming)
 
FPSO: Perspectives from the equity market
FPSO: Perspectives from the equity marketFPSO: Perspectives from the equity market
FPSO: Perspectives from the equity market
 
Earnings deck 4_q12
Earnings deck 4_q12Earnings deck 4_q12
Earnings deck 4_q12
 
Attention flow by tagging prediction
Attention flow by tagging predictionAttention flow by tagging prediction
Attention flow by tagging prediction
 
Hotel Tower Project . Emre Ergin
Hotel Tower Project . Emre ErginHotel Tower Project . Emre Ergin
Hotel Tower Project . Emre Ergin
 
Mlb graphs slide deck
Mlb graphs slide deckMlb graphs slide deck
Mlb graphs slide deck
 
2059 2012 04_16_c_tw
2059 2012 04_16_c_tw2059 2012 04_16_c_tw
2059 2012 04_16_c_tw
 
Day 9 proportional relationships
Day 9 proportional relationshipsDay 9 proportional relationships
Day 9 proportional relationships
 
Think Like A Search Engine and Win - September 2011
Think Like A Search Engine and Win - September 2011Think Like A Search Engine and Win - September 2011
Think Like A Search Engine and Win - September 2011
 
Think Like a Search Engine and Win
Think Like a Search Engine and WinThink Like a Search Engine and Win
Think Like a Search Engine and Win
 
adc converter basics
adc converter basicsadc converter basics
adc converter basics
 
Citrix - Alternative For Server Virtualistion
Citrix - Alternative For Server VirtualistionCitrix - Alternative For Server Virtualistion
Citrix - Alternative For Server Virtualistion
 
The Japanese Wine Regulatory System 2011
The Japanese Wine Regulatory System 2011The Japanese Wine Regulatory System 2011
The Japanese Wine Regulatory System 2011
 
Giant blob eso
Giant blob esoGiant blob eso
Giant blob eso
 
Alan Bridle, Bank of Ireland head of Economics and Research
Alan Bridle, Bank of Ireland head of Economics and ResearchAlan Bridle, Bank of Ireland head of Economics and Research
Alan Bridle, Bank of Ireland head of Economics and Research
 
Engagement Metrics Nov 2011
Engagement Metrics Nov 2011Engagement Metrics Nov 2011
Engagement Metrics Nov 2011
 

Semelhante a 5009

Election Update Women in Ohio Politics, 2008.ppt
Election Update Women in Ohio Politics, 2008.pptElection Update Women in Ohio Politics, 2008.ppt
Election Update Women in Ohio Politics, 2008.pptJulie Graber
 
ScienceShare.co.uk Shared Resource
ScienceShare.co.uk Shared ResourceScienceShare.co.uk Shared Resource
ScienceShare.co.uk Shared ResourceScienceShare.co.uk
 
Academy Pt I W Guard
Academy Pt I W  GuardAcademy Pt I W  Guard
Academy Pt I W Guardguest7cc3e6
 
Mister Maker Animal Mask A4 Template Sheet
Mister Maker Animal Mask A4 Template SheetMister Maker Animal Mask A4 Template Sheet
Mister Maker Animal Mask A4 Template SheetCastle Hill Crafts
 
Александр Аузан. Сессия: «Человеческий капитал и городская среда: социокульту...
Александр Аузан. Сессия: «Человеческий капитал и городская среда: социокульту...Александр Аузан. Сессия: «Человеческий капитал и городская среда: социокульту...
Александр Аузан. Сессия: «Человеческий капитал и городская среда: социокульту...Moscow Urban Forum
 
CS Unitec Electric Magnetic Drills Schematic: AutoMAB 2000
CS Unitec Electric Magnetic Drills Schematic: AutoMAB 2000CS Unitec Electric Magnetic Drills Schematic: AutoMAB 2000
CS Unitec Electric Magnetic Drills Schematic: AutoMAB 2000CS Unitec
 
FPSO-sector: Perspectives from the equity
FPSO-sector: Perspectives from the equityFPSO-sector: Perspectives from the equity
FPSO-sector: Perspectives from the equityIQPC
 
Mental test
Mental testMental test
Mental testRsaif1
 
Observation results template
Observation results templateObservation results template
Observation results templatem55mick
 
Observation results template
Observation results templateObservation results template
Observation results templatem55mick
 
Layout l01 eng_a3
Layout l01 eng_a3Layout l01 eng_a3
Layout l01 eng_a3kmaa
 
Dr. Elwynn Taylor - Weather Outlook
Dr. Elwynn Taylor - Weather OutlookDr. Elwynn Taylor - Weather Outlook
Dr. Elwynn Taylor - Weather OutlookJohn Blue
 

Semelhante a 5009 (20)

Election Update Women in Ohio Politics, 2008.ppt
Election Update Women in Ohio Politics, 2008.pptElection Update Women in Ohio Politics, 2008.ppt
Election Update Women in Ohio Politics, 2008.ppt
 
ScienceShare.co.uk Shared Resource
ScienceShare.co.uk Shared ResourceScienceShare.co.uk Shared Resource
ScienceShare.co.uk Shared Resource
 
Academy Pt I W Guard
Academy Pt I W  GuardAcademy Pt I W  Guard
Academy Pt I W Guard
 
Mister Maker Animal Mask A4 Template Sheet
Mister Maker Animal Mask A4 Template SheetMister Maker Animal Mask A4 Template Sheet
Mister Maker Animal Mask A4 Template Sheet
 
Александр Аузан. Сессия: «Человеческий капитал и городская среда: социокульту...
Александр Аузан. Сессия: «Человеческий капитал и городская среда: социокульту...Александр Аузан. Сессия: «Человеческий капитал и городская среда: социокульту...
Александр Аузан. Сессия: «Человеческий капитал и городская среда: социокульту...
 
Mononoke
MononokeMononoke
Mononoke
 
Time Line
Time LineTime Line
Time Line
 
CS Unitec Electric Magnetic Drills Schematic: AutoMAB 2000
CS Unitec Electric Magnetic Drills Schematic: AutoMAB 2000CS Unitec Electric Magnetic Drills Schematic: AutoMAB 2000
CS Unitec Electric Magnetic Drills Schematic: AutoMAB 2000
 
FPSO-sector: Perspectives from the equity
FPSO-sector: Perspectives from the equityFPSO-sector: Perspectives from the equity
FPSO-sector: Perspectives from the equity
 
Mental test
Mental testMental test
Mental test
 
Observation results template
Observation results templateObservation results template
Observation results template
 
Observation results template
Observation results templateObservation results template
Observation results template
 
Sony Nominations 2012
Sony Nominations 2012Sony Nominations 2012
Sony Nominations 2012
 
Projeto
ProjetoProjeto
Projeto
 
Layout l01 eng_a3
Layout l01 eng_a3Layout l01 eng_a3
Layout l01 eng_a3
 
Greedy embedding problem
Greedy embedding problemGreedy embedding problem
Greedy embedding problem
 
Dr. Elwynn Taylor - Weather Outlook
Dr. Elwynn Taylor - Weather OutlookDr. Elwynn Taylor - Weather Outlook
Dr. Elwynn Taylor - Weather Outlook
 
L
LL
L
 
G chords forward roll
G chords forward rollG chords forward roll
G chords forward roll
 
Sailing Days Log
Sailing Days LogSailing Days Log
Sailing Days Log
 

Mais de yo9889

第七章 自營商一日大戶的由來
第七章 自營商一日大戶的由來第七章 自營商一日大戶的由來
第七章 自營商一日大戶的由來yo9889
 
逆境求勝的國內基金經理人1
逆境求勝的國內基金經理人1逆境求勝的國內基金經理人1
逆境求勝的國內基金經理人1yo9889
 
第三章 逆境求勝的國內基金經理人1
第三章 逆境求勝的國內基金經理人1第三章 逆境求勝的國內基金經理人1
第三章 逆境求勝的國內基金經理人1yo9889
 
Macquarie 4938
Macquarie  4938Macquarie  4938
Macquarie 4938yo9889
 
Macquarie 4938
Macquarie  4938Macquarie  4938
Macquarie 4938yo9889
 
2436偉詮電
2436偉詮電2436偉詮電
2436偉詮電yo9889
 
4906 1
4906 14906 1
4906 1yo9889
 
4906 2
4906 24906 2
4906 2yo9889
 
3596智易
3596智易3596智易
3596智易yo9889
 

Mais de yo9889 (20)

第七章 自營商一日大戶的由來
第七章 自營商一日大戶的由來第七章 自營商一日大戶的由來
第七章 自營商一日大戶的由來
 
逆境求勝的國內基金經理人1
逆境求勝的國內基金經理人1逆境求勝的國內基金經理人1
逆境求勝的國內基金經理人1
 
第三章 逆境求勝的國內基金經理人1
第三章 逆境求勝的國內基金經理人1第三章 逆境求勝的國內基金經理人1
第三章 逆境求勝的國內基金經理人1
 
2360
23602360
2360
 
1531
15311531
1531
 
2006
20062006
2006
 
5388
53885388
5388
 
6195
61956195
6195
 
4915
49154915
4915
 
3474
34743474
3474
 
1560
15601560
1560
 
3552
35523552
3552
 
Macquarie 4938
Macquarie  4938Macquarie  4938
Macquarie 4938
 
Macquarie 4938
Macquarie  4938Macquarie  4938
Macquarie 4938
 
2436偉詮電
2436偉詮電2436偉詮電
2436偉詮電
 
4906 1
4906 14906 1
4906 1
 
4906 2
4906 24906 2
4906 2
 
4906
49064906
4906
 
3596智易
3596智易3596智易
3596智易
 
3596
35963596
3596
 

Último

Bajaj Allianz Life Insurance Company - Insurer Innovation Award 2024
Bajaj Allianz Life Insurance Company - Insurer Innovation Award 2024Bajaj Allianz Life Insurance Company - Insurer Innovation Award 2024
Bajaj Allianz Life Insurance Company - Insurer Innovation Award 2024The Digital Insurer
 
Apidays Singapore 2024 - Building Digital Trust in a Digital Economy by Veron...
Apidays Singapore 2024 - Building Digital Trust in a Digital Economy by Veron...Apidays Singapore 2024 - Building Digital Trust in a Digital Economy by Veron...
Apidays Singapore 2024 - Building Digital Trust in a Digital Economy by Veron...apidays
 
2024: Domino Containers - The Next Step. News from the Domino Container commu...
2024: Domino Containers - The Next Step. News from the Domino Container commu...2024: Domino Containers - The Next Step. News from the Domino Container commu...
2024: Domino Containers - The Next Step. News from the Domino Container commu...Martijn de Jong
 
Cloud Frontiers: A Deep Dive into Serverless Spatial Data and FME
Cloud Frontiers:  A Deep Dive into Serverless Spatial Data and FMECloud Frontiers:  A Deep Dive into Serverless Spatial Data and FME
Cloud Frontiers: A Deep Dive into Serverless Spatial Data and FMESafe Software
 
Manulife - Insurer Innovation Award 2024
Manulife - Insurer Innovation Award 2024Manulife - Insurer Innovation Award 2024
Manulife - Insurer Innovation Award 2024The Digital Insurer
 
Bajaj Allianz Life Insurance Company - Insurer Innovation Award 2024
Bajaj Allianz Life Insurance Company - Insurer Innovation Award 2024Bajaj Allianz Life Insurance Company - Insurer Innovation Award 2024
Bajaj Allianz Life Insurance Company - Insurer Innovation Award 2024The Digital Insurer
 
Strategies for Landing an Oracle DBA Job as a Fresher
Strategies for Landing an Oracle DBA Job as a FresherStrategies for Landing an Oracle DBA Job as a Fresher
Strategies for Landing an Oracle DBA Job as a FresherRemote DBA Services
 
Tata AIG General Insurance Company - Insurer Innovation Award 2024
Tata AIG General Insurance Company - Insurer Innovation Award 2024Tata AIG General Insurance Company - Insurer Innovation Award 2024
Tata AIG General Insurance Company - Insurer Innovation Award 2024The Digital Insurer
 
A Year of the Servo Reboot: Where Are We Now?
A Year of the Servo Reboot: Where Are We Now?A Year of the Servo Reboot: Where Are We Now?
A Year of the Servo Reboot: Where Are We Now?Igalia
 
Why Teams call analytics are critical to your entire business
Why Teams call analytics are critical to your entire businessWhy Teams call analytics are critical to your entire business
Why Teams call analytics are critical to your entire businesspanagenda
 
Apidays New York 2024 - The value of a flexible API Management solution for O...
Apidays New York 2024 - The value of a flexible API Management solution for O...Apidays New York 2024 - The value of a flexible API Management solution for O...
Apidays New York 2024 - The value of a flexible API Management solution for O...apidays
 
Repurposing LNG terminals for Hydrogen Ammonia: Feasibility and Cost Saving
Repurposing LNG terminals for Hydrogen Ammonia: Feasibility and Cost SavingRepurposing LNG terminals for Hydrogen Ammonia: Feasibility and Cost Saving
Repurposing LNG terminals for Hydrogen Ammonia: Feasibility and Cost SavingEdi Saputra
 
Top 5 Benefits OF Using Muvi Live Paywall For Live Streams
Top 5 Benefits OF Using Muvi Live Paywall For Live StreamsTop 5 Benefits OF Using Muvi Live Paywall For Live Streams
Top 5 Benefits OF Using Muvi Live Paywall For Live StreamsRoshan Dwivedi
 
Connector Corner: Accelerate revenue generation using UiPath API-centric busi...
Connector Corner: Accelerate revenue generation using UiPath API-centric busi...Connector Corner: Accelerate revenue generation using UiPath API-centric busi...
Connector Corner: Accelerate revenue generation using UiPath API-centric busi...DianaGray10
 
Deploy with confidence: VMware Cloud Foundation 5.1 on next gen Dell PowerEdg...
Deploy with confidence: VMware Cloud Foundation 5.1 on next gen Dell PowerEdg...Deploy with confidence: VMware Cloud Foundation 5.1 on next gen Dell PowerEdg...
Deploy with confidence: VMware Cloud Foundation 5.1 on next gen Dell PowerEdg...Principled Technologies
 
From Event to Action: Accelerate Your Decision Making with Real-Time Automation
From Event to Action: Accelerate Your Decision Making with Real-Time AutomationFrom Event to Action: Accelerate Your Decision Making with Real-Time Automation
From Event to Action: Accelerate Your Decision Making with Real-Time AutomationSafe Software
 
Apidays New York 2024 - Scaling API-first by Ian Reasor and Radu Cotescu, Adobe
Apidays New York 2024 - Scaling API-first by Ian Reasor and Radu Cotescu, AdobeApidays New York 2024 - Scaling API-first by Ian Reasor and Radu Cotescu, Adobe
Apidays New York 2024 - Scaling API-first by Ian Reasor and Radu Cotescu, Adobeapidays
 
Partners Life - Insurer Innovation Award 2024
Partners Life - Insurer Innovation Award 2024Partners Life - Insurer Innovation Award 2024
Partners Life - Insurer Innovation Award 2024The Digital Insurer
 
Polkadot JAM Slides - Token2049 - By Dr. Gavin Wood
Polkadot JAM Slides - Token2049 - By Dr. Gavin WoodPolkadot JAM Slides - Token2049 - By Dr. Gavin Wood
Polkadot JAM Slides - Token2049 - By Dr. Gavin WoodJuan lago vázquez
 
TrustArc Webinar - Stay Ahead of US State Data Privacy Law Developments
TrustArc Webinar - Stay Ahead of US State Data Privacy Law DevelopmentsTrustArc Webinar - Stay Ahead of US State Data Privacy Law Developments
TrustArc Webinar - Stay Ahead of US State Data Privacy Law DevelopmentsTrustArc
 

Último (20)

Bajaj Allianz Life Insurance Company - Insurer Innovation Award 2024
Bajaj Allianz Life Insurance Company - Insurer Innovation Award 2024Bajaj Allianz Life Insurance Company - Insurer Innovation Award 2024
Bajaj Allianz Life Insurance Company - Insurer Innovation Award 2024
 
Apidays Singapore 2024 - Building Digital Trust in a Digital Economy by Veron...
Apidays Singapore 2024 - Building Digital Trust in a Digital Economy by Veron...Apidays Singapore 2024 - Building Digital Trust in a Digital Economy by Veron...
Apidays Singapore 2024 - Building Digital Trust in a Digital Economy by Veron...
 
2024: Domino Containers - The Next Step. News from the Domino Container commu...
2024: Domino Containers - The Next Step. News from the Domino Container commu...2024: Domino Containers - The Next Step. News from the Domino Container commu...
2024: Domino Containers - The Next Step. News from the Domino Container commu...
 
Cloud Frontiers: A Deep Dive into Serverless Spatial Data and FME
Cloud Frontiers:  A Deep Dive into Serverless Spatial Data and FMECloud Frontiers:  A Deep Dive into Serverless Spatial Data and FME
Cloud Frontiers: A Deep Dive into Serverless Spatial Data and FME
 
Manulife - Insurer Innovation Award 2024
Manulife - Insurer Innovation Award 2024Manulife - Insurer Innovation Award 2024
Manulife - Insurer Innovation Award 2024
 
Bajaj Allianz Life Insurance Company - Insurer Innovation Award 2024
Bajaj Allianz Life Insurance Company - Insurer Innovation Award 2024Bajaj Allianz Life Insurance Company - Insurer Innovation Award 2024
Bajaj Allianz Life Insurance Company - Insurer Innovation Award 2024
 
Strategies for Landing an Oracle DBA Job as a Fresher
Strategies for Landing an Oracle DBA Job as a FresherStrategies for Landing an Oracle DBA Job as a Fresher
Strategies for Landing an Oracle DBA Job as a Fresher
 
Tata AIG General Insurance Company - Insurer Innovation Award 2024
Tata AIG General Insurance Company - Insurer Innovation Award 2024Tata AIG General Insurance Company - Insurer Innovation Award 2024
Tata AIG General Insurance Company - Insurer Innovation Award 2024
 
A Year of the Servo Reboot: Where Are We Now?
A Year of the Servo Reboot: Where Are We Now?A Year of the Servo Reboot: Where Are We Now?
A Year of the Servo Reboot: Where Are We Now?
 
Why Teams call analytics are critical to your entire business
Why Teams call analytics are critical to your entire businessWhy Teams call analytics are critical to your entire business
Why Teams call analytics are critical to your entire business
 
Apidays New York 2024 - The value of a flexible API Management solution for O...
Apidays New York 2024 - The value of a flexible API Management solution for O...Apidays New York 2024 - The value of a flexible API Management solution for O...
Apidays New York 2024 - The value of a flexible API Management solution for O...
 
Repurposing LNG terminals for Hydrogen Ammonia: Feasibility and Cost Saving
Repurposing LNG terminals for Hydrogen Ammonia: Feasibility and Cost SavingRepurposing LNG terminals for Hydrogen Ammonia: Feasibility and Cost Saving
Repurposing LNG terminals for Hydrogen Ammonia: Feasibility and Cost Saving
 
Top 5 Benefits OF Using Muvi Live Paywall For Live Streams
Top 5 Benefits OF Using Muvi Live Paywall For Live StreamsTop 5 Benefits OF Using Muvi Live Paywall For Live Streams
Top 5 Benefits OF Using Muvi Live Paywall For Live Streams
 
Connector Corner: Accelerate revenue generation using UiPath API-centric busi...
Connector Corner: Accelerate revenue generation using UiPath API-centric busi...Connector Corner: Accelerate revenue generation using UiPath API-centric busi...
Connector Corner: Accelerate revenue generation using UiPath API-centric busi...
 
Deploy with confidence: VMware Cloud Foundation 5.1 on next gen Dell PowerEdg...
Deploy with confidence: VMware Cloud Foundation 5.1 on next gen Dell PowerEdg...Deploy with confidence: VMware Cloud Foundation 5.1 on next gen Dell PowerEdg...
Deploy with confidence: VMware Cloud Foundation 5.1 on next gen Dell PowerEdg...
 
From Event to Action: Accelerate Your Decision Making with Real-Time Automation
From Event to Action: Accelerate Your Decision Making with Real-Time AutomationFrom Event to Action: Accelerate Your Decision Making with Real-Time Automation
From Event to Action: Accelerate Your Decision Making with Real-Time Automation
 
Apidays New York 2024 - Scaling API-first by Ian Reasor and Radu Cotescu, Adobe
Apidays New York 2024 - Scaling API-first by Ian Reasor and Radu Cotescu, AdobeApidays New York 2024 - Scaling API-first by Ian Reasor and Radu Cotescu, Adobe
Apidays New York 2024 - Scaling API-first by Ian Reasor and Radu Cotescu, Adobe
 
Partners Life - Insurer Innovation Award 2024
Partners Life - Insurer Innovation Award 2024Partners Life - Insurer Innovation Award 2024
Partners Life - Insurer Innovation Award 2024
 
Polkadot JAM Slides - Token2049 - By Dr. Gavin Wood
Polkadot JAM Slides - Token2049 - By Dr. Gavin WoodPolkadot JAM Slides - Token2049 - By Dr. Gavin Wood
Polkadot JAM Slides - Token2049 - By Dr. Gavin Wood
 
TrustArc Webinar - Stay Ahead of US State Data Privacy Law Developments
TrustArc Webinar - Stay Ahead of US State Data Privacy Law DevelopmentsTrustArc Webinar - Stay Ahead of US State Data Privacy Law Developments
TrustArc Webinar - Stay Ahead of US State Data Privacy Law Developments
 

5009

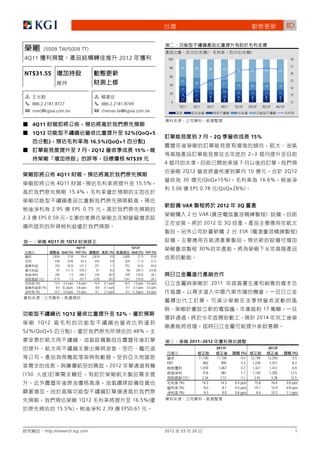
  • 1. F (5009.TW/5009 TT) ( ) ( ) 4Q11 2012 100 18 80 41 17 43 46 47 52 52 53 53 NT$31.55 60 16 21 15 25 25 21 40 19 20 19 18 17 14 11 12 14 20 13 13 13 13 9 11 13 1 1 12 9 10 9 8 8 9 10 8 8 7 7 7 7 0 12 2 886.2.2181.8727 2 886.2.2181.8749 1Q11 2Q11 3Q11 4Q11 1Q12F 2Q12F 3Q12F 4Q12F 3 marc@kgisia.com.tw 3 chienan.lai@kgisia.com.tw 4Q11 1Q12 52%(QoQ+5 7 2Q 15% ) 16.5%(QoQ+1 ) 7 2Q12 15% 2~3 NT$39 4 7 2Q12 10 2Q12 4Q11 30 (QoQ+15%) 16.6% 4Q11 15.5% 3.06 EPS 0.78 (QoQ+28%) 15.4% VAR 2012 3Q 2.95 EPS 0.75 2 VAR ( ) 2.3 EPS 0.59 2012 3Q 2 ESR ( ) 4Q11 1Q12 4Q11F 1Q12F 30% QoQ (%) YoY (%) (%) QoQ (%) YoY (%) 2,816 (7.4) 33.4 2,816 0.0 2,600 (7.7) (0.4) 436 (4.9) 62.3 434 0.6 429 (1.7) 31.2 253 (9.5) 131.7 251 1.1 252 (0.5) 43.6 67 (11.1) 570.2 61 8.2 48 (28.1) (23.8) 295 1.5 206.2 229 28.5 239 (19.0) 28.1 ( ) 0.75 1.5 151.7 0.59 28.5 0.61 (19.0) 28.1 (%) 15.5 0.4 ppts 2.8 ppts 15.4 0.1 ppts 16.5 1.0 ppts 4.0 ppts 2011 (%) 9.0 (0.2)ppts 3.8 ppts 8.9 0.1 ppts 9.7 0.7 ppts 3.0 ppts (%) 10.5 0.9 ppts 5.9 ppts 8.1 2.3 ppts 9.2 (1.3)ppts 4.6 ppts 17 1Q12 52% 2014 1Q12 52%(QoQ+5 ) 48% 2011~2012 2011F 2012F (%) (%) 11,100 11,100 0.0 12,190 12,250 0.5 EBIT 892 895 0.3 1,230 1,331 8.3 2012 1,059 1,067 0.7 1,321 1,412 6.9 (150 ) 916 981 7.1 1,143 1,285 12.5 ( ) 2.34 2.51 7.1 2.91 3.28 12.5 (%) 14.3 14.3 0.0 ppts 15.8 16.6 0.8 ppts (%) 8.0 8.1 0.0 ppts 10.1 10.9 0.8 ppts (%) 8.3 8.8 0.6 ppts 9.4 10.5 1.1 ppts 1Q12 16.5%( 15.5%) 2.39 EPS0.61 http://research.kgi.com 2012 03 26 1
  • 2. f 12 31 EBITDA ( ) ( ) ( ) ( ) ( ) ( ) 2010A 7,270 764 247 794 247 0.70 2011F 11,100 1,592 895 1,386 981 2.51 2012F 12,250 2,038 1,331 1,837 1,285 3.28 2012 122.5 (YoY+10.4%) 2013F 13,580 2,276 1,541 2,094 1,504 3.84 12 31 EV/sales EV/EBIT EV/EBITDA EV/Inv. C 16.6%(YoY+0.8 ) 12.85 (x) (x) (x) (x) (x) (%) 2010A 2.4 66.5 22.1 45.3 1.4 5.1 (YoY+31%) EPS 3.28 2011F 1.6 20.1 12.4 12.6 1.3 16.6 2012F 1.4 12.5 9.0 9.6 1.1 17.8 2012 1.62 2013F 1.2 10.8 9.0 8.2 1.0 18.4 52 ( / ): 19.4 - 36.5 9.42 13 12 ( ) 39.0 ( / ): 12.4/418 / (%) 23.6 ( ): 392 (percentile, %) 83 ( ): 393 -12/11 (%) 3.5 ( ): 31 -12/12 (NT$) 19.5 3 ( ): 7.8 -12/12 (x) 1.6 % (3,6,12 ) 2 ( 1.8 ) 2012 2013 27.5; 62.6; 9.3 -12/12 (%) 55.3 % (3,6,12 ) 13.3; 44.7; 17.3 19.5 39 ( NT$34 ) 23.6% 1Q11A 2Q11A 3Q11A 4Q11F 1Q12F 2Q12F 3Q12F 4Q12F 2011F 2012F (NT$ ) 2,610 2,633 3,041 2,816 2,600 3,000 3,350 3,300 11,100 12,250 2,283 2,263 2,582 2,380 2,171 2,502 2,787 2,752 9,507 10,212 327 370 459 436 429 498 563 548 1,592 2,038 151 185 179 183 177 177 178 175 698 706 176 185 280 253 252 321 385 373 895 1,331 91 91 105 149 95 95 95 95 436 380 35 40 46 39 31 31 31 31 160 125 EBITDA 302 317 431 441 379 447 512 499 1,491 1,837 0 0 0 1 1 1 1 1 1 2 41 35 48 31 42 40 50 43 155 175 22 47 27 34 5 5 5 5 130 21 63 82 75 67 48 46 56 49 286 198 29 21 23 41 29 29 29 29 114 117 29 21 23 41 29 29 29 29 114 117 209 246 332 279 271 338 412 392 1,067 1,412 ( ) 23 37 42 (16) 32 32 32 32 85 127 187 210 290 295 239 306 380 361 981 1,285 0 0 0 0 0 0 0 0 0 0 187 210 290 295 239 306 380 361 981 1,285 EPS 0.53 0.63 0.85 0.71 0.69 0.86 1.05 1.00 2.72 3.60 EPS 0.48 0.53 0.74 0.75 0.61 0.78 0.97 0.92 2.51 3.28 (%) 12.5 14.1 15.1 15.5 16.5 16.6 16.8 16.6 14.3 16.6 6.7 7.0 9.2 9.0 9.7 10.7 11.5 11.3 8.1 10.9 EBITDA Margin 11.6 12.0 14.2 15.7 14.6 14.9 15.3 15.1 13.4 15.0 8.0 9.4 10.9 9.9 10.4 11.3 12.3 11.9 9.6 11.5 7.1 8.0 9.5 10.5 9.2 10.2 11.3 10.9 8.8 10.5 (%) 23.7 0.9 15.5 (7.4) (7.7) 15.4 11.7 (1.5) 52.7 10.4 21.6 13.2 24.0 (4.9) (1.7) 16.1 13.0 (2.7) 108.5 28.0 60.5 5.6 51.1 (9.5) (0.5) 27.3 20.0 (3.2) 262.6 48.8 EBITDA 23.8 5.0 36.1 2.5 (14.2) 18.2 14.4 (2.4) 87.7 23.2 118.8 17.5 34.9 (16.0) (3.0) 24.7 22.0 (4.7) 276.7 32.4 93.8 12.3 38.6 1.5 (19.0) 28.0 24.3 (5.1) 297.4 31.0 http://research.kgi.com 2012 03 26 2
  • 3. F 1993 39 3.6 16.5 16.6 16.8 15.1 15.5 14.1 12.7 12.5 4Q10 1Q11 2Q11 3Q11 4Q11F 1Q12F 2Q12F 3Q12F 5% (2010-2030) EPS 6.0 0.97 5.0 0.74 0.75 0.78 4.0 0.61 0.53 3.0 0.48 2.0 0.30 1.0 0.0 4Q10 1Q11 2Q11 3Q11 4Q11F 1Q12F 2Q12F 3Q12F Boeing 40 30 23 19.5 34 42 37 35 20 28 10 32 30 29 17 24 0 20.5 25 20 (10) 19 21 18 45% 17 52.5% 20 37% 41% 39% 15 (20) 13 14 14 10 15 5 6 7 15 (30) 2008 2009 2010 2011 2012F Mar-11 May-11 Jun-11 Aug-11 Sep-11 Nov-11 Dec-11 Feb-12 Mar-12 1Q12 3.5x 4,000 65 3.0x 55 3,000 2.5x 45 2.0x 2,000 35 1.5x 25 1.0x 1,000 15 0.5x 5 0 4Q10 1Q11 2Q11 3Q11 4Q11F 1Q12F 2Q12F 3Q12F 2007 2008 2009 2010 2011 2012 http://research.kgi.com 2012 03 26 3
  • 4. f 12 31 ( ) 2009A 2010A 2011F 2012F 2013F 12 31 ( ) 2009A 2010A 2011F 2012F 2013F 9,645 12,630 15,049 16,157 17,788 4,167 7,270 11,100 12,250 13,580 2,666 4,914 7,439 8,025 9,174 4,153 6,506 9,507 10,212 11,304 152 195 1,978 2,741 3,471 14 764 1,592 2,038 2,276 1,682 2,772 2,850 2,900 3,100 254 517 698 706 735 682 1,619 2,129 2,014 2,232 (240) 247 895 1,331 1,541 150 328 483 370 370 (85) (86) (113) (115) (116) 6,979 7,716 7,610 8,132 8,614 792 952 1,107 1,200 1,250 0 0 1 2 6 5,978 6,483 6,213 6,632 7,054 85 86 114 117 122 209 280 290 300 310 (95) 96 155 175 192 4,974 7,606 8,264 8,518 9,115 (31) 27 130 21 36 2,320 3,503 4,025 4,195 4,520 0 0 0 0 0 236 418 599 644 712 (450) 283 1,067 1,412 1,653 1,712 2,615 2,733 2,786 2,959 (90) 36 85 127 149 372 469 694 766 849 (360) 247 981 1,285 1,504 2,655 4,103 4,239 4,323 4,595 EBITDA 293 794 1,386 1,837 2,094 2,501 3,964 4,099 4,178 4,439 ( ) (1.12) 0.70 2.51 3.28 3.84 154 139 140 145 156 4,670 5,024 6,785 7,639 8,673 3,312 3,390 3,920 3,920 3,920 670 698 948 948 948 688 935 1,917 2,771 3,804 0 0 0 0 0 12 31 ( ) 2009A 2010A 2011F 2012F 2013F 2,136 (1,227) 980 1,910 1,598 (360) 247 981 1,285 1,504 533 547 491 505 553 12 31 ( ) 2009A 2010A 2011F 2012F 2013F 1,869 (1,925) (338) 294 (267) (% ) 95 (96) (155) (175) (192) (59.0) 74.4 52.7 10.4 10.9 (878) (1,188) (231) (853) (843) N.A. N.A. 262.6 48.8 15.7 (720) (935) (61) (800) (850) EBITDA (75.6) 170.9 74.6 32.5 14.0 (4) (65) 0 82 142 N.A. N.A. 297.4 31.0 17.0 (154) (188) (170) (135) (135) N.A. N.A. 259.5 30.9 17.0 Free Cash Flow 1,259 (2,415) 750 1,057 755 (%) 0.3 10.5 14.3 16.6 16.8 (1,513) 2,458 1,033 (294) (25) (5.8) 3.4 8.1 10.9 11.3 (27) 107 779 (431) (470) EBITDA 7.0 10.9 12.5 15.0 15.4 (1,382) 2,367 252 132 434 (8.6) 3.4 8.8 10.5 11.1 (105) (16) 1 5 11 (3.4) 2.2 7.1 8.2 8.9 (255) 43 1,783 763 730 N.A. 5.1 16.6 17.8 18.4 / (%) 90.2 131.0 100.7 91.2 85.3 (%) 86.9 127.1 71.5 55.3 45.3 (X) (4.3) 4.3 10.4 13.0 14.5 (X) (0.2) 0.1 0.4 0.5 0.6 ROIC (Return on Invested Capital) Cash Flow Int. Coverage (X) 25.2 (14.2) 8.6 16.3 13.1 12 31 1- + + = Cash Flow/Int. & ST Debt (X) 1.2 (0.5) 0.3 0.7 0.5 (X) 1.1 1.4 1.8 1.9 2.0 2009A 86.9% 12.8% 6.1% (5.8%) (X) 0.4 0.6 1.1 1.2 1.3 2010A 82.0% 7.5% 7.1% 3.4% (NT$ ) 4,624 5,222 5,619 4,538 4,075 2011F 81.2% 4.4% 6.3% 8.1% (NT$ ) 2012F 79.2% 4.1% 5.8% 10.9% 2013F 79.2% 4.1% 5.4% 11.3% (1.12) 0.70 2.51 3.28 3.84 0.54 2.24 3.76 4.57 5.25 12 31 1/ + + = 14.50 14.17 17.31 19.49 22.13 2009A 0.5 1.4 0.1 0.5 12.94 20.51 28.32 31.25 34.64 2010A 0.6 0.9 0.0 0.7 EBITDA/shr (0.75) 0.70 2.28 3.40 3.93 2011F 0.4 0.6 0.0 1.0 N.D. N.D. 1.10 1.20 1.30 2012F 0.4 0.5 0.0 1.1 2013F 0.4 0.5 0.0 1.1 (X) 0.4 0.7 0.8 0.8 0.8 12 31 x x 1- = ROIC 59.7 81.3 70.0 60.0 60.0 2009A (5.8%) 0.5 80.0% (2.3%) 147.3 139.2 93.7 86.4 83.3 2010A 3.4% 0.7 87.2% 2.0% 20.6 21.0 19.7 19.2 19.1 2011F 8.1% 1.0 92.0% 7.3% 186.4 199.5 144.0 127.2 124.2 2012F 10.9% 1.1 91.0% 10.6% 2013F 11.3% 1.1 91.0% 11.5% http://research.kgi.com 2012 03 26 4
  • 5. f 歷 45 40 35 30 25 20 15 10 Mar-09 Jun-09 Sep-09 Dec-09 Mar-10 Jun-10 Sep-10 Dec-10 Mar-11 Jun-11 Sep-11 Dec-11 Mar-12 歷 ( ) 26-Mar-12 31.55 34.0 39.0 15-Mar-12 27.65 N.A. 34.0 http://research.kgi.com 2012 03 26 5
  • 6. 100 A 1907-1909 104 700 200051 886.2.2181.8888 886.2.8501.1691 2014 A 24D1 518008 852.2878.6888 8th - 11th floors, Asia Centre Building 852.2878.6800 173 South Sathorn Road, Bangkok 10120, Thailand 66.2658.8888 66.2658.8014 (OP) (Excessive Return) ( ) 40% (N) ( ) 40% 40% (U) ( ) 40% (NR) (R ) / * =( / )–1 http://research.kgi.com 2012 03 26 6