Case record...Arterial embolic hemorrhagic infarction
•
1 gostou•202 visualizações

Case record...Arterial embolic hemorrhagic infarction http://yassermetwally.com http://yassermetwally.net

Recomendados
Recomendados
Mais conteúdo relacionado
Mais procurados
Mais procurados (10)
Destaque
Semelhante a Case record...Arterial embolic hemorrhagic infarction
Semelhante a Case record...Arterial embolic hemorrhagic infarction (20)
Mais de Professor Yasser Metwally
Mais de Professor Yasser Metwally (20)
Último
Último (20)
Case record...Arterial embolic hemorrhagic infarction
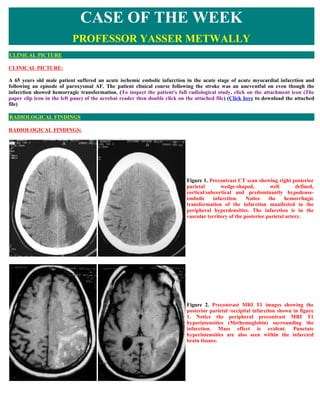
- 1. CASE OF THE WEEK PROFESSOR YASSER METWALLY CLINICAL PICTURE CLINICAL PICTURE: A 65 years old male patient suffered an acute ischemic embolic infarction in the acute stage of acute myocardial infarction and following an episode of paroxysmal AF. The patient clinical course following the stroke was an uneventful on even though the infarction showed hemorragic transformation. (To inspect the patient's full radiological study, click on the attachment icon (The paper clip icon in the left pane) of the acrobat reader then double click on the attached file) (Click here to download the attached file) RADIOLOGICAL FINDINGS RADIOLOGICAL FINDINGS: Figure 1. Precontrast CT scan showing right posterior parietal wedge-shaped, well defined, cortical/subcortical and predominantly hypodense- embolic infarction. Notice the hemorrhagic transformation of the infarction manifested in the peripheral hyperdensities. The infarction is in the vascular territory of the posterior parietal artery. Figure 2. Precontrast MRI T1 images showing the posterior parietal /occipital infarction shown in figure 1. Notice the peripheral precontrast MRI T1 hyperintensities (Methemoglobin) surrounding the infarction. Mass effect is evident. Punctate hyperintensities are also seen within the infarcted brain tissues.
- 2. Figure 3. MRI T2 images showing the heterogeneous nature of the infarction. The hyperintense areas most probably represent edema and the hypointense areas most probably represent blood products (deoxyhemoglobin in the acute stage and hemosiderin in the chronic stage) Figure 4. MRI FLAIR images showing the heterogeneous nature of the parietal/occipital infarction. The hyperintense areas most probably represent edema and the hypointense areas most probably represent blood products (deoxyhemoglobin in the acute stage and hemosiderin in the chronic stage). Notice the multiple small hyperintense infarctions scattered in the periventricular and cortical/subcortical zones of both hemisphere representing multiplicity of emboli which is quite evident in FLAIR images. Some statistical date regarding embolic infarctions in Egypt INCIDENCE OF INVOLVEMENT OF THE MAJOR INTRACEREBRAL ARTERIES AND THEIR MAJOR BRANCHES BY EMBOLIC INFARCTIONS OF CARDIAC SOURCE ARTERY % OF INVOLVEMENT FRONTO-OPERCULAR 37% MIDDLE CEREBRAL ARTERY 15% LATERAL STRIATE 12% ANTERIOR CEREBRAL 12% CALCARINE 10% POSTERIOR PARIETAL 9% INSULAR 4% CEREBELLAR 1%
- 3. INCIDENCE OF INVOLVEMENT OF THE CEREBRAL ARTERIES IN CAROTID BIFURCATION DISEASE ARTERY % OF INVOLVEMENT FRONTO-OPERCULAR 45% MIDDLE CEREBRAL 33% LATERAL STRIAT 22% It should be noted that the MCA was more frequently involved in embolization due carotid bifurcation disease (33%) than in cardiac embolization (15%),accordingly the size of infarction [infarction due to MCA occlusion is the largest brain infarction] is not positively correlated with a cardiac source of embolization.The carotid bifurcation disease embolizes to the MCA more often than the heart INCIDENCE OF INTRACARDIAC THROMBI IN EMBOLIC BRAIN INFARCTION INTRACARDIAC THROMBI [ ALWAYS +VE HISTORY OF OLD 14% MYOCARDIAL INFARCTION] NO INTRACARDIAC THROMBI 86% AETIOLOGY OF ATRIAL FIBRILLATION IN EMBOLIC BRAIN INFARCTION ISCHAEMIC HEART DISEASE 90% THYROTOXICOSIS 7% RHEUMATIC HEART DISEASE 3% MULTIPLICITY OF BRAIN INFARCTIONS OF CARDIAC SOURCE SINGLE INFARCTION 78% TWO INFARCTIONS 17% THREE OR MORE INFARCTIONS 5% AETIOLOGY OF CARDIAC DISEASE IN EMBOLIC BRAIN INFARCTION OF CARDIAC ORIGIN NON VALVULAR ATRIAL FIBRILLATION 80% OLD MYOCARDIAC INFARCTION WITH INTRACARDIAC 14% THROMBI MITRAL VALVE PROLAPSE 3% RHEUMATIC HEART DISEASE 3% DIFFERENCES BETWEEN CEREBRAL EMBOLIZATION DUE TO CARDIAC SOURCE AND DUE TO CAROTID BIFURCATION DISEASE Carotid bifurcation disease Cardiac source Never multiple Multiple in 22% of cases [either unilaterally or bilaterally]
- 4. Never in the territory of either the anterior or posterior Anterior or posterior circulations are involved in 19% of cases circulations [always in the MCA domain] Constitute 28% of all cases with embolic infarction Constitute 72% of all cases with embolic infarction The size of infarction is not positively correlated with a cardiac source of embolization.The carotid bifurcation disease embolizes to the MCA more often than the heart , (infarction due to MCA occlusion is the largest brain infarction) It should also be noted that the commonest cause of ischemic brain lesions in Egypt is the microvascular disease (65%) while embolic brain disease constitute around 35% of all ischemic brain lesions PLEASE NOTE THESE DATA ARE THE AUTHOR OWN STATISTICS THESE DATA ARE PURELY EGYPTIAN AND MIGHT NOT BE APPLICABLE IN OTHER PARTS OF THE WORLD THESE DATA ARE DERIVED FROM 5700 CASES WITH ISCHEMIC BRAIN LESIONS MR IMAGING OF BLOOD PRODUCTS Table 1. Evolution of MR imaging signal characteristics with time with intracerebral hemorrhage Iron-containing Iron oxidation Red cell Phase Time T1 T2 T2* molecule state membranes Hyperacute Hours Oxyhemoglobin Fe2+ Intact Hypointense Hyperintense Acute Hours to days Deoxyhemoglobin Fe 2+ Intact iso/ Hypointense Hypointense Hypointense Early Days to 1 week Methemoglobin Fe2+ Intact Hyperintense Hypointense subacute Late subacute 1 week to Methemoglobin Fe2+ Degraded Hyperintense Hyperintense months Chronic >months Hemosiderin Fe2+ Degraded iso/ Hypointense Hypointense Hypointense Abbreviations: Fe, iron; iso, isointense relative to normal brain.. Effect of hematoma evolution on MR imaging appearance of intracerebral hemorrhage Hyperacute phase The hyperacute phase of the hematoma is seen immediately following extravasation of blood into the brain parenchyma. At this stage the red cell membrane is intact, and the hemoglobin molecule is normally saturated with oxygen (oxy-hemoglobin). Specifically, the iron atoms contained within the heme portions of the hemoglobin molecule are bound to oxygen. This is the only phase of hematoma in which the iron atoms have no unpaired electrons in their outer orbitals and are therefore “diamagnetic,” without exaggerated T1 relaxation or susceptibility effects. The ICH signal characteristics are thus not primarily attributable to iron but instead to the increased spin density of the hematoma relative to uninvolved brain tissue. Hyperacute hematoma appears slightly hypointense or iso-intense on T1-weighted images and slightly hyperintense on T2-weighted images this pattern resembles that of many other pathologic conditions of the brain. Even early in the hyperacute phase, however, there is often deoxy-hemoglobin at the periphery of the hematoma, which appears as a thin rim of T2 hypointensity. This pattern can help differentiate hyperacute hematoma from other brain pathologies (50). Acute phase The acute phase, which begins within hours of ICH, is characterized by deoxy-hemoglobin. Deoxygenation occurs first at the periphery of the hematoma and progresses toward the center. This pattern appears because intrahematoma oxygen tension is lowest in the periphery, where red cells are adjacent to oxygen-starved tissue, and highest in the center, because red cells do not use oxygen for their metabolism. The iron atoms of deoxy-hemoglobin have five ligands and four unpaired electrons and hence are paramagnetic. Susceptibility effect is present because the iron is compartmentalized within intact red cell membranes, resulting in hypointensity on T2-weighted images that is due to increased T2* relaxation. Magnetic dipole–dipole interactions are prevented by the three-dimensional atomic structure of deoxy-hemoglobin, which blocks access of water protons to iron atoms. T1 relaxation times are therefore not shortened, and there is iso- or slight hypointensity on T1-weighted images. Sometimes a thin rim of T1
- 5. hyperintensity can be seen in the periphery of the hematoma, caused by early oxidation of intracellular deoxy-hemoglobin to intracellular met-hemoglobin. (50) Early subacute phase After several days, the early subacute phase begins. The production of reducing substances declines with failure of red cell metabolism, and the iron atoms are oxidized to the ferric state, Fe3+, to produce met-hemoglobin. Magnetic dipole–dipole interactions can occur because the three-dimensional structure of met-hemoglobin exposes the iron atoms to water protons. This pattern leads to decreased T1 relaxation times and marked hyperintensity on T1-weighted images. Susceptibility effect is present because the red cell membranes remain intact, and hence there is continued hypointensity on T2-weighted images. (50) Late subacute phase Over several days to weeks, the red cell membranes are degraded, and the late subacute phase begins. Susceptibility effect is lost because met-hemoglobin is no longer locally sequestered within red cell membranes; it freely diffuses within the hematoma cavity, resulting in a locally homogeneous magnetic field. This pattern leads to T2* lengthening, and hence to increased hyperintensity, on T2-weighted images. Chronic phase Over the ensuing months, the hematoma enters the chronic phase. The degree of hyperintensity on T1- and T2-weighted images lessens as the concentration of met-hemoglobin decreases with protein breakdown. The center of the hematoma may evolve into a fluid-filled cavity with signal characteristics identical to cerebrospinal fluid, or the walls of the cavity may collapse, leaving only a thin slit. As proteins are degraded, the iron atoms become liberated from the heme molecules, scavenged by macrophages, and converted into ferritin, which can be recycled. In most cases, however, the degree of iron deposition overwhelms the recycling capacity, with the excess being locally concentrated in hemosiderin molecules. The iron in hemosiderin does not have access to water protons and therefore exerts only susceptibility effect without significant dipole–dipole interactions, leading to marked hypointensity on T2-weighted images. This hypointensity is seen at the rim of the hematoma cavity and may persist indefinitely. In practice, there is considerable variability in the orderly progression of hematoma signal change over time. The evolution of these signal characteristics may be influenced by a number of factors, including ICH size, oxygen tension, integrity of the blood–brain barrier, the presence of rebleeding, the efficiency of the patient's intrinsic repair processes, and the presence of an underlying lesion such as an arteriovenous malformation or tumor (2). It is common to see different stages appear simultaneously. For these reasons, “dating” of bleed onset using MR imaging data alone is intrinsically imprecise. (50) SUMMARY (50) Hyperacute Hyperacute hemorrhage refers to a collection of blood in which oxyhemoglobin predominates. This type of Hemorrhage (0 TO hemorrhage is rarely encountered in the clinical setting because several hours commonly elapse between the 12 Hours) onset of hemorrhage and a patient being referred for MR imaging. A hyperacute hematoma may have a nonspecific appearance on MR imaging because oxyhemoglobin is not paramagnetic. Hyperacute hemorrhages can behave similar to other lesions with increased water content and are typically isointense or low signal on Tl-weighted images and high signal on T2- weighted images.With clot retraction in the hyperacute phase, the increased protein content of the hemorrhage results in the lesion being isointense to hyperintense on Tl- weighted images, which can facilitate differentiation from other mass lesions.A hypointense rim along the periphery of a hyperacute hemorrhage was noted ,and this may provide an additional clue to the diagnosis. Hyperacute hemorrhage, however, is more readily identified on CT, which remains the initial examination of choice for its evaluation. Acute Hemorrhage In the acute setting, there is clot retraction and resorption of serum. As the hematoma becomes isolated from (12 Hours to 3 Days) the normal cerebral circulation, oxyhemoglobin rapidly deoxygenates to yield deoxyhemoglobin. The increased protein content of the retracted clot, which is responsible for the high attenuation noted on noncontrast CT, causes the hematoma to be slightly hyperintense relative to low-intensity cerebrospinal fluid (CSF) and slightly hypointense to brain parenchyma on Tl-weighted images. In contrast to CT in the acute setting, which reliably demonstrates high attenuation characteristic of acute hemorrhage, MR imaging findings on Tl-weighted images are relatively nonspecific. T2-weighted images demonstrate a marked decrease in signal intensity because of magnetic susceptibility effects. The signal loss is due to local field inhomogeneity related to paramagnetic deoxyhemoglobin within intact red blood cells. Gradient echo images exaggerate this effect and are often useful for the diagnosis of acute hemorrhage Subacute In the early subacute stage, oxidation of deoxyhemoglobin to methemoglobin occurs within intact red blood
- 6. Hemorrhage: Early cells. Methemoglobin is paramagnetic, which results in marked increased signal intensity on Tl-weighted (3 Days to I Week) images. Typically the increased signal begins at the periphery of the clot and progresses inward. The differential diagnosis of lesions that demonstrate increased signal intensity on noncontrast TI-weighted images is relatively limited. Fat; substances with elevated protein content (mucus or fluid within certain intracranial tumors, i.e., craniopharyngioma); and paramagnetic moieties, such as melanin, free radicals (within the wall of parenchymal abscesses), and ions including calcium, manganese, and copper, can exhibit high signal intensity on Tl-weighted images. Correlation with the clinical history, morphology, and location of the lesion as well as appearance on other imaging sequences (i.e., T2, gradient echo, and fat suppression) typically allows differentiation from subacute hemorrhage. On T2-weighted images, paramagnetic methemoglobin in intact red blood cells results in low signal intensity similar to that of deoxyhemoglobin. The combination of bright signal intensity on Tl and markedly decreased signal intensity on T2 is relatively specific for paramagnetic substances and, with the appropriate morphology, is highly suggestive of intracranial hemorrhage Subacute The late subacute stage is characterized by lysis of the blood cells. Concurrently, there is dilution of Hemorrhage: Late (1 extracellular methemoglobin and breakdown of the proteinaceous clot. High signal intensity persists on TI- Week to Months) weighted images because of methemoglobin; however, lysis of the red blood cells and the decrease in protein content result in increased signal intensity on T2-weighted images. Bright signal intensity on both Tl- weighted and T2- weighted images is highly specific for hemorrhage. Furthermore, at the periphery of the hemorrhage, early accumulation of hemosiderin and ferritin within macrophages causes a low signal intensity ring, most prominent on T2-weighted images. Chronic stage The hallmark of chronic hemorrhage is low signal intensity on T2-weighted images because of ferritin and (Months to Years) hemosiderin within macrophages, which are the final breakdown products of hemoglobin. The resulting low intensity first appears during the late subacute stage of hematoma evolution at the margin of the lesion. With time, the rim thickens. A collapsed cavity with peripheral areas of low signal intensity on T2-weighted images is the residuum of an uncomplicated intraparenchymal hemorrhage. This appearance can persist indefinitely. DIAGNOSIS: DIAGNOSIS: HEMORRHAGIC ARTERIAL EMBOLIC INFARCTION DISCUSSION DISCUSSION: A hemorrhagic infarction can be defined as an ischemic infarct in which an area of bleeding exists within ischemic cerebral tissue. This definition includes small hemorrhages confined to minor ischemic areas in gray matter as well as much larger areas involving cortical and deep lesions. Hemorrhagic infarction has been recognized as a complication of embolic stroke. In pathological studies, cerebral embolism was associated with hemorrhagic infarction in 50% to 70% of cases (13). In an angiographic study reported by Yamaguchi et al (4), the incidence of hemorrhagic infarction in patients with cardiogenic embolism was 37.5%, which was significantly higher than the 1.5% in patients with non-embolic stroke. A prospective survey by Hornig et al (5) based on clinical and radiological studies has indicated that hemorrhagic infarction occurs in 43% of ischemic stroke patients. Regarding the arterial distribution of hemorrhagic infarction, 90% of the patients had involvement of the anterior circulation (6). However, there was little information on the involvement of the posterior circulation. In 1996, Chaves et al (7) investigated cerebellar hemorrhagic infarction, and concluded that the causes, imaging findings and consequences of hemorrhagic infarction in posterior circulation were similar to those in anterior circulation. Anecdotal evidence implicated large embolic cerebral infarcts (5, 8, 9), uncontrolled hypertension ( 10), advanced age and institution of anticoagulants (10-12) or thrombolytic agents (13, 14) as special risk factors for hemorrhagic infarction. Infarct size seemed to be the most important factor for secondary hemorrhage. The reason for preferential hemorrhagic transformation of a large infarct with a mass effect might include more extensive edema, compression of small vessels in the area surrounding the lesion and stasis of blood flow. After the decrease of edema, reperfusion of these vessels occurs and because these capillaries often have a disrupted endothelium, a diapedesis of blood will occur (15, 16). Cerebellar hemorrhagic infarction was common when the full cerebellar arterial territories were involved, probably reflecting the larger size of infarcts, which is known to be a risk factor associated with hemorrhagic infarction in the anterior circulation (7). As compared to cerebellar hemorrhagic infarction, massive pontine hemorrhagic infarction was relatively uncommon. The reason why the incidence of pontine hemorrhagic infarction is low has not been clarified. (50) The pathogenesis of hemorrhagic infarction has been investigated in experimental and clinical studies. There are three theories concerning the mechanism of hemorrhagic infarction. The most common pattern in supratentorial and cerebellar hemorrhagic infarction is complete interruption of arterial blood supply, followed by reperfusion. In 1951, Fisher and Adams ( 1 ) reported a high incidence of hemorrhagic infarction in their autopsy study of cerebral embolism. They postulated that hemorrhagic transformation
- 7. occurs when an embolus fragments and migrates distally, thereby opening the previously occluded vessel and exposing the necrotic brain to the full force of arterial blood pressure. The downstream migration of the embolus after its initial impact leads to extravasation of blood via reflow into damaged vessels of the proximally infarcted zone. Reconstitution of blood flow results in hemorrhagic transformation of the embolic infarction (2, 17). This migration embolism could occur in the vertebrobasilar circulation system as well as the carotid and cerebellar systems. As suggested by Kimura et al (18) in this volume, the extensive embolic occlusion of the entire length of the basilar artery and migration of the embolus are assumed to develop into massive pontine hemorrhagic infarction. The second mechanism is extravasation from leptomeningeal collateral vessels. Some patients with cardiogenic embolic stroke developed hemorrhagic infarction without opening of occluded vessels. In such cases, restoration of blood flow occurs through leptomeningeal collaterals. Ogata et al ( 19) indicated that hemorrhage into an infarct with persisting occlusion of the proximal artery may occur when the involved blood vessels are exposed to the force of arterial blood pressure from the leptomeningeal collaterals. A less common pattern is incomplete and insufficient perfusion caused by stenotic vessels, followed by gradual necrosis of cerebral tissue. (50) Thrombolytic therapy of acute ischemic stroke patients is currently one of the most controversial topics in clinical medicine. The use of thrombolytic agents can increase the likehood of hemorrhagic infarction (13, 14). The decision regarding whether to use thrombolytic agents should be based on thorough evaluation of the individual patients by a physician with a speciality in treating stroke patients. Patients with large infarcts and severe neurological deficits have a higher risk of hemorrhagic transformation after thrombolysis. However, it remains debatable how to prevent and manage hemorrhagic infarction caused by acute therapeutic agents in ischemic stroke patients. More clinical research is needed. NEUROIMAGING OF HEMORRHAGIC INFARCTION Arterial hemorrhagic infarction Ischemic infarction can be divided into "bland or non-hemorrhagic" infarction and infarction associated with secondary bleeding — referred to as hemorrhagic conversion or transformation (HT) — in ischemically infarcted areas. Bland infarction is characterized by bland widespread leukocyte infiltration and macrophage invasion, with only scattered red cells being found. Hemorrhagic conversion may take the form of hemorrhagic infarction (HI) or, less commonly, parenchymatous hemorrhage associated with a cerebral embolic infarction (PH). The occurrence of Hemorrhagic conversion is "predominantly a natural tissue consequence of embolism". (50) Bland infarction is characterized by bland widespread leukocyte infiltration and macrophage Bland or non-hemorrhagic invasion, with only scattered red cells being found. The occurrence of Hemorrhagic conversion of infarction is "predominantly a natural tissue consequence of embolism" Hemorrhagic conversion of Hemorrhagic infarction (HI) infarction Parenchymatous hemorrhage associated with a cerebral embolic infarction (PH) An autopsy, hemorrhagic infarction may vary from patchy petechial bleeding to more confluent hemorrhages, representing multifocal extravasation of blood from capillaries or venules. Hemorrhagic infarction and Parenchymatous hemorrhage associated with a cerebral embolic infarction (PH) have different incidences, pathogenesis, and clinical outcome, but distinguishing HI and PH on CT may be difficult. Although HI and PH have often been grouped together, there are certain features on CT that help characterize these two types of hemorrhagic transformation. On CT, HI appears as a discontinuous heterogeneous mixture of high and low densities occurring within the vascular territory of the infarct. In contrast, PH appears as a discrete, homogeneous collection of blood that often exerts mass effect and may extend beyond the original infarct boundaries or even into the ventricles. (50) hemorrhagic infarction (HI) HI appears as a discontinuous heterogeneous mixture of high and low densities occurring within the vascular territory of the infarct Parenchymatous hemorrhage Parenchymatous hemorrhage associated with a cerebral embolic infarction (PH) appears as a associated with a cerebral embolic discrete, homogeneous collection of blood that often exerts mass effect and may extend beyond infarction (PH) the original infarct boundaries or even into the ventricles Hemorrhagic infarction occurs regularly in the natural evolution of acute embolic stroke. Hemorrhagic transformation of an infarction can occur spontaneously in up to 30% of patients by serial CT brain scan. (19) Transformation of a bland embolic infarct to hemorrhagic infarction is rare in the first 6 hours. Most hemorrhagic infarctions are asymptomatic, and it is not uncommon to detect hemorrhagic infarction on CT in patients who are stable or improving. The pathogenesis of hemorrhagic conversion or transformation in ischemically infarcted areas appears to relate to reperfusion of bleeding from recanalized but ischemically injured
- 8. vessels by the natural, dynamic dissolution of thrombi i.e., an embolus that represents all or part of a thrombus has a spontaneous tendency to lyse and disperse. Reperfusion into the ischemically injured vessels can therefore result in varying degrees of blood extravasation through the damaged blood-brain barrier. (50) Hemorrhagic infarction has been often explained as a result of reperfusion of the vascular bed of the infarct, such as would occur after fragmentation and distal migration of an embolus or after early reopening of a large vessel occlusion in the setting of a large infarction; the full pressure of arterial blood into hypoxic capillaries results in a diapedesis or red cells through their hypoxic walls. The concept of restored lumen patency is consistent with greater frequency of hemorrhagic infarction in patients with cardioembolic infarcts. The occurrence of parenchymatous hemorrhage (PH) in areas of ischemic infarction is less common that that of HI. PH appears to be associated with anticoagulation therapy, Antiplatelet therapy and thrombolytic therapy, with a low incidence of spontaneous PH in areas of ischemic infarction (on the order of 2% to 9%) in patients not receiving anticoagulation therapy. In contrast to HI, clinical deterioration is often associated with PH. It has been proposed that the pathogenesis of PH may involve "ischemic necrosis resulting in the rupture of small penetrating vessels analogous to hypertensive hemorrhage, leading to massive bleeding rather that the multifocal diapedesis of blood through capillary walls, as seen in HI". (50) The observation that some hemorrhagic infarctions develop distal to the site of a persisting occlusion suggests that reperfusion is not always a necessary condition. Investigators from Japan (20) examined the brains of 14 patients who died from herniation of the brain after cardioembolic stroke with persistent occlusion of the internal carotid-middle arterial axis . The finding of hemorrhagic infarct in 7 of the patients contradicts the concept that reopening a previously occluded vessel is the only pathophysiologic mechanism for the development of hemorrhagic infarct. Analysis of blood pressure after stroke has revealed one or more surges of arterial hypertension or rapid rise of blood pressure in patients with hemorrhagic stroke without a reopening of the occluded artery; it has been speculated that these blood pressure rises might explain hemorrhagic infarction in many cases. (50) A relationship between hyperglycemia and hemorrhagic transformation has also been suggested by he observation that occluding the middle cerebral artery of markedly hyperglycemia cats was associated with 5-fold more frequent and 25-fold more extensive hemorrhage into infarcts than in normoglycemic animals (21). Compared with permanent occlusion, temporary restoration of blood flow after 4 hours caused the most extensive hemorrhage into infarcts. It was concluded that hyperglycemia and restoration of blood flow to ischemic territories were strong risk factors for hemorrhagic infarct conversion. The evidence suggests that the marked tissue energy depletion accompanied by acidosis damages brain vessels, causing leakage of edema fluid and red blood cells (21). Diffuse HI associated with marked hyperglycemia has been reported in two patients (22). In summary, HI occurs regularly in the natural evolution of acute embolic stroke and is usually asymptomatic. Parenchymatous hemorrhage associated with a cerebral embolic infarctions (PHs) occur less frequently, but are often symptomatic due to extension and mass effect beyond the original infarct territory. Interest in these issues has been further generated by trials of thrombolytic therapy for acute ischemic stroke. Hemorrhagic infarction is regarded as distinct from anemic infarction although microscopical haemorrhage is frequent in the later. It has frankly hemorrhagic features which consist of petechial zones that are frequently confluent and are situated in the cortex. These hemorrhagic areas may involve the entire infarction but tend most often to involve the boundary zones supplied by meningeal arterial anastomosis or, in case of middle cerebral infarct, in the basal ganglia. Hemorrhagic infarction is secondary cortical reirregation which takes place in the capillary blood vessels that have been damaged by the initial hypoxia. Reirregation takes place when lysis (natural or by therapeutic thrombolysis) or secondary mobilization of the thrombus take place.
- 9. Figure 5. Haemorrhagic infarctions. They have frankly hemorrhagic features which consist of petechial zones that are frequently confluent and are situated in the cortex. Figure 6. Noncontrast CT brain scan within 1 hour of acute onset of aphasia and right-sided weakness (A), which demonstrates an old right posterior cerebral artery territory infarct, and 24 hours later, after thrombolytic therapy (B), demonstrating dramatic hemorrhage transformation of the cerebral infarct.
- 10. Figure 7. Parenchymatous hemorrhage associated with a cerebral embolic infarctions (PHs) occur less frequently, but are often symptomatic due to extension and mass effect beyond the original infarct territory. Anticoagulants and hemorrhagic infarctions (50) The occurrence of ICH in patients receiving oral anticoagulants is generally a serious event. On one hand, the risk of ICH is increased by eight to 11 fold by the chronic use of warfarin anticoagulation. On the other hand, this mechanism of ICH often leads to larger haematomas than those in patients not receiving anticoagulants, a feature that correlates with substantially higher mortality rates. Table 2. The clinical features of ICH in patients receiving oral anticoagulants include: A low frequency of associated bleeding elsewhere in the body. Anticoagulant Lack of consistent association between ICH and preceding head trauma or cerebral infarction. Anticoagulant Larger haematoma volumes in anticoagulated patients than in non-anticoagulated patients, as a result of Anticoagulant more prolonged bleeding periods. Anticoagulant A bad prognosis in anticoagulant-related ICHS, with mortality rates exceeding 50-60% Box 1. Other features related to the occurrence of anticoagulant-related ICH are less consistently observed, and include: (50) 1. Duration of anticoagulation prior to onset of ICH: in some reports. most haemorrhages (70%) occurred within the first year of treatment, whereas in others only about one-third of the cases occurred within that period of time. 2. Relationship between intensity of anticoagulation and risk of ICH: in some studies. ICH was more likely with excessive prolongation of the prothrombin time, but in others there was no clear relationship. 3. Role of hypertension in causing ICH in patients on oral anticoagulants: a strong association with hypertension is present. 4. Location of ICH: a relatively high frequency of cerebellar haemorrhages in anticoagulated patients has been reported in some series, but not in others. Thrombolytic agents and hemorrhagic infarctions Thrombolytic agents, in particular streptokinase and recombinant tissue- type plasminogen activator (rt-PA), are widely used in the treatment of patients with acute myocardial infarction (MI). Although the frequency of ICH is low (0.4-1.3% of treated patients).
- 11. especially with the intravenous use of the fibrin-specific agent rt-PA, its occurrence is always serious and often fatal. (50) Table 3. The clinical and CT aspects of ICH related to the use of rt-PA in MI include the following Onset soon after treatment, close to 40% of them during the rt-PA infusion and another 25% occurring within 24 hours of onset of infusion in one series . Thrombolysis Predominantly lobar location, with rare examples of bleeding into the posterior fossa and putamen Thrombolysis Multiple simultaneous haemorrhages in about one-third of the cases. Thrombolysis Mortality rate of 44-66%. The mechanism of bleeding in the setting of rt-PA use is not clear. A potential role of the concomitant use of intravenous heparin in the production of ICH has been suggested. The Global Use of Strategies to Open Occluded Coronary Arteries as the majority of patients with this complication have excessively prolonged activated partial thromboplastin time (APTT) ( 100 seconds) at the time of onset of the ICH. Local vascular factors with bleeding potential, such as CAA, have been recently reported as the suspect substrate of ICH in the setting of thrombolysis for acute MI. Other features, such as age 65 years, history of hypertension, and previous aspirin use have been suggested as risk factors, but have not been clearly documented. More details about hemorrhagic transformation of arterial infarctions with thrombolytic therapy (50) The most feared complication in acute ischemic stroke is hemorrhagic transformation (HT) as it has devastating clinical consequences and is associated with an over ten-fold increase in mortality (23). Although in clinical practice this complication may be less frequent than failure of treatment to recanalized occluded cerebral artery or early reocclusion, ICH seems to represent an important obstacle to the generalization of thrombolytic therapy (24). Intracerebral hemorrhage mostly occurs in the core of the infracted area, thus suggesting that ischemic events can have an important role (25). In experimental models of focal cerebral ischemia, the basal lamina of the vessels and the extracellular matrix show an alteration and the adhesion between the microvessel cells and the extracellular matrix is dearranged so there can be an extravasation of blood elements. There is an increase in capillary permeability that comes along with an inrush of plasma components inside the brain tissue, an inflammatory reaction with thrombin activation, and an increasing of many mediators such as platelet-activating factor, tumor necrosis factor ? and bradykinin, which contribute to increase endothelial permeability. In addition, oxidative damage may increase hemorrhagic risk (26). Metalloproteinases (50) Matrix metalloproteinases (MMP) are involved in the hemorrhagic transformation, and their activation is partly responsible for the BBB disruption. MMPs represent a family of proteolytic enzymes combined with zinc, which acts normally on the remodeling of the extracellular matrix. Inappropriate activation can induce proteolysis of the matrix of the neurovascular unity (endothelium, astrocyte, and neuron). MMPs are liberated by the endothelium and the polynucleates at the inflammatory stage of ischemia and utilize type IV collagen and laminin as substrates. (27). In some animal models of focal cerebral ischemia, activation of MMP-9 is associated with increased permeability of the BBB that leads to edema formation and hemorrhagic transformation (27). MMP-2 and MMP-9 released during the ischemic event can damage the vessel components, particularly type IV collagen, fibronectin, and laminin, thus altering the basal lamina of the cerebral vessels. In humans, elevation of MMP-9 is linked to the severity of ischemic stroke (28) , and the pretherapeutic MMP-9 rate is an independent predictor of the risk of hemorrhagic transformation related to thrombolysis (29). Risk factors for HT after thrombolytic therapy (50) Exact knowledge of mechanisms related to ICH after thrombolysis and the role of biomarkers could be useful in selecting patients that can benefit from such treatment. Other elements must be taken in account for the genesis of rt-PA-related ICH: age, hypertension, diabetes mellitus or cerebral amyloid angiopathy, extent of early ischemic signs shown on brain CT scan or the volume of cerebral ischemic lesions on diffusion weighted MRI, and the presence of leukoaraiosis (30). The first trials on rt-PA have provided evidence that higher doses of lytic agents lead to higher rates of sICH, so the dose was limited to 0.9 mg/kg up to 90 mg in total (31). Age has been consistently found to be a risk factor for sICH after thrombolysis for acute ischemic stroke (8). Recent data from several open-label studies on use of rt-PA have shown that the risk of sICH in the elderly is comparable to that of younger patients. Certain trial showed that the benefit-risk ratio of intravenous rt-PA can be favorable in carefully selected elderly stroke patients
- 12. treated within three hours. The sICH rate was 4.4% in the group of patients aged 80 years or older included in this study (32). The Stroke Survey Group rt-PA analysis also concluded that it was not justified to systematically contraindicate thrombolysis for patients older than 80 years (33). Many authors have shown the importance of the baseline stroke severity in hemorrhagic risk after thrombolysis (9). The Multicentre tPA Acute Stroke Survey study showed that the NIHSS score was an independent marker of ICH, with an odds ratio of 1.38 for a one-point increase in the NIHSS score (33). Some authers on their report did not find a significant association of severity of neurological deficit at baseline with increased risk of sICH (10). Moreover, the ECASS I trial showed that severity of neurological deficit at admission represented a risk factor for hemorrhagic trans-formation and not for parenchymal hematoma (31). Another factor which may contribute to the development of rt-PA-related sICH is hypertension during the first 24 hours after ischemic stroke (34). Experimental and human studies indicate that hyperglycemia predicts higher stroke mortality independently from stroke severity, stroke type, or age. These data suggest that hyperglycemia may directly contribute to poor outcomes by exacerbating acute brain injury (29). In the PROACT II study, there was an increased risk of sICH in patients with pretherapeutic glycemia higher than 200 mg/dl (35). The mechanism of hyperglycemia-related ICH is not clear. There are numerous animal experimental proofs that hyperglycemia provokes microvascular lesions as well as BBB damage, leading to hemorrhagic transformation of the cerebral infarction (36). However Some authers did not find that a history of diabetes mellitus was a risk factor for sICH, despite the fact that many patients with diabetes mellitus had elevated serum glucose at stroke onset (25). The significance of early ischemic changes on baseline brain CT scan as predictors of hemorrhagic transformation scan remains controversial (26). With the advent of advanced MRI such as diffusion- (DWI) and perfusion-weighted imaging (PWI), It has been demonstrated in recent studies that in anterior circulation strokes, an acute DWI lesion volume >70 cm3 has a high specificity for poor outcomes with or without therapy (37). A retrospective multicenter study evaluated whether leukoaraiosis is a risk factor for sICH in patients treated with alteplase for anterior circulation stroke. All patients had received magnetic resonance imaging evaluation before thrombolysis and for statistical analysis. Leukoaraiosis in the deep white matter was dichotomized into absent or mild versus moderate or severe. The rate of sICH was significantly higher in patients with moderate to severe leukoaraiosis than in patients without relevant leukoaraiosis (37). The risk of ICH after thrombolysis in ischemic stroke patients carrying old asymptomatic microbleeds (which can considered as a marker of microangiopathy, and of amyloid angiopathy) remains a controversial subject (38). In a published pooled analysis of 570 patients, the presence of microbleeds was not predictive of sICH after thrombolysis except grade 3 microbleeds (39). Some authors have suggested that the differences between symptomatic and asymptomatic ICHs are due to the intensity of bleeding rather than physiopathologic differences. For others, hemorrhagic infarctions and parenchymal hematomas after t-PA have a different clinical, etiologic, and biological significance (40). Benign hemorrhagic transformation can be associated with the natural history of ischemic stroke while parenchymal hematomas, especially the PH-type 2 (homogeneous hematomas with mass effect occupying 30% of ischemic lesion volume) could be linked to the t-PA itself and particularly to its impact on homeostasis (as demonstrated by elevation of fibrin degradation products after treatment) (41). Any extension of the thrombolytic treatment window also implies an increased risk of HT. Data shows that the occurrence of HT in patients treated within three hours of symptom onset was 4.8%, while for those treated between three and six hours after onset the occurrence rose to 6.4% (42). Although tPA can cause fatal or symptomatic brain hemorrhage, patients treated with tPA strictly following protocol have a higher likelihood of functional neurologic recovery. Thus, only physicians experienced in stroke management should use tPA to treat patients with acute stroke; inexperienced physicians are more likely to violate protocols, resulting in more brain hemorrhages and deaths (43,44,45). Venous infarction In sinovenous thrombosis, the mechanism for venous infarction is obstruction of venous drainage with increasing venous pressure in the affected region of the brain. The venous congestion results in significant extravasation of fluid into the brain, producing focal cerebral edema and hemorrhage. The edema may be transient, if venous flow is re-established, or be associated with permanent tissue infarction if the increased venous blood pressure eventually exceeds the arterial blood pressure. In the latter situation, there is insufficient delivery of arterial blood and regional ischemic infarction (50). Recently, MR imaging studies utilizing diffusion- weighted imaging (DWI) have demonstrated cytotoxic edema early in acute CSVT, preceding the onset of vasogenic edema. These findings support the presence of primary neuronal injury early in venous infarction (50). Once the initial thrombus has formed, the resultant obstruction and venous stasis can promote propagation of the initial thrombus.
- 13. Anticoagulant therapy is aimed at preventing extension of the initial thrombus and allowing the fibrinolytic system to achieve dissolution of the existing thrombus. Unlike an arterial ischemic stroke, relief of venous obstruction, even if very delayed, may relieve the circulatory congestion in CSVT with clinical benefit. Figure 8. Deep venous thrombosis: male newborn born at term developed hypernatremia, dehydration, and seizures at day 8 of life; axial noncontrast CT shows bilateral thalamic hemorrhagic infarction secondary to deep venous thrombosis. Note increased density in the internal cerebral veins and the vein of Galen (arrow). Thrombotic occlusion of the superior sagittal sinus or the dominant lateral sinus interferes with the absorption of cerebrospinal fluid (CSF) through impaired function of the “arachnoid granulations” that line the superior sagittal sinus. The latter mechanism further increases the extent of cerebral swelling and results in a communicating hydrocephalus (50). In addition to the intracerebral and intravascular events in CSVT, pressure on the optic nerves secondary to raised intracranial pressure initially causes papilloedema, which if unrelieved over time can progress to permanent visual loss. Imaging of venous infarction Venous infarction may be evident on CT as a diffuse low-attenuating lesion. Mass effect is common, and, in one study, 40% of symptomatic patients showed CT evidence of hemorrhage (50). Bilateral, parasagittal, hypoattenuating lesions on CT is a common feature of venous thrombosis in the superior sagittal sinus. These lesions do not conform to an arterial distribution but do involve the cortex. Early changes are often subtle, with edema and swelling of the frontal/parietal gyri. In addition, isolated involvement of the temporal lobe is common and found in cerebral sinus thrombosis of the transverse sinus. Bilateral thalamic hypoattenuating lesions on CT may be evident in deep venous thrombosis and on non-contrast-enhanced CT, thrombus may be seen in the straight sinus. Figure 9. Deep venous thrombosis in a 27-year-old woman with antiphospholipid antibody syndrome who presented with headache, nausea, and vomiting that progressed to aphasia and a decreased level of consciousness. Axial noncontrast CT (A) and T2-weighted MRI (B) show bilateral thalamic ischemia or infarction (open arrow). On CT, a small hemorrhage is seen in the right lateral ventricle (solid arrow). (C) T1-weighted sagittal MRI demonstrates subacute thrombus in the vein of Galen and straight sinus.
- 14. Figure 10. Bilateral parasagittal hemorrhages secondary to superior sagittal sinus thrombosis (A) Axial noncontrast CT shows a high attenuation in the superior sagittal sinus (solid arrow) and bilateral parasagittal hemorrhages (open arrows). (B) Fluid- attenuated inversion-recovery sequence in another patient shows mixed-signal-intensity lesions in both frontal lobes with a fluid-fluid level (arrow) in a hematoma cavity on the left. MRI is sensitive to the parenchymal changes seen in cerebral sinus thrombosis. Cortical and subcortical high-signal-intensity lesions on fluid-attenuated inversion-recovery sequence and T2-weighted imaging may highly suggest cerebral sinus thrombosis when the lesions do not correspond to an arterial territory (50). Restriction of diffusion on diffusion-weighted imaging (DWI) with a corresponding decrease in the apparent diffusion coefficient (ADC) value is often irreversible in arterial infarction and correlates with a permanent neurologic deficit (4). Diffusion techniques have been used in cerebral sinus thrombosis to differentiate reversible ischemic tissue from irreversible ischemia (4). Preliminary results have shown some potential in predicting the prognosis of the cerebral sinus thrombosis (50). Recent investigations of cerebral sinus thrombosis have revealed that mixed signal intensity on DWI may represent both cytotoxic and vasogenic edema (50). A reduced ADC value in CVT may not correlate with neuronal death and a permanent neurologic deficit (50). Therefore, a decrease of ADC in cerebral sinus thrombosis may not have the same prognostic value as it does in arterial stroke (50), and venous ischemia may be reversible despite decreased ADC values. This correlates with the important clinical improvement that may occur after an initial major cerebral sinus thrombosis-related neurologic deficit. Figure 11. Diffusion imaging. T2-weighted (A) and fluid-attenuated inversion-recovery sequence (B) MRIs show scattered high- signal-intensity lesions (arrows). (C) Diffusion-weighted imaging demonstrates a mixed-signal-intensity area (arrow) suggesting both cytotoxic and vasogenic edema. (D) ADC map reveals that the lesions are predominantly hyperintense (arrows). Pathophysiology of cerebral sinus thrombosis and its parenchymal changes
- 15. The pathophysiology of brain parenchymal involvement in venous occlusion differs from that in arterial occlusion. Parenchymal changes may be secondary to cytotoxic edema, vasogenic edema, or intracranial hemorrhage. The primary underlying mechanism is likely to be increased venous pressure. If collateral pathways of venous drainage are insufficient, especially in the presence of cortical venous involvement, subsequent parenchymal changes may occur. If venous pressure continues to increase, with a consequent diminishment in arterial perfusion pressure, cell death may ensue. If adequate collateral pathways develop or recanalization occurs before cell death or intracranial hemorrhage, the parenchymal changes may resolve partly or completely. Vasogenic and cytotoxic edema patterns may coexist. Table 4. Effect of increased intracranial venous pressure due to sinovenous thrombosis. (50) Comment Venous thrombosis produce effects on the vein that include increase in diameter and length of the thin walled vein, kinking, folding, stenosis, and sometimes occlusion. This has been described as a hemodynamic effect caused by pressure and flow of arterial blood in a vein. In the presence of venous thrombosis, a subpial or cortical vein dilates, lengthens, and may kink at the junction with the sinus. It may also balloon to the point of rupture or thromboses The deep venous collector in the galenic malformations (the embryonic precursor to the vein of Galen) typically shows a dilatation and focal stenosis at the outlet to the straight sinus or a falcine sinus. Occasionally, this structure spontaneously thromboses. Under normal conditions, there is negative venous pressure in the dural sinuses relative to the heart. There are no valves and pulsatile flow in the sinuses. Blood is effectively sucked through the shunt rather than pushed. An increased resistance to flow occurs when the venous pressure rises. This may occur transiently during a Valsalva maneuver or chronically in severe right heart failure or when there is a stenosis in the venous sinuses due to sinus thrombosis. When there is increased venous pressure, there is a corresponding decrease in water resorption by the arachnoid granulations, which is reflected in an increased amount of water in the ventricles and subarachnoid spaces. The third and lateral ventricles become prominent, and the cerebral sulci enlarge. If the fontanelles are open, the head enlarges (macrocrania). Normally, the posterior fossa drainage relies on the petrosal sinuses draining anteriorly to the cavernous sinus and caudally to the jugular bulb. In the absence of anterior drainage and restricted caudal drainage, there is an increase in cerebellar water, which results in a small fourth ventricle and tonsillar herniation. With persistent increase of the venous pressure due to venous thrombosis, there will be reduction of the venous return, stasis of blood, or even reversal of flow of blood (cerebral venous reflux) depending on the degree of venous pressure rise. Stasis of blood in the venous sinuses predisposes to further thrombosis. Cerebral venous reflux predisposes to dilatation of superficial, deep venous system, transcerebral vein, white matter congestive encephalopathy with edema, petechial haemorrhages and mass effect. Increase of intravenous pressure often results in venous wall remodelling with increase in diameter and length of the thin walled vein, kinking, folding, stenosis, and sometimes occlusion of thrombosis. Venous infarction or ischemic cerebral changes can occur due to increased venous pressure -secondary to venous thrombosis, the mechanism for venous infarction is obstruction of venous drainage with increasing venous pressure in the affected region of the brain. The venous congestion results in significant extravasation of fluid into the brain, producing focal cerebral edema and hemorrhage. The edema may be transient, if venous flow is re-established, or be associated with permanent tissue infarction if the increased venous blood pressure eventually exceeds the arterial blood pressure. In the latter situation, there is insufficient delivery of arterial blood and regional ischemic infarction. MR imaging studies utilizing diffusion-weighted imaging (DWI) have demonstrated cytotoxic edema early in acute venous thrombosis, preceding the onset of vasogenic edema. These findings support the presence of primary neuronal injury early in venous infarction. Under normal conditions, there is negative venous pressure in the dural sinuses relative to the heart. There are no valves and pulsatile flow in the sinuses. Blood is effectively sucked through the shunt rather than pushed. An increased resistance to flow occurs when the venous pressure rises. This may occur transiently during a Valsalva maneuver or chronically in severe right heart failure or when there is a stenosis in the venous sinuses due to sinus thrombosis. Venous hypertension probably passes into three stages depending upon the degree of venous hypertension and the chronicity of the condition. Table 5. Stages of cerebral venous hypertension (50) When there is increased venous pressure, there is a corresponding decrease in water resorption by the arachnoid granulations, which is reflected in an increased amount of water in the ventricles and Stage I subarachnoid spaces. The third and lateral ventricles become prominent, and the cerebral sulci enlarge. If the fontanelles are open, the head enlarges (macrocrania). Normally, the posterior fossa drainage relies on Absence of any the petrosal sinuses draining anteriorly to the cavernous sinus and caudally to the jugular bulb. In the parenchymal changes absence of anterior drainage and restricted caudal drainage, there is an increase in cerebellar water, which results in a small fourth ventricle and tonsillar herniation. At this stage the thrombosed sinus will show the characteristic MRI signal changes but without any parenchymal changes.
- 16. With persistent increase of the venous pressure due to venous thrombosis, there will be reduction of the Stage II venous return, stasis of blood, or even reversal of flow of blood (cerebral venous reflux) depending on the degree of venous pressure rise. Stasis of blood in the venous sinuses predisposes to further thrombosis. Early cerebral Cerebral venous reflux predisposes to dilatation of superficial, deep venous system, transcerebral vein, congestive white matter congestive encephalopathy with edema, petechial haemorrhages and mass effect. Increase of encephalopathy with intravenous pressure often results in venous wall remodelling with increase in diameter and length of the reversible parenchymal thin walled vein, kinking, folding, stenosis, and sometimes occlusion of thrombosis. Parenchymal changes changes in this stage are due to reversible edema edema and petechial hemorrhage once venous flow is restored Venous infarction or ischemic cerebral changes can occur due to increased venous pressure -secondary to venous thrombosis, the mechanism for venous infarction is obstruction of venous drainage with increasing Stage III venous pressure in the affected region of the brain. The venous congestion results in significant extravasation of fluid into the brain, producing focal cerebral edema and hemorrhage. The edema may be Late cerebral transient, if venous flow is re-established, or be associated with permanent tissue infarction if the congestive increased venous blood pressure eventually exceeds the arterial blood pressure. In the latter situation, encephalopathy with there is insufficient delivery of arterial blood and regional ischemic infarction. MR imaging studies irreversible utilizing diffusion-weighted imaging (DWI) have demonstrated cytotoxic edema early in acute venous parenchymal changes thrombosis, preceding the onset of vasogenic edema. These findings support the presence of primary neuronal injury early in venous infarction. Acute dural sinus thrombosis leads to distinct stages of parenchymal changes, the severity of which depends on the degree of venous congestion, which, in turn, is closely related to intradural sinus pressure. As intradural sinus pressure increases, progression from mild parenchymal change to severe cerebral edema and/or hematoma may occur if thrombolysis is delayed. In the analysis of 29 patients with dural sinus thrombosis (by MRI, and dural sinus pressure measurement using a Tracker 18 end- hole catheter proximal to the thrombus and connected to a pressure transducer at ear level with the waveform displayed on either an Alpha 9 pressure monitor) , Fong, at al, (49) could identify five stages of brain parenchymal changes secondary of sinus thrombosis, each stage relates to the dural intrasinus pressure. Table 6. Parenchymal changes, and intrasinus pressure in dural sinus thrombosis (49) Acute dural sinus and cerebral venous thrombosis may lead to various stages of parenchymal changes of venous infarction, with the degree of severity depending on the degree of venous congestion and elevated dural sinus pressure. The prognosis of venous thrombosis depends to a significant extent on the use of thrombolytics. Severe neurologic symptoms, including coma, may be reversible if treatment with thrombolytics is started before massive cerebral edema or hemorrhage has developed. Stage I may be treated with anticoagulants alone; however, if the patient deteriorates clinically, prompt thrombolysis is probably needed. All other stages should be treated with thrombolysis. A progression from mild brain swelling to severe cerebral edema and/or hemorrhage from increasing dural sinus pressure may occur if treatment with thrombolysis is delayed. (50) Table 7. Biochemical stages of sinus thromboses (50) STAGE MRI PICTURE In the acute stage of thrombus formation (0–5 days), the signal is predominantly isointense on T1- weighted images and hypointense on T2-weighted images because of deoxyhemoglobin in red blood cells
- 17. trapped in the thrombus. A venous thrombus in the acute stage may have a signal intensity that mimics The acute a normal flow state, and such a finding may lead to diagnostic error. The signal may be very deoxyhemoglobin stage hypointense on T2-weighted images and may be mistakenly thought to indicate a flow void. According of blood products to some estimates, in 10%–30% of cases of sinus thrombosis, the thrombus at initial presentation or imaging examination is in the acute stage of formation. Contrast-enhanced MR venography or CT (days I through 5) venography is usually necessary to achieve a definitive diagnosis at this stage. In the subacute stage of thrombus development (6–15 days), the signal is predominantly hyperintense on The subacute both T1-weighted images and T2-weighted images because of methemoglobin in the thrombus. extracellular Subacute-stage thrombus has been found in 55% of patients at clinical presentation with cerebral methemoglobin stage of venous thrombosis. This stage of formation is the easiest stage at which to detect a thrombus on MR blood products (from images, as the signal intensity of the sinus is most different from that in normal flow states. The finding day 5 through day 15) of increased signal intensity on both T1-weighted images and T2-weighted images is almost always abnormal. The thrombus becomes hypointense and heterogeneous because of partial resolution and recanalization and might enhance after gadolinium administration. Enhancement within the occluded dural sinus is due to organization of the thrombus. Chronic dural sinus Chronic thrombosis with incomplete recanalization of the sinus may present a diagnostic challenge at thrombosis MR imaging. As many as 15% of patients in whom sinus thrombosis is diagnosed at MR imaging may have a chronic (>15-day-old) thrombus. Compared with the MR signal in normal brain parenchyma, the signal in a chronic thrombus is typically isointense or hyperintense on T2-weighted images and isointense on T1-weighted images; however, significant variability in thrombus signal intensity exists. The signal intensity may be similar to that of very slowly moving oxygenated blood. Sinus enhancement in sinus thrombosis is presumably secondary to an organized thrombus with intrinsic vascularization as well as to slow flow in dural and intrathrombus collateral channels. Parenchymal changes secondary to congestive encephalopathy are shown by MRI as subcortical white matter precontrast T1 hypointensity, with patchy, irregular and linear enhancement and T2 hyperintensity mixed with linear and patchy hypointensity and signal void structures. Changes are due to edema, petechial hemorrhages and dilated veins. Parenchymal changes commonly show positive mass effect and are usually focal rather than diffuse. Bilateral parenchymal changes are not uncommon. Although parenchymal changes may occur in areas of the brain that are directly drained by the occluded venous sinus, in some patients the parenchymal changes may not closely correlate with the location of venous occlusion. Parenchymal swelling without abnormalities in attenuation or signal intensity on images may occur in as many as 42% of patients with cerebral venous thrombosis. Sulcal effacement, diminished cistern visibility, and a reduction in ventricular size may occur. Patients with brain swelling and without parenchymal signal intensity changes tend to have intrasinus pressures in the intermediate range (20–25 mm Hg); however, intrasinus pressures also may be markedly elevated. Such patients typically have more prominent clinical symptoms than would be expected on the basis of imaging findings. (50) In view of the variable nature of the parenchymal abnormalities that may occur in cerebral venous thrombosis, the use of the term venous infarct in reference to these lesions should be discouraged because that term implies irreversibility. In contrast with arterial ischemic states, many parenchymal abnormalities secondary to venous occlusion are reversible. It is much better to refer to these parenchymal changes secondary to cerebral sinus thrombosis as cerebral venous encephalopathy. Persistence of parenchymal MRI signal changes over a long time might warrant the usage of the terminology venous infarction. (50) Parenchymal hemorrhage in cerebral sinus thrombosis Parenchymal hemorrhage can be seen in one-third of cases of cerebral venous thrombosis. Flame-shaped irregular zones of lobar hemorrhage in the parasagittal frontal and parietal lobes are typical findings in patients with superior sagittal sinus thrombosis and should prompt additional imaging evaluations (eg, with MR venography or CT venography). Hemorrhage in the temporal or occipital lobes is more typical of transverse sinus occlusion. Hemorrhage in cerebral venous thrombosis is typically cortical with subcortical extension. Smaller zones of isolated subcortical hemorrhage also may be seen and may be accompanied by minimal edema. MR imaging with GRE sequences is sensitive in the depiction of these zones of parenchymal hemorrhage. (50)
- 18. Figure 12. Bilateral hemorrhagic venous infarction (A) due to superior sagittal thromboses (B) The mechanism of hemorrhage in cerebral venous thrombosis is multifactorial. Hemorrhage may be precipitated by continued arterial perfusion in areas of cell death, as can be seen at reperfusion in arterial ischemia. Elevation of venous pressure beyond the limit of the venous wall also is likely operative. Hemorrhage was noted in patients with intrasinus pressures higher than 42 mm Hg but not in those with lower pressures. Contrast Enhancement Parenchymal enhancement in 1%–29% of cases of cerebral venous thrombosis has been reported. The enhancement is typically gyral in location and may extend into the white matter. Parenchymal enhancement, which indicates disruption of the blood-brain barrier, may be seen in areas of cytotoxic or vasogenic edema and in the presence of either irreversible or reversible brain abnormalities. Increased tentorial enhancement (likely related to dural venous collaterals), adjacent leptomeningeal enhancement, and prominent cortical venous enhancement (secondary to venous congestion) also may be visible after the administration of contrast material. (50) Figure 13. Axial MR image series with a color overlay represents the major superficial cortical venous drainage territories. Most of the superior cerebrum (green) is drained primarily into the superior sagittal sinus, which also receives drainage from the parasagittal cortical regions at lower levels. The sylvian veins drain blood from the peri-insular region (yellow) into the basal dural sinuses. The transverse sinuses receive blood from the temporal, parietal, and occipital lobes (blue). The Labbé vein, if dominant, may drain much of this territory. Parenchymal abnormalities such as hemorrhage or edema in this territory may be indicative of thrombosis of the transverse sinus or Labbé vein.
- 19. Figure 14. Axial MR image with color overlay shows the drainage territory of the deep cerebral veins (internal cerebral vein, vein of Galen) (pink), in which parenchymal abnormalities due to deep venous occlusion typically are found. The deep white matter (medullary) venous drainage territory (blue) also is shown. SUMMARY SUMMARY Hemorrhagic infarctions could be either due to arterial occlusion, most probably secondary to cardiac emboli, or due to venous occlusion secondary to veno-sinus thrombosis. A case of arterial hemorrhagic infarction secondary to a cardiac embolus is presented and a full discussion of hemorrhagic infarctions in general is presented in this case record. Addendum A new version of this PDF file (with a new case) is uploaded in my web site every week (every Saturday and remains available till Friday.) To download the current version follow the link "http://pdf.yassermetwally.com/case.pdf". You can also download the current version from my web site at "http://yassermetwally.com". To download the software version of the publication (crow.exe) follow the link: http://neurology.yassermetwally.com/crow.zip The case is also presented as a short case in PDF format, to download the short case follow the link: http://pdf.yassermetwally.com/short.pdf At the end of each year, all the publications are compiled on a single CD-ROM, please contact the author to know more details. Screen resolution is better set at 1024*768 pixel screen area for optimum display. Also to view a list of the previously published case records follow the following link (http://wordpress.com/tag/case-record/) or click on it if it appears as a link in your PDF reader To inspect the patient's full radiological study, click on the attachment icon (The paper clip icon in the left pane) of the acrobat reader then double click on the attached file. Click here to download the short case version of this case record in PDF format
- 20. REFERENCES References 1. Fisher CM, Adams RD. Observations on brain embolism with special reference to the mechanism of hemorrhagic infarction. J Neuropathol Exp Neurol 10: 92-94, 1951. 2. Jorgensen L, Torvik A. Ischaemic cerebrovascular diseases in an autopsy series: Part 2. Prevalence, location, pathogenesis, and clinical course of cerebral infarcts. J Neurol Sci 9: 285-320, 1969. 3. Lodder J, Krijne-Kubat B, Broekman J. Cerebral hemorrhagic infarction at autopsy: Cardiac embolic cause and the relationship to the cause of death. Stroke 17: 626-629, 1986. 4. Yamaguchi T, Minematsu K, Choki J, Ikeda M. Clinical and neuroradiological analysis of thrombotic and embolic cerebral infarction. Jpn Circ J 48: 50-58, 1984. 5. Hornig CR, DorndorfW, Agnoli AL. Hemorrhagic cerebral infarction -A prospective study. Stroke 17: 179-185, 1986. 6. Moulin T, Crepin-Leblond T, Chopard JL, Bogousslavsky J. Hemorrhagic infarcts. Eur Neurol 34: 64-77, 1993. 7. Chaves CJ, Pessin MS, Caplan LR, et al. Cerebellar hemorrhagic infarction. Neurology 46: 346-349, 1996. 8. Toni D, Fiorelli M, Bastianello S, et al. Hemorrhagic transformation of brain infarct: Predictability in the first 5 hours from stroke onset and influence on clinical outcome. Neurology 46: 341-345, 1996. 9. Lodder J. CT-detected hemorrhagic infarction: relation with the size of the infarct, and the presence of midline shift. Acta Neurol Scand 70: 329-335, 1984. 10. Cerebral Embolism Study Group. Immediate anticoagulation of embolic stroke: brain hemorrhage and management options. Stroke 15: 779-789, 1984. 11. Cerebral Embolism Study Group. Cardioembolic stroke, early anticoagulation, and brain hemorrhage. Arch Intern Med 147: 636-640, 1987. 12) Yatsu FM, Hart RG, Mohr JP, Grotta JC. Anticoagulation of embolic strokes of cardiac origin: An update. Neurology 38: 314-316, 1988. 12. Adams HP Jr, Brott TG, Furlan AJ, et al. Guideline for thrombolytic therapy for acute stroke: A supplement to the guidelines for the management of patients with acute ischemic stroke. A statement for healthcare professionals from a special writing group of the stroke council, American HeartAssociation. Stroke 27: 1711-1718, 1996. 13. Hacke W, Brott T, Caplan L, et al. Thrombolysis in acute ischemic stroke: controlled trials and clinical experience. Neurology 53 (Suppl 4): S3S14, 1999. 14. Faris AA, Hardin CA, Poser CM. Pathogenesis of hemorrhagic infarction of the brain. I. Experimental investigations of role of hypertension and of collateral circulation. Arch Neurol 9: 468-472, 1963. 15. Garcia JH, Lowry SL, Briggs L, et al. Brain Capillaries Expand and Rupture in Areas ofIschemia and Reperfusion. in: Reivich M, Hurtig HI (Eds.) Cerebrovascular Diseases. Raven Press, NewYork, 1983: 169-179. 16. Okada Y, Yamaguchi T, Minematsu K, et al. Hemorrhagic transformation in cerebral embolism. Stroke 20: 598-603, 1989. 17. Kimura K, Ogata J, Minematsu K, Yasaka M, Yamaguchi T. Massive pontine hemorrhagic infarction associated with embolic basilar artery occlusion. Intern Med 40: 658-661, 2001. 18. Ogata J, Yutani C, Imakita M, et al. Hemorrhagic infarct of the brain without a reopening of the occluded arteries in cardioembolic stroke. Stroke 20: 876-883, 1989. 19. Weisberg LA. Nonseptic cardiogenic cerebral embolic stroke: clinical-CT correlations. Neurology. 1985;35(6):896–899. 20. Ogata J, Fujishima M, Tamaki K, Nakatomi Y, Ishitsuka T, Omae T (1981) Vascular changes underlying cerebral lesions in stroke-prone spontaneously hypertensive rats. A serial section study. Acta Neuropathol (Berl) 54:183–188
- 21. 21. Wagner KR, Kleinholz M, de Courten-Myers GM, Myers RE.: (1992) Hyperglycemic versus normoglycemic stroke: topography of brain metabolites, intracellular pH, and infarct size. J Cereb Blood Flow Metab. 1992 Mar;12(2):213-22. [Abstract] 22. Broderick JP, Hagen T, Brott T, Tomsick T: Hyperglycemia and hemorrhagic transformation of cerebral infarcts. Stroke. 1995 Mar;26(3):484-7. 23. Berger C, Fiorelli M, Steiner T, et al. Hemorrhagic Transformation of Ischemic Brain Tissue: Asymptomatic or Symptomatic? Stroke. 2001; 32: 1330-1335. 24. Giuseppe Micieli, Simona Marcheselli, Piera Angela Tosi. Safety and efficacy of alteplase in the treatment of acute ischemic stroke. Vascular Health and Risk Management 2009;5: 397-409. 25. Savitz SI, Lew R, Bluhmki E, et al. Shift analysis versus dichotomization of the modified Rankin scale outcome scores in the NINDS and ECASS II trials. Stroke. 2007; 38: 3205-3212. 26. Caplan LR. Stroke thrombolysis: slow progress. Circulation. 2006;114:187-190. 27. Sumii T, Lo EH. Involvement of matrix metalloproteinase in thrombolysis-associated hemorrhagic transformation after embolic focal ischemia in rats. Stroke. 2002;33:831-836. 28. Giuseppe Micieli, Simona Marcheselli, Piera Angela Tosi. Safety and efficacy of alteplase in the treatment of acute ischemic stroke. Vascular Health and Risk Management 2009;5: 397-409. 29. Montaner J, Molina CA, Monasterio J, et al. Matrix metalloproteinase-9 pretreatment level predicts intracranial hemorrhagic complications after thrombolysis in human stroke. Circulation. 2003;107:598-603. 30. Derex L, Hermier M, Adeleine P, et al. Clinical and imaging predictors of intracerebral hemorrhage in stroke patients treated with intravenous tissue plasminogen activator. J Neurol Neurosurg Psychiatry.2005;76:70-75. 31. Cocho D, Borrell M, Marti-Fabregas J, et al. Pretreatment hemostatic markers of symptomatic intracerebral hemorrhage in patients treated with tissue plasminogen activator. Stroke. 2006;37:996-999. 32. Berrouschot J, R0ther J, Glahn J, et al. Outcome and severe hemorrhagic complications of intravenous thrombolysis with tissue plasminogen activator in very old stroke patients. Stroke. 2005;36:2421-2425. 33. Heuschmann PU, Kolominsky-Rabas PL, Roether J, et al. Predictors of in-hospital mortality in patients with acute ischemic stroke treated with thrombolytic therapy. JAMA. 2004;292:1831-1838 34. Ribo M, Montaner J, Molina CA, et al. Admission fibrinolytic profile is associated with symptomatic hemorrhagic transformation in stroke patients treated with tissue plasminogen activator. Stroke. 2004;35:2123-2127. 35. Capes SE, Hunt D, Malmberg K, et al. Stress hyperglycemia and prognosis of stroke in nondiabetic and diabetic patients: a systematic overview. Stroke. 2001;32:2426-2432. 36. Lindsbert P. Brain tissue salvage in acute stroke. Neurocrit Care. 2004;1:301-308. 37. Kase CS, Furlan AJ, Wechsler LR, et al. Cerebral hemorrhage after intra-arterial thrombolysis for ischemic stroke: the PROACT II trial.Neurology. 2001;57:1603-1610. 38. Barak ERJ, Kamalian S, Rezai Gharai L, et al. Does hyperacute diffusion and perfusion weighted imaging predict outcome in acute ischemic stroke. International Stroke Conference. 2008; 39: 607. 39. Barber PA, Demchuk AM, Zhang J, et al. Validity and reliability of a quantitative computed tomography score in predicting outcome of hyperacute stroke before thrombolytic therapy. ASPECTS Study Group. Alberta Stroke Programme Early CT Score. Lancet. 2000;355:1670-1674. 40. Neumann-Haefelin T, Hoelig S, Berkefeld J, et al. Leukoaraiosis is a risk factor for symptomatic intracerebral hemorrhage after thrombolysis for acute stroke. Stroke. 2006;37:2463-2466. 41. Kakuda W, Thijs VN, Lansberg MG, et al. Clinical importance of microbleeds in patients receiving IV thrombolysis. Neurology. 2005;65:1175-1178.
- 22. 42. Fiehler J, Albers GW, Boulanger JM, et al. Bleeding risk analysis in stroke imaging before thromboLysis (BRASIL): pooled analysis of T2*-weighted magnetic resonance imaging data from 570 patients. Stroke. 2007;38:2738-2744. 43. Thomalla G, Sobesky J, Kohrmann M, et al. Two tales: hemorrhagic transformation but not parenchymal hemorrhage after thrombolysis is related to severity and duration of ischemia. MRI study of acute stroke patients treated with intravenous tissue plasminogen activator within 6 hours. Stroke. 2007;38:313-318. 44. Hacke W, Kaste M, Bluhmki E, et al. Thrombolysis with Alteplase 3 to 4.5 hours after Acute Ischemic Stroke. N Engl J Med. 2008; 359: 1317-1329. 45. Metwally Y. Onlines newspapers. Cerebrovascular disorders (stroke) 2010. Available from: http://yassermetwally.com/ 46. Metwally Y. Onlines newspapers. Medical management of stroke 2010. Available from: http://yassermetwally.com/ 47. Metwally Y. Onlines newspapers. Thrombolytic therapy in stroke management 2010. Available from: http://yassermetwally.com/ 48. Von Kummer R. Early major ischemic changes on computed tomography should preclude use of tissue plasminogen activator. Stroke.2003; 34: 820-821. 49. Fong Y. Tsai, Ay-Ming Wang, Violet B. Matovich, Mark Lavin, Bruce Berberian, Tereasa M, at al: MR Staging of Acute Dural Sinus Thrombosis: Correlation with Venous Pressure Measurements and Implications for Treatment and Prognosis. Am J Neuroradiol 16:1021–1029, May 1995 50. Metwally, MYM: Textbook of neuroimaging, A CD-ROM publication, (Metwally, MYM editor) WEB-CD agency for electronic publication, version 11.2a. April 2010