SlideShare uma empresa Scribd logo
1 de 17
Baixar para ler offline
WESTERN EUROPE B2C E-COMMERCE AND ONLINE PAYMENT MARKET 2019
PUBLICATION DATE: OCTOBER 2019
PAGE 2 GENERAL INFORMATION I PAGE 3 KEY FINDINGS I PAGE 4-9 TABLE OF CONTENTS I PAGE 10 REPORT-SPECIFIC SAMPLE
CHARTS I PAGE 11 METHODOLOGY I PAGE 12 RELATED REPORTS I PAGE 13 CLIENTS I PAGE 14-15 FREQUENTLY ASKED QUESTIONS
PAGE 16 ORDER FORM I PAGE 17 TERMS AND CONDITIONS
2
2
PRODUCT DETAILS Title:
Type of Product:
Category:
Covered Regions:
Covered Countries:
Language:
Formats:
Number of Charts:
Western Europe B2C E-Commerce and Online Payment Market 2019
Report
B2C E-Commerce, Online Payment
Western Europe
UK, Germany, France, Spain, Italy
English
PDF & PowerPoint
169
PRICES* Single User License:
Site License:
Global Site License:
€ 2,450 (exc. VAT)
€ 3,675 (exc. VAT)
€ 4,900 (exc. VAT)
We occasionally offer a discount on selected reports as newer reports are published.
Please see the most up-to-date pricing on our website www.ystats.com.
QUESTIONS
ANSWERED
IN THIS REPORT
What are the top trends and forecasts for B2C E-Commerce in Western Europe?
How are the online retail sales in the EU-5 projected to evolve through 2022?
Which payment methods are preferred by online shoppers in Western Europe?
What are the major online and mobile payment trends in this region?
Who are the leaders of the B2C E-Commerce competition in the EU-5?
SECONDARY MARKET
RESEARCH
Our reports are exclusively based on secondary market research. Our researchers derive
information and data from a variety of reliable published sources and compile the data into
understandable and easy-to-use formats.
ADVANTAGES Maximum Objectivity
Reliable Sources
Up-To-Date Analysis
Boardroom-Ready PowerPoint Presentations
Guidance For Strategic Company Decisions
WESTERN EUROPE B2C E-COMMERCE AND ONLINE PAYMENT MARKET 2019
THE E-COMMERCE PAYMENT LANDSCAPE IN WESTERN EUROPE IS EVOLVING
Western Europe is leading the Old Continent by online retail sales as of
2019. The region’s top 5, the UK, Germany, France, Spain and Italy, are seeing an
increased share of overall retail sales generated online. In the UK, this share nears
20% in 2019, while in Germany it topped 10% in 2018, according to statistics cited
in the yStats.com. Due to this level of maturity, B2C E-Commerce sales in the EU-5
are projected to increase at declining annual growth rates through 2022.
Major online shopping trends in Western Europe include the rapid growth of
mobile and cross-border E-Commerce sales, along with the emergence of
omnichannel services and innovative purchase channels, such as digital voice
assistants. The payments landscape in E-Commerce is also evolving amidst the
adoption of PSD2 and Strong Customer Authentication (SCA) requirements, along
with changing consumer preferences, the yStats.com report reveals.
Credit and debit cards still held the leading position in terms of E-Commerce
payments share in Europe in 2018. However, there is a clear trend towards the rise
of alternative payment methods, especially digital wallets. PayPal and similar
solutions already occupy the top rank by online shoppers’ preference in some
Western European markets including Italy and Spain. Mobile wallets such as Apple
Pay and Google Pay have not yet gained much acceptance among Europe’s online
shoppers, but their adoption is increasing.
WESTERN EUROPE B2C E-COMMERCE AND ONLINE PAYMENT MARKET 2019
3
MANAGEMENT SUMMARY
REGIONAL OVERVIEW
 B2C E-Commerce Sales in Europe, in EUR billion, and Year-on-Year Change, in %, 2013 - 2019f
 Breakdown of B2C E-Commerce Sales in Europe by Sub-Regions, in %, 2018
 Retail E-Commerce Sales in the EU5, in USD billion, and Year-on-Year Change, in %, 2018-2022f
 Top 10 Countries Worldwide by Retail E-Commerce Sales, in USD billion, by Canada, China, India, Germany, France,
Japan, Russia, South Korea, the UK, the USA, 2018 & 2019f
 Retail E-Commerce Sales in the EU5, in USD billion, by Country, 2019f
 Top Product Categories Purchased Online, in % of Online Shoppers in the EU, 2018
 Internet Penetration in the EU, by Country, in % of Individuals, 2012 – 2018
 Online Shopper Penetration in the EU, by Country, in % of Individuals, 2012 – 2018
 Cross-Border Online Shopper Penetration in the EU, by Country, in % of Online Shoppers,
 2017 & 2018
 Product Categories Purchased Online, in % of Individuals, by Belgium, Germany, France, Italy, the Netherlands, the
Nordics, Spain and the UK, May 2018
 Breakdown of Maximum Acceptable Delivery Times, in % of Online Shoppers, by Belgium, Germany, France, Italy, the
Netherlands, the Nordics, Spain and the UK, May 2018
 Online and Mobile Payment Trends and News about Players, February 2019
 Breakdown of E-Commerce Transactions by Payment Method, in %, April 2018
 Top Payment Methods Preferred in E-Commerce, in % of Online Shoppers, 2016 - 2018
 Payment Methods Preferred in Online Shopping, in % of Online Shoppers, by Belgium, Germany, France, Italy, the
Netherlands, the Nordics, Spain and the UK, May 2018
 Top Payment Methods Preferred in E-Commerce, in % of Online Shoppers, by Selected Countries, 2018
 Share of Internet Users Who Say They Would Never Use Selected Payment Providers to Pay for Goods and Services
(Online or In-Store), in % of Internet Users, April 2018
 Attitudes to Security of Online Shopping, incl. Payment-Related, in % of Online Shoppers, by the UK, Germany and
Austria, April 2018
 Payment Methods Accepted in Online Stores, in % of Online Stores, February 2018
 Overview of Strong Customer Authentication Requirements Under PSD2, April 2019
 Overview of The Strong Customer Authentication Perceptions by Industry Participants, June 2019
 E-Commerce Merchants’ Readiness to Support Strong Customer Authentication, in %, November 2018
 Levels of Awareness and Preparation of E-Commerce Merchants to Strong Customer Authentication Requirements,
by SMEs and Large Businesses, June 2019
 Share of Consumers Who Are Unaware of the Strong Customer Authentication Requirements for Online Purchases,
in %, June 2019
 Share of Consumers Who Prefer One-time Passcodes for Authentication, Compared to Fingerprint Recognition, in %,
June 2019
 Barriers to Buying Online, in % of Online Shoppers, July 2018
 Mobile Payment Transaction Value in the EU-7, in EUR billion, and Year-on-Year Change, in %, 2016-2022f
 Breakdown of Mobile Payment Transaction Value in the EU-7 by Payment Types, in %, 2022f
 Mobile Wallet User Penetration, in % of Respondents, by France, Germany, Spain and the UK, 2018
 Main Barriers to Mobile Payment Adoption, in % of Respondents, by France, Germany, Spain and the UK, 2018
UK
3.1. TRENDS
 B2C E-Commerce Market Overview and International Comparisons, September 2019
 M-Commerce Sales, in GBP billion, 2019f & 2024f
2
WESTERN EUROPE B2C E-COMMERCE AND ONLINE PAYMENT MARKET 2019
TABLE OF CONTENTS (1 OF 6)
4
1
3
5
5
UK (CONT.)
3.1. TRENDS (CONT.)
 Key Figures about Click and Collect, incl. Click & Collect Growth Rate, 2018-2023f, Click & Collect Sales, in GBP billion,
2023f, Click & Collect Share of Total E-Commerce Sales, in %, 2023f, Clothing and Footwear’s Share of Click & Collect
Sales, in %, 2018, Click & Collect Customer Satisfaction Rate, in %, 2018, and Share of Customers Who Bought an
Additional Item When Collecting an Order, in %, 2018
 Cross-Border Online Shopper Penetration, by Online Shoppers Buying From Other EU Countries and from the Rest
of the World, in % of Online Shoppers in the UK, 2013 - 2019
3.2. SALES & SHARES
 Retail E-Commerce Sales, in GBP billion, and Share of Total Retail Sales, in %, 2017 – 2023f
 Retail E-Commerce Sales, in GBP billion, 2018 & 2023f
 B2C E-Commerce Share of Total Retail Sales, in %, 2013 – 2018 & Q1-Q2 2019
3.3. INTERNET USERS & ONLINE SHOPPERS
 Number of Internet Users, in millions, and Penetration, in % of Adults, by Frequency of Use, 2013 - 2019
 Online Shopper Penetration, in % of Adults, 2013-2019
 Online Shopper Penetration, in % of Adults, by Age Group and Gender, 2013 - 2019
 Breakdown of Frequency of Shopping Online During a Three-Month Period, in % of Online Shoppers, by Age Group
and Gender, 2019
 Breakdown of Online Spending During a Three-Month Period, in GBP, in % of Online Shoppers, by Age Group and
Gender, 2019
3.4. PRODUCTS
 Product Categories Purchased Online, in % of Adults, 2019
 Online Grocery Sales, in GBP billion, 2018, 2019f & 2023f
3.5. PAYMENT
 Breakdown of E-Commerce Transactions by Payment Method, in %, April 2018
 Top 10 Reasons for Shopping Cart Abandonment, in % of Online Shoppers, 2018e
 Share of Online Shoppers Who Want Merchants to Offer a Range of Payment Options, in %, July 2018
 Share of Online Shoppers Who Have Abandonment an Online Transaction Due to the Payment Process, in %, 2014 &
2018
 Attitudes to Slow Payment Process, in % of Online Shoppers, July 2018
 E-Commerce Fraud Loss on UK-Issued Cards, in GBP million, and Share of Total Card Purchase Fraud Loss, in %,
2013 - 2018
 Breakdown of Consumers’ Perception of Whether They Currently Undergo Enough Security Checks When Making an
Online Payment, in % of Consumers, 2018
 Breakdown of the Preferred Way of Receiving a One-time Passcode to Verify a Payment Transaction, in % of
Consumers, 2018
 Knowledge of Technology Trends, incl. Mobile Payments, in % of Consumers, 2016 - 2018
 Innovative Payment Methods That Millennial Online Shoppers Plan to Use in the Future, July 2018
 Current and Future Use of Apple Pay, Google Pay and Samsung Pay, Compared to Debit/Credit Cards, in % of Online
Shoppers, by Age Group, July 2018
 Usage of FinTech Disruptors Compared to Banks, in % of Internet Users, July 2018
3.6. DELIVERY
 Delivery-Related Reasons for Shopping Cart Abandonment, in % of Online Shoppers Who Abandoned a Shopping
Cart for a Delivery-Related Reason, 2018
WESTERN EUROPE B2C E-COMMERCE AND ONLINE PAYMENT MARKET 2019
TABLE OF CONTENTS (2 OF 6)
3
6
6
UK (CONT.)
3.7. PLAYERS
 Top 10 E-Commerce Websites by Audience Reach, in % of Internet Users, September 2018
 Breakdown of Frequency of Purchasing from Amazon, in % of Consumers, February 2019
GERMANY
4.1. TRENDS
 B2C E-Commerce Market Overview and International Comparisons, September 2019
 Devices Used for Shopping Online, in % of Online Shoppers, 2017 & 2018
 Breakdown of Research and Purchase Channels Used, in % of Consumers, 2015, 2019e & 2021f
 Breakdown of Awareness of Click & Collect, in %, 2018
4.2. SALES & SHARES
 B2C E-Commerce Sales, in EUR billion, by Three Comparative Estimates, and CAGR, in %, 2017 – 2023f
 B2C E-Commerce Share of Total Retail Sales, in %, by Two Comparative Estimates, 2017 - 2023f
4.3. INTERNET USERS & ONLINE SHOPPERS
 Number of Internet Users, in millions, and Penetration, in % of Individuals, 2012 – 2018
 Number of Online Shoppers, in millions, and Penetration, in % of Internet Users, 2012 - 2018
4.4. PRODUCTS
 Product Categories Purchased Online, in % of Online Shoppers, 2017 & 2018
 B2C E-Commerce Sales, by Product Category, in EUR billion, 2017 & 2018
4.5. PAYMENT
 Breakdown of B2C E-Commerce Product Sales by Payment Methods, in %, 2017 & 2018
 Payment Methods Preferred in E-Commerce, by Type of Seller Purchased From, in % of Online Shoppers, April 2018
 Breakdown of Attitude to Paying by Invoice, in % of Online Shoppers, April 2018
 Breakdown of Importance of Payment Topics in Merchants’ Payment Strategy Until 2020, in % of E-Commerce
Merchants, 2018
 Payment Methods that E-Commerce Merchants Plan to Start Accepting in 2018/2019, in % of E-Commerce
Merchants, 2018
 Share of E-Commerce Merchants Who Faced Fraud or Fraud Attempts in Their Online Shops, in %, 2018
 Perceived Development of Fraud and Fraud Attempts Over the Past Year, in % of E-Commerce Merchants, 2018
 Types of Fraud and Fraud Attempts Faced by E-Commerce Merchants in Their Online Stores, in % of E-Commerce
Merchants, 2018
 Measures Taken by E-Commerce Merchants to Prevent Fraud in Their Online Stores, in % of E-Commerce Merchants,
2018
 Breakdown of Usage of 3D Secure for Credit Card Payments, in % of E-Commerce Sellers, 2017 - 2019
 Breakdown of the Perceived Change in Shopping Cart Abandonment Rates After Choosing Credit Card Payment as a
Result of 3D Secure, in % of E-Commerce Sellers Using 3D Secure, 2019
 Preference for Paying via Smartphone Compared to Cash and Cards, by Type of Payment, in % of Consumers,
August 2018
 Mobile Payment User Penetration, in % of Consumers, and Mobile Payment Apps Used, in % of Mobile Payment
Users, August 2018
 Most Trusted Mobile Payment Providers, in % of Consumers, August 2018
WESTERN EUROPE B2C E-COMMERCE AND ONLINE PAYMENT MARKET 2019
TABLE OF CONTENTS (3 OF 6)
3
4
7
7
UK (CONT.)
4.6. DELIVERY
 Criteria Applied to Choosing an Online Shop to Buy From, in % of Online Shoppers, 2018
4.7. PLAYERS
 Breakdown of B2C E-Commerce Sales by Player Type, in %, 2018
 Amazon’s Market Share of B2C E-Commerce Sales, in %, 2018
 Top 10 Online Shops, by Sales, in EUR million, 2018
FRANCE
5.1. TRENDS
 M-Commerce Share of B2C E-Commerce Sales, in %, 2014 - 2018
 M-Commerce Share of Retail E-Commerce Sales, in %, 2019f
 Devices Used for Shopping Online, in % of Online Shoppers, 2018
5.2. SALES & SHARES
 B2C E-Commerce Sales, in EUR billion, 2016 - 2019f
 B2C E-Commerce Share of Retail E-Commerce Sales, in %, 2018
 Retail E-Commerce Sales, in EUR billion, and Share of Total Retail Sales, in %, 2017 – 2023f
5.3. INTERNET USERS & ONLINE SHOPPERS
 Internet Penetration, in % of Individuals, 2012 - 2018
 Online Shopper Penetration, in % of Individuals, 2012 - 2018
5.4. PRODUCTS
 Product Categories Purchased Online, in % of Online Shoppers, 2017 & 2018
5.5. PAYMENT
 Breakdown of B2C E-Commerce Sales by Payment Methods, in %, 2018
 Payment Methods Preferred in E-Commerce, in % of Online Shoppers, July 2018
 Attitude Towards Alternative Payment Methods in E-Commerce, in % of Online Shoppers, March 2018
 Breakdown of Main Barriers That Make Consumers Hesitant to Purchase Online, in %, by Total Population and
Online Shoppers, June 2018
 Share of 3D Secure Payments, in % of Online Card Payments, April 2011 – April 2018
 Top 5 Services and Obligations of E-Commerce Merchants in 2019 According to Online Shoppers, in % of Online
Shoppers, December 2018
 Preferred Biometric Authentication Methods in E-Commerce, in % of Online Shoppers, 2019
 Breakdown of Attitudes Towards Mobile Payments, in % of Internet Users, February 2018
5.6. DELIVERY
 Delivery Methods Used in E-Commerce, in % of Online Shoppers, 2018
5.7. PLAYERS
 Online Merchants’ Share of Total B2C E-Commerce Websites and B2C E-Commerce Market Sales, by Annual B2C E-
Commerce Turnover, in %, 2017 & 2018
 Top 5 E-Commerce Websites by Number of Monthly Visitors, in millions, Q1 2019
 Top 10 Online Shops, by Sales, in EUR million, 2018
5
WESTERN EUROPE B2C E-COMMERCE AND ONLINE PAYMENT MARKET 2019
TABLE OF CONTENTS (4 OF 6)
4
8
8
SPAIN
6.1. TRENDS
 Devices Used for Shopping Online, in % of Online Shoppers, June 2019
 Breakdown of Research & Purchase Channels Used, in % Online Shoppers, June 2019
6.2. SALES & SHARES
 B2C E-Commerce Sales, in EUR billion, and Year-on-Year Change, in %, 2015 - 2019f
 B2C E-Commerce Share of Retail Sales, in %, 2018 & 2022f
6.3. INTERNET USERS & ONLINE SHOPPERS
 Internet Penetration, in % of Individuals, 2012 - 2018
 Online Shopper Penetration, in % of Individuals, 2012 - 2018
6.4. PRODUCTS
Product Categories Purchased Online, in % of Online Shoppers, 2017 & 2018
6.5. PAYMENT
 Payment Methods Used in E-Commerce, in % of E-Commerce Professionals, July 2018
 Payment Methods Used in E-Commerce, in % of Online Shoppers, 2017 & 2018
 Breakdown of Factors Most Important in Online Payment Methods, in % of Online Shoppers, October 2018
 Breakdown of Preferred Payment Methods, by Store Type, incl. Online, in % of Internet Users, June 2018
6.6. DELIVERY
 Factors Most Important to Customer Satisfaction in E-Commerce, in % of Online Shoppers, June 2019
6.7. PLAYERS
 Top 10 Online Shops, by Sales, in EUR million, 2018
 Top 5 Online Shops by Number of Orders, in millions, 2018
ITALY
7.1. TRENDS
 M-Commerce Sales, in EUR billion, and M-Commerce Share of B2C E-Commerce Sales, in %, 2017 – 2019f
 Cross-Border Imports Share of B2C E-Commerce Sales, in %, 2018e
7.2. SALES & SHARES
 B2C E-Commerce Sales, in EUR billion, 2015 – 2019f
 B2C E-Commerce Share of Retail Sales, in %, 2018 & 2019f
7.3. INTERNET USERS & ONLINE SHOPPERS
 Internet Penetration, in % of Individuals, 2012 - 2018
 Online Shopper Penetration, in % of Individuals, 2012 - 2018
7.4. PRODUCTS
 Breakdown of B2C E-Commerce Sales by Products and Services, in %, 2015 – 2019f
 B2C E-Commerce Sales by Category, by Products and Services, in EUR million, and Year-on-Year Change, in %, 2018 &
2019f
 Product Categories Purchased Online, in % of Online Shoppers, 2017 & 2018
6
WESTERN EUROPE B2C E-COMMERCE AND ONLINE PAYMENT MARKET 2019
TABLE OF CONTENTS (5 OF 6)
7
9
9
ITALY (CONT.)
7.5. PAYMENT
 Payment Methods Preferred in E-Commerce, in % of Online Shoppers, July 2018
 Breakdown of the Number of Online Purchase Transactions by Payment Methods, in %, Q1 2018
 Breakdown of Number of Online Purchase Transactions by Payment Methods, by Purchase of Physical Products and
of Digital Goods and Services, in %, Q1 2018
 Average Online Purchase Transaction Value by Payment Method, in EUR, Q1 2018
 Breakdown of Awareness and Usage of New FinTech Services, in % of Internet Users, 2018
7.6. DELIVERY
 New Delivery Options Introduced, in % of E-Commerce Companies, 2018
7.7. PLAYERS
 Top 10 Online Shops, by Sales, in EUR million, 2018
WESTERN EUROPE B2C E-COMMERCE AND ONLINE PAYMENT MARKET 2019
TABLE OF CONTENTS (6 OF 6)
7
10
10
WESTERN EUROPE B2C E-COMMERCE AND ONLINE PAYMENT MARKET 2019
REPORT-SPECIFIC SAMPLE CHARTS
GENERAL METHODOLOGY OF OUR MARKET REPORTS
Secondary Market Research
 The reports are compiled based on secondary market research.
Secondary research is information gathered from previously published
sources. Our reports are solely based on information and data acquired
from national and international statistical offices, industry and trade
associations, business reports, business and company databases,
journals, company registries, news portals and many other reliable
sources. By using various sources we ensure maximum objectivity for all
obtained data. As a result, companies gain a precise and unbiased
impression of the market situation.
 Cross referencing of data is conducted in order to ensure
validity and reliability.
 The source of information and its release date are provided on
every chart. It is possible that the information contained in one chart is
derived from several sources. If this is the case, all sources are mentioned
on the chart.
 The reports include mainly data from the last 12 months prior
to the date of report publication. Exact publication dates are mentioned in
every chart.
Definitions
 The reports take into account a broad definition of B2C E-
Commerce, which might include mobile commerce. As definitions may
vary among sources, exact definition used by the source (if available) is
included at the bottom of the chart.
Chart Types
 Our reports include text charts, pie charts, bar charts, rankings,
line graphs and tables. Every chart contains an Action Title, which
summarizes the main idea/finding of the chart and a Subtitle, which
provides necessary information about the country, the topic, units or
measures of currency, and the applicable time period(s) to which the data
refers. With respect to rankings, it is possible that the summation of all
categories amounts to more than 100%. In this case, multiple answers were
possible, which is noted at the bottom of the chart.
Report Structure
 Reports are comprised of the following elements, in the following
order: Cover page, preface, legal notice, methodology, definitions, table of
contents, management summary (summarizing main information
contained in each section of report) and report content (divided into
sections and chapters). When available, we also include forecasts in our
report content. These forecasts are not our own; they are published by
reliable sources. Within Global and Regional reports, we include all major
developed and emerging markets, ranked in order of importance by using
evaluative criteria such as sales figures.
Notes and Currency Values
 If available, additional information about the data collection, for
example the time of survey and number of people surveyed, is provided in
the form of a note. In some cases, the note (also) contains additional
information needed to fully understand the contents of the respective data.
 When providing information about amounts of money, local
currencies are most often used. When referencing currency values in the
Action Title, the EUR values are also provided in brackets. The conversions
are always made using the average currency exchange rate for the
respective time period. Should the currency figure be in the future, the
average exchange rate of the past 12 months is used.
METHODOLOGY OF OUR WESTERN EUROPE B2C E-COMMERCE AND ONLINE PAYMENT MARKET 2019
Report Coverage
 This report covers the B2C E-Commerce & Online Payment
market in Western Europe. In addition to the regional information and
country comparisons, the top 5 markets in this region are covered in-
depth, including France, Germany, Italy, Spain, and the UK. A broad
definition of retail E-Commerce used by some original sources cited in this
report might include both B2C and C2C E-Commerce.
 The report contains relevant information about international
comparisons, market trends, E-Commerce sales and shares, Internet
users and shoppers, products, delivery and players, as well as payment
methods, trends in online payment security. In addition, information
about mobile payments was included, with a focus on remote mobile
payments; however, some sources cited in the report included both in-
store and remote mobile payments in their definitions.
Report Structure
 The report starts with an overview of the regional E-Commerce
market, regional and country comparisons in terms of criteria relevant to
B2C E-Commerce, such as sales, Internet and online shopper penetration.
The rest of the report is divided into country chapters, presented in the
descending order of retail E-Commerce sales. Data availability varied by
country.
 Each country description starts with the “Trends” section that
highlights relevant market trends, such as M-Commerce, omnichannel, and
cross-border online shopping.
 The section “Sales & Shares” covers the development of B2C E-
Commerce sales and E-Commerce’s share of total retail sales. For top
markets in the region, information from several sources was provided for
cross-referencing.
 In the “Users & Shoppers” section, information about Internet
penetration and online shoppers is included.
 Afterwards, the section “Products” shows the leading product
categories purchased online.
 The next section, “Payment”, covers the payment methods most
used by online shoppers, mobile payment trends and attitudes of online
shoppers and merchants to payment security in E-Commerce.
 Furthermore, the “Delivery” section covers information related to
delivery in E-Commerce.
 Finally, the “Players” section includes information about the
leading E-Commerce companies, including rankings of top online shopping
platforms by sales, website visits, awareness and usage rates by online
shoppers, where available.
 For the top two B2C E-Commerce markets in the region, the UK
and Germany, the country descriptions start with an overview chart,
highlighting the overall B2C E-Commerce development.
WESTERN EUROPE B2C E-COMMERCE AND ONLINE PAYMENT MARKET 2019
11
Western Europe B2C E-Commerce Market 2019 October 2019 € 1,950
Central Asia & Caucasus B2C E-Commerce Market 2019: Kazakhstan, Azerbaijan, Georgia May 2019 € 950
CIS B2C E-Commerce Market 2019
Kazakhstan B2C E-Commerce Market 2019
May 2019
May 2019
€ 1,950
€ 750
Europe Online Payment Methods 2019 February 2019 € 1,950
Europe Online Payment Fraud and Security 2019 July 2019 € 750
Global Payment Innovation Trends 2019 July 2019 € 950
Fraud and Security in Global Online Payments 2019 July 2019 € 1,950
Global Digital Payment Forecasts 2019-2022 May 2019 € 1,450
Global Mobile Wallets 2019 April 2019 € 1,950
Global Mobile Payment Methods 2019 March 2019 € 1,950
Global Online Payment Methods 2019 March 2019 € 2,950
Asia-Pacific B2C E-Commerce Market 2019 September 2019 € 3,950
Southeast Asia B2C E-Commerce Market 2019 September 2019 € 1,950
Africa B2C E-Commerce Market 2019 June 2019 € 1,950
MENA B2C E-Commerce Market 2019 June 2019 € 2,950
Middle East B2C E-Commerce Market 2019 April 2019 € 2,450
North America B2C E-Commerce Market 2018 November 2018 € 950
Latin America B2C E-Commerce Market 2018 November 2018 € 1,950
Global Online Travel Market 2018 October 2018 € 1,950
Global Cross-Border B2C E-Commerce 2018 September 2018 € 2,950
Global B2B E-Commerce Market 2018 September 2018 € 1,950
UPCOMING RELATED REPORTS
REPORT
PUBLICATION
DATE
PRICE*
Eastern Europe B2C E-Commerce Market 2019
Eastern Europe B2C E-Commerce & Online Payment Market 2019
Europe B2C E-Commerce Market 2019
Europe B2C E-Commerce & Online Payment Market 2019
October 2019
October 2019
October 2019
October 2019
€ 1,950
€ 2,450
€ 2,950
€ 3,950
12
WESTERN EUROPE B2C E-COMMERCE AND ONLINE PAYMENT MARKET 2019
13
14
15
16
17

Mais conteúdo relacionado

Mais procurados

Global B2C E-Commerce Trends Report 2013 by yStats.com
Global B2C E-Commerce Trends Report 2013 by yStats.comGlobal B2C E-Commerce Trends Report 2013 by yStats.com
Global B2C E-Commerce Trends Report 2013 by yStats.com
yStats.com
 

Mais procurados (19)

Product Brochure: BRIC B2C E-commerce Markets 2014
Product Brochure: BRIC B2C E-commerce Markets 2014Product Brochure: BRIC B2C E-commerce Markets 2014
Product Brochure: BRIC B2C E-commerce Markets 2014
 
Product Brochure: Europe B2C E-Commerce 2017
Product Brochure: Europe B2C E-Commerce 2017Product Brochure: Europe B2C E-Commerce 2017
Product Brochure: Europe B2C E-Commerce 2017
 
Product Brochure: Europe Online Payment Fraud And Security 2019
Product Brochure: Europe Online Payment Fraud And Security 2019Product Brochure: Europe Online Payment Fraud And Security 2019
Product Brochure: Europe Online Payment Fraud And Security 2019
 
Product Brochure: Malaysia B2C E-Commerce Market 2019
Product Brochure: Malaysia B2C E-Commerce Market 2019Product Brochure: Malaysia B2C E-Commerce Market 2019
Product Brochure: Malaysia B2C E-Commerce Market 2019
 
Global B2C E-Commerce Trends Report 2013 by yStats.com
Global B2C E-Commerce Trends Report 2013 by yStats.comGlobal B2C E-Commerce Trends Report 2013 by yStats.com
Global B2C E-Commerce Trends Report 2013 by yStats.com
 
Product Brochure: Singapore B2C E-Commerce Market 2019
Product Brochure: Singapore B2C E-Commerce Market 2019Product Brochure: Singapore B2C E-Commerce Market 2019
Product Brochure: Singapore B2C E-Commerce Market 2019
 
Product Brochure: India B2C E-Commerce Market 2019
Product Brochure: India B2C E-Commerce Market 2019Product Brochure: India B2C E-Commerce Market 2019
Product Brochure: India B2C E-Commerce Market 2019
 
Product Brochure: Middle East B2C E-Commerce Market 2019
Product Brochure: Middle East B2C E-Commerce Market 2019Product Brochure: Middle East B2C E-Commerce Market 2019
Product Brochure: Middle East B2C E-Commerce Market 2019
 
Product Brochure: Eastern Europe B2C E-Commerce Market 2015
Product Brochure: Eastern Europe B2C E-Commerce Market 2015Product Brochure: Eastern Europe B2C E-Commerce Market 2015
Product Brochure: Eastern Europe B2C E-Commerce Market 2015
 
Product Brochure: Europe B2C E-Commerce Market 2016
Product Brochure: Europe B2C E-Commerce Market 2016Product Brochure: Europe B2C E-Commerce Market 2016
Product Brochure: Europe B2C E-Commerce Market 2016
 
Product Brochure: Europe Cross-Border B2C E-Commerce 2018
Product Brochure: Europe Cross-Border B2C E-Commerce 2018Product Brochure: Europe Cross-Border B2C E-Commerce 2018
Product Brochure: Europe Cross-Border B2C E-Commerce 2018
 
Product Brochure: Eastern Europe B2C E-Commerce Market 2018
Product Brochure: Eastern Europe B2C E-Commerce Market 2018Product Brochure: Eastern Europe B2C E-Commerce Market 2018
Product Brochure: Eastern Europe B2C E-Commerce Market 2018
 
Product Brochure: Latin America B2C E-Commerce Market 2018
Product Brochure: Latin America B2C E-Commerce Market 2018Product Brochure: Latin America B2C E-Commerce Market 2018
Product Brochure: Latin America B2C E-Commerce Market 2018
 
Product Brochure: Online Retail in Emerging Markets 2016
Product Brochure: Online Retail in Emerging Markets 2016Product Brochure: Online Retail in Emerging Markets 2016
Product Brochure: Online Retail in Emerging Markets 2016
 
Sample Report: Online Retail in Emerging Markets 2016
Sample Report: Online Retail in Emerging Markets 2016Sample Report: Online Retail in Emerging Markets 2016
Sample Report: Online Retail in Emerging Markets 2016
 
Product Brochure: Trends in Worldwide Internet Retail 2016
Product Brochure: Trends in Worldwide Internet Retail 2016Product Brochure: Trends in Worldwide Internet Retail 2016
Product Brochure: Trends in Worldwide Internet Retail 2016
 
Sample Report: Mexico B2C E-Commerce and Payment Market 2020 & COVID-19's Imp...
Sample Report: Mexico B2C E-Commerce and Payment Market 2020 & COVID-19's Imp...Sample Report: Mexico B2C E-Commerce and Payment Market 2020 & COVID-19's Imp...
Sample Report: Mexico B2C E-Commerce and Payment Market 2020 & COVID-19's Imp...
 
Sample Report: Canada B2C E-Commerce and Payment Market 2020 & COVID-19's Imp...
Sample Report: Canada B2C E-Commerce and Payment Market 2020 & COVID-19's Imp...Sample Report: Canada B2C E-Commerce and Payment Market 2020 & COVID-19's Imp...
Sample Report: Canada B2C E-Commerce and Payment Market 2020 & COVID-19's Imp...
 
Product Brochure: Asia-Pacific B2C E-Commerce Market 2015
Product Brochure: Asia-Pacific B2C E-Commerce Market 2015Product Brochure: Asia-Pacific B2C E-Commerce Market 2015
Product Brochure: Asia-Pacific B2C E-Commerce Market 2015
 

Semelhante a Product Brochure: Western Europe B2C E-Commerce and Online Payment Market 2019

Semelhante a Product Brochure: Western Europe B2C E-Commerce and Online Payment Market 2019 (17)

Product Brochure: Global Payment Innovation Trends 2019
Product Brochure: Global Payment Innovation Trends 2019Product Brochure: Global Payment Innovation Trends 2019
Product Brochure: Global Payment Innovation Trends 2019
 
Product Brochure: CIS B2C E-Commerce Market 2019
Product Brochure: CIS B2C E-Commerce Market 2019Product Brochure: CIS B2C E-Commerce Market 2019
Product Brochure: CIS B2C E-Commerce Market 2019
 
Product Brochure: South Korea B2C E-Commerce Market 2019
Product Brochure: South Korea B2C E-Commerce Market 2019Product Brochure: South Korea B2C E-Commerce Market 2019
Product Brochure: South Korea B2C E-Commerce Market 2019
 
Product Brochure: Fraud And Security In Global Online Payments 2019
Product Brochure: Fraud And Security In Global Online Payments 2019Product Brochure: Fraud And Security In Global Online Payments 2019
Product Brochure: Fraud And Security In Global Online Payments 2019
 
Product Brochure: Vietnam B2C E-Commerce Market 2018
Product Brochure: Vietnam B2C E-Commerce Market 2018Product Brochure: Vietnam B2C E-Commerce Market 2018
Product Brochure: Vietnam B2C E-Commerce Market 2018
 
Product Brochure: Western Europe B2C E-Commerce Market 2016
Product Brochure: Western Europe B2C E-Commerce Market 2016Product Brochure: Western Europe B2C E-Commerce Market 2016
Product Brochure: Western Europe B2C E-Commerce Market 2016
 
Product Brochure: Western Europe B2C E-Commerce Market 2017
Product Brochure: Western Europe B2C E-Commerce Market 2017Product Brochure: Western Europe B2C E-Commerce Market 2017
Product Brochure: Western Europe B2C E-Commerce Market 2017
 
Product Brochure: Europe Online Payment Methods: Second Half 2016
Product Brochure: Europe Online Payment Methods: Second Half 2016Product Brochure: Europe Online Payment Methods: Second Half 2016
Product Brochure: Europe Online Payment Methods: Second Half 2016
 
Product Brochure: South Africa B2C E-Commerce Market 2019
Product Brochure: South Africa B2C E-Commerce Market 2019Product Brochure: South Africa B2C E-Commerce Market 2019
Product Brochure: South Africa B2C E-Commerce Market 2019
 
Product Brochure: South Africa B2C E-Commerce Market 2019
Product Brochure: South Africa B2C E-Commerce Market 2019Product Brochure: South Africa B2C E-Commerce Market 2019
Product Brochure: South Africa B2C E-Commerce Market 2019
 
Product Brochure Nigeria B2C E-Commerce Market 2019
Product Brochure Nigeria B2C E-Commerce Market 2019Product Brochure Nigeria B2C E-Commerce Market 2019
Product Brochure Nigeria B2C E-Commerce Market 2019
 
Product Brochure: Africa B2C E-Commerce Market 2019
Product Brochure: Africa B2C E-Commerce Market 2019Product Brochure: Africa B2C E-Commerce Market 2019
Product Brochure: Africa B2C E-Commerce Market 2019
 
Product Brochure: Global Mobile Payment Methods 2019
Product Brochure: Global Mobile Payment Methods 2019Product Brochure: Global Mobile Payment Methods 2019
Product Brochure: Global Mobile Payment Methods 2019
 
Product Brochure: Europe M-Commerce 2017
Product Brochure: Europe M-Commerce 2017Product Brochure: Europe M-Commerce 2017
Product Brochure: Europe M-Commerce 2017
 
Product Brochure: Middle East B2C E-Commerce Market 2018
Product Brochure: Middle East B2C E-Commerce Market 2018Product Brochure: Middle East B2C E-Commerce Market 2018
Product Brochure: Middle East B2C E-Commerce Market 2018
 
Product Brochure: Asia-Pacific Online Payment Methods 2019
Product Brochure: Asia-Pacific Online Payment Methods 2019Product Brochure: Asia-Pacific Online Payment Methods 2019
Product Brochure: Asia-Pacific Online Payment Methods 2019
 
Product Brochure: Vietnam B2C E-Commerce Market 2015
Product Brochure: Vietnam B2C E-Commerce Market 2015Product Brochure: Vietnam B2C E-Commerce Market 2015
Product Brochure: Vietnam B2C E-Commerce Market 2015
 

Mais de yStats.com

Mais de yStats.com (20)

Sample_Report_Global_Open_Banking_Market_and_Trends_2021_by yStats.com
Sample_Report_Global_Open_Banking_Market_and_Trends_2021_by yStats.comSample_Report_Global_Open_Banking_Market_and_Trends_2021_by yStats.com
Sample_Report_Global_Open_Banking_Market_and_Trends_2021_by yStats.com
 
Sample Report_Global Subscriptions and Recurring Payments Market 2021_by ySta...
Sample Report_Global Subscriptions and Recurring Payments Market 2021_by ySta...Sample Report_Global Subscriptions and Recurring Payments Market 2021_by ySta...
Sample Report_Global Subscriptions and Recurring Payments Market 2021_by ySta...
 
Sample Report_North America Subscriptions & Recurring Payment Market 2021_by ...
Sample Report_North America Subscriptions & Recurring Payment Market 2021_by ...Sample Report_North America Subscriptions & Recurring Payment Market 2021_by ...
Sample Report_North America Subscriptions & Recurring Payment Market 2021_by ...
 
Sample Report_Global Online Payment Methods 2021 Post COVID-19_by yStats.com
Sample Report_Global Online Payment Methods 2021 Post COVID-19_by yStats.comSample Report_Global Online Payment Methods 2021 Post COVID-19_by yStats.com
Sample Report_Global Online Payment Methods 2021 Post COVID-19_by yStats.com
 
Sample Report_Global Alternative Payment Methods 2021 Post COVID-19_by yStats...
Sample Report_Global Alternative Payment Methods 2021 Post COVID-19_by yStats...Sample Report_Global Alternative Payment Methods 2021 Post COVID-19_by yStats...
Sample Report_Global Alternative Payment Methods 2021 Post COVID-19_by yStats...
 
Sample Report_Global Mobile Payment Methods 2021 Post COVID-19_by yStats.com
Sample Report_Global Mobile Payment Methods 2021 Post COVID-19_by yStats.comSample Report_Global Mobile Payment Methods 2021 Post COVID-19_by yStats.com
Sample Report_Global Mobile Payment Methods 2021 Post COVID-19_by yStats.com
 
Sample Report_Asia-Pacific Online Payment Methods 2021 Post COVID-19 _by ySta...
Sample Report_Asia-Pacific Online Payment Methods 2021 Post COVID-19 _by ySta...Sample Report_Asia-Pacific Online Payment Methods 2021 Post COVID-19 _by ySta...
Sample Report_Asia-Pacific Online Payment Methods 2021 Post COVID-19 _by ySta...
 
Sample Report_Latin America Online Payment Methods 2021 Post COVID-19 _by ySt...
Sample Report_Latin America Online Payment Methods 2021 Post COVID-19 _by ySt...Sample Report_Latin America Online Payment Methods 2021 Post COVID-19 _by ySt...
Sample Report_Latin America Online Payment Methods 2021 Post COVID-19 _by ySt...
 
Sample Report_Global B2B E-Commerce Market and Trends 2021 Post COVID-19 _by ...
Sample Report_Global B2B E-Commerce Market and Trends 2021 Post COVID-19 _by ...Sample Report_Global B2B E-Commerce Market and Trends 2021 Post COVID-19 _by ...
Sample Report_Global B2B E-Commerce Market and Trends 2021 Post COVID-19 _by ...
 
Sample Report_Middle East B2C E-Commerce and Payment Market 2021 & COVID-19's...
Sample Report_Middle East B2C E-Commerce and Payment Market 2021 & COVID-19's...Sample Report_Middle East B2C E-Commerce and Payment Market 2021 & COVID-19's...
Sample Report_Middle East B2C E-Commerce and Payment Market 2021 & COVID-19's...
 
Sample Report_Middle East and Africa Online Payment Methods 2021_by yStats.pdf
Sample Report_Middle East and Africa Online Payment Methods 2021_by yStats.pdfSample Report_Middle East and Africa Online Payment Methods 2021_by yStats.pdf
Sample Report_Middle East and Africa Online Payment Methods 2021_by yStats.pdf
 
Sample Report_Snapshot - Global B2B Marketplaces Market 2021_by yStats.com
Sample Report_Snapshot - Global B2B Marketplaces Market 2021_by yStats.comSample Report_Snapshot - Global B2B Marketplaces Market 2021_by yStats.com
Sample Report_Snapshot - Global B2B Marketplaces Market 2021_by yStats.com
 
Sample Report_Global B2B Payment Market and Trends 2021_by yStats.com
Sample Report_Global B2B Payment Market and Trends 2021_by yStats.comSample Report_Global B2B Payment Market and Trends 2021_by yStats.com
Sample Report_Global B2B Payment Market and Trends 2021_by yStats.com
 
Sample Report_North America Online Payment Methods 2021_by yStats.com
Sample Report_North America Online Payment Methods 2021_by yStats.comSample Report_North America Online Payment Methods 2021_by yStats.com
Sample Report_North America Online Payment Methods 2021_by yStats.com
 
Sample Report_Western Europe Online Payment Methods 2021_by yStats.com
Sample Report_Western Europe Online Payment Methods 2021_by yStats.comSample Report_Western Europe Online Payment Methods 2021_by yStats.com
Sample Report_Western Europe Online Payment Methods 2021_by yStats.com
 
Sample Report_Europe Online Payment Methods 2021_by yStats.com
Sample Report_Europe Online Payment Methods 2021_by yStats.comSample Report_Europe Online Payment Methods 2021_by yStats.com
Sample Report_Europe Online Payment Methods 2021_by yStats.com
 
Sample Report_Global Secondhand E-Commerce Market 2021_by yStats.com
Sample Report_Global Secondhand E-Commerce Market 2021_by yStats.comSample Report_Global Secondhand E-Commerce Market 2021_by yStats.com
Sample Report_Global Secondhand E-Commerce Market 2021_by yStats.com
 
Sample Report_Global Online Travel Market 2021_by yStats.com
Sample Report_Global Online Travel Market 2021_by yStats.comSample Report_Global Online Travel Market 2021_by yStats.com
Sample Report_Global Online Travel Market 2021_by yStats.com
 
Sample Report_Global Online Accommodation Booking Market 2021_by yStats.com
Sample Report_Global Online Accommodation Booking Market 2021_by yStats.comSample Report_Global Online Accommodation Booking Market 2021_by yStats.com
Sample Report_Global Online Accommodation Booking Market 2021_by yStats.com
 
Sample Report_Global Online Travel Payment 2021_by yStats.com
Sample Report_Global Online Travel Payment 2021_by yStats.comSample Report_Global Online Travel Payment 2021_by yStats.com
Sample Report_Global Online Travel Payment 2021_by yStats.com
 

Último

Jual Obat Aborsi ( Asli No.1 ) 085657271886 Obat Penggugur Kandungan Cytotec
Jual Obat Aborsi ( Asli No.1 ) 085657271886 Obat Penggugur Kandungan CytotecJual Obat Aborsi ( Asli No.1 ) 085657271886 Obat Penggugur Kandungan Cytotec
Jual Obat Aborsi ( Asli No.1 ) 085657271886 Obat Penggugur Kandungan Cytotec
ZurliaSoop
 
Quick Doctor In Kuwait +2773`7758`557 Kuwait Doha Qatar Dubai Abu Dhabi Sharj...
Quick Doctor In Kuwait +2773`7758`557 Kuwait Doha Qatar Dubai Abu Dhabi Sharj...Quick Doctor In Kuwait +2773`7758`557 Kuwait Doha Qatar Dubai Abu Dhabi Sharj...
Quick Doctor In Kuwait +2773`7758`557 Kuwait Doha Qatar Dubai Abu Dhabi Sharj...
daisycvs
 
Mckinsey foundation level Handbook for Viewing
Mckinsey foundation level Handbook for ViewingMckinsey foundation level Handbook for Viewing
Mckinsey foundation level Handbook for Viewing
Nauman Safdar
 
Al Mizhar Dubai Escorts +971561403006 Escorts Service In Al Mizhar
Al Mizhar Dubai Escorts +971561403006 Escorts Service In Al MizharAl Mizhar Dubai Escorts +971561403006 Escorts Service In Al Mizhar
Al Mizhar Dubai Escorts +971561403006 Escorts Service In Al Mizhar
allensay1
 

Último (20)

SEO Case Study: How I Increased SEO Traffic & Ranking by 50-60% in 6 Months
SEO Case Study: How I Increased SEO Traffic & Ranking by 50-60%  in 6 MonthsSEO Case Study: How I Increased SEO Traffic & Ranking by 50-60%  in 6 Months
SEO Case Study: How I Increased SEO Traffic & Ranking by 50-60% in 6 Months
 
Jual Obat Aborsi ( Asli No.1 ) 085657271886 Obat Penggugur Kandungan Cytotec
Jual Obat Aborsi ( Asli No.1 ) 085657271886 Obat Penggugur Kandungan CytotecJual Obat Aborsi ( Asli No.1 ) 085657271886 Obat Penggugur Kandungan Cytotec
Jual Obat Aborsi ( Asli No.1 ) 085657271886 Obat Penggugur Kandungan Cytotec
 
Arti Languages Pre Seed Teaser Deck 2024.pdf
Arti Languages Pre Seed Teaser Deck 2024.pdfArti Languages Pre Seed Teaser Deck 2024.pdf
Arti Languages Pre Seed Teaser Deck 2024.pdf
 
Cannabis Legalization World Map: 2024 Updated
Cannabis Legalization World Map: 2024 UpdatedCannabis Legalization World Map: 2024 Updated
Cannabis Legalization World Map: 2024 Updated
 
Getting Real with AI - Columbus DAW - May 2024 - Nick Woo from AlignAI
Getting Real with AI - Columbus DAW - May 2024 - Nick Woo from AlignAIGetting Real with AI - Columbus DAW - May 2024 - Nick Woo from AlignAI
Getting Real with AI - Columbus DAW - May 2024 - Nick Woo from AlignAI
 
Quick Doctor In Kuwait +2773`7758`557 Kuwait Doha Qatar Dubai Abu Dhabi Sharj...
Quick Doctor In Kuwait +2773`7758`557 Kuwait Doha Qatar Dubai Abu Dhabi Sharj...Quick Doctor In Kuwait +2773`7758`557 Kuwait Doha Qatar Dubai Abu Dhabi Sharj...
Quick Doctor In Kuwait +2773`7758`557 Kuwait Doha Qatar Dubai Abu Dhabi Sharj...
 
Horngren’s Cost Accounting A Managerial Emphasis, Canadian 9th edition soluti...
Horngren’s Cost Accounting A Managerial Emphasis, Canadian 9th edition soluti...Horngren’s Cost Accounting A Managerial Emphasis, Canadian 9th edition soluti...
Horngren’s Cost Accounting A Managerial Emphasis, Canadian 9th edition soluti...
 
GUWAHATI 💋 Call Girl 9827461493 Call Girls in Escort service book now
GUWAHATI 💋 Call Girl 9827461493 Call Girls in  Escort service book nowGUWAHATI 💋 Call Girl 9827461493 Call Girls in  Escort service book now
GUWAHATI 💋 Call Girl 9827461493 Call Girls in Escort service book now
 
CROSS CULTURAL NEGOTIATION BY PANMISEM NS
CROSS CULTURAL NEGOTIATION BY PANMISEM NSCROSS CULTURAL NEGOTIATION BY PANMISEM NS
CROSS CULTURAL NEGOTIATION BY PANMISEM NS
 
HomeRoots Pitch Deck | Investor Insights | April 2024
HomeRoots Pitch Deck | Investor Insights | April 2024HomeRoots Pitch Deck | Investor Insights | April 2024
HomeRoots Pitch Deck | Investor Insights | April 2024
 
Durg CALL GIRL ❤ 82729*64427❤ CALL GIRLS IN durg ESCORTS
Durg CALL GIRL ❤ 82729*64427❤ CALL GIRLS IN durg ESCORTSDurg CALL GIRL ❤ 82729*64427❤ CALL GIRLS IN durg ESCORTS
Durg CALL GIRL ❤ 82729*64427❤ CALL GIRLS IN durg ESCORTS
 
Mckinsey foundation level Handbook for Viewing
Mckinsey foundation level Handbook for ViewingMckinsey foundation level Handbook for Viewing
Mckinsey foundation level Handbook for Viewing
 
How to Get Started in Social Media for Art League City
How to Get Started in Social Media for Art League CityHow to Get Started in Social Media for Art League City
How to Get Started in Social Media for Art League City
 
QSM Chap 10 Service Culture in Tourism and Hospitality Industry.pptx
QSM Chap 10 Service Culture in Tourism and Hospitality Industry.pptxQSM Chap 10 Service Culture in Tourism and Hospitality Industry.pptx
QSM Chap 10 Service Culture in Tourism and Hospitality Industry.pptx
 
Berhampur Call Girl Just Call 8084732287 Top Class Call Girl Service Available
Berhampur Call Girl Just Call 8084732287 Top Class Call Girl Service AvailableBerhampur Call Girl Just Call 8084732287 Top Class Call Girl Service Available
Berhampur Call Girl Just Call 8084732287 Top Class Call Girl Service Available
 
Al Mizhar Dubai Escorts +971561403006 Escorts Service In Al Mizhar
Al Mizhar Dubai Escorts +971561403006 Escorts Service In Al MizharAl Mizhar Dubai Escorts +971561403006 Escorts Service In Al Mizhar
Al Mizhar Dubai Escorts +971561403006 Escorts Service In Al Mizhar
 
UAE Bur Dubai Call Girls ☏ 0564401582 Call Girl in Bur Dubai
UAE Bur Dubai Call Girls ☏ 0564401582 Call Girl in Bur DubaiUAE Bur Dubai Call Girls ☏ 0564401582 Call Girl in Bur Dubai
UAE Bur Dubai Call Girls ☏ 0564401582 Call Girl in Bur Dubai
 
Escorts in Nungambakkam Phone 8250092165 Enjoy 24/7 Escort Service Enjoy Your...
Escorts in Nungambakkam Phone 8250092165 Enjoy 24/7 Escort Service Enjoy Your...Escorts in Nungambakkam Phone 8250092165 Enjoy 24/7 Escort Service Enjoy Your...
Escorts in Nungambakkam Phone 8250092165 Enjoy 24/7 Escort Service Enjoy Your...
 
Uneak White's Personal Brand Exploration Presentation
Uneak White's Personal Brand Exploration PresentationUneak White's Personal Brand Exploration Presentation
Uneak White's Personal Brand Exploration Presentation
 
Berhampur 70918*19311 CALL GIRLS IN ESCORT SERVICE WE ARE PROVIDING
Berhampur 70918*19311 CALL GIRLS IN ESCORT SERVICE WE ARE PROVIDINGBerhampur 70918*19311 CALL GIRLS IN ESCORT SERVICE WE ARE PROVIDING
Berhampur 70918*19311 CALL GIRLS IN ESCORT SERVICE WE ARE PROVIDING
 

Product Brochure: Western Europe B2C E-Commerce and Online Payment Market 2019

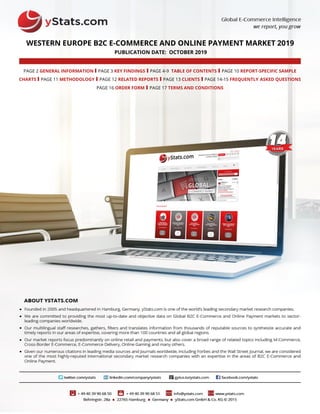
  • 1. WESTERN EUROPE B2C E-COMMERCE AND ONLINE PAYMENT MARKET 2019 PUBLICATION DATE: OCTOBER 2019 PAGE 2 GENERAL INFORMATION I PAGE 3 KEY FINDINGS I PAGE 4-9 TABLE OF CONTENTS I PAGE 10 REPORT-SPECIFIC SAMPLE CHARTS I PAGE 11 METHODOLOGY I PAGE 12 RELATED REPORTS I PAGE 13 CLIENTS I PAGE 14-15 FREQUENTLY ASKED QUESTIONS PAGE 16 ORDER FORM I PAGE 17 TERMS AND CONDITIONS
  • 2. 2 2 PRODUCT DETAILS Title: Type of Product: Category: Covered Regions: Covered Countries: Language: Formats: Number of Charts: Western Europe B2C E-Commerce and Online Payment Market 2019 Report B2C E-Commerce, Online Payment Western Europe UK, Germany, France, Spain, Italy English PDF & PowerPoint 169 PRICES* Single User License: Site License: Global Site License: € 2,450 (exc. VAT) € 3,675 (exc. VAT) € 4,900 (exc. VAT) We occasionally offer a discount on selected reports as newer reports are published. Please see the most up-to-date pricing on our website www.ystats.com. QUESTIONS ANSWERED IN THIS REPORT What are the top trends and forecasts for B2C E-Commerce in Western Europe? How are the online retail sales in the EU-5 projected to evolve through 2022? Which payment methods are preferred by online shoppers in Western Europe? What are the major online and mobile payment trends in this region? Who are the leaders of the B2C E-Commerce competition in the EU-5? SECONDARY MARKET RESEARCH Our reports are exclusively based on secondary market research. Our researchers derive information and data from a variety of reliable published sources and compile the data into understandable and easy-to-use formats. ADVANTAGES Maximum Objectivity Reliable Sources Up-To-Date Analysis Boardroom-Ready PowerPoint Presentations Guidance For Strategic Company Decisions WESTERN EUROPE B2C E-COMMERCE AND ONLINE PAYMENT MARKET 2019
  • 3. THE E-COMMERCE PAYMENT LANDSCAPE IN WESTERN EUROPE IS EVOLVING Western Europe is leading the Old Continent by online retail sales as of 2019. The region’s top 5, the UK, Germany, France, Spain and Italy, are seeing an increased share of overall retail sales generated online. In the UK, this share nears 20% in 2019, while in Germany it topped 10% in 2018, according to statistics cited in the yStats.com. Due to this level of maturity, B2C E-Commerce sales in the EU-5 are projected to increase at declining annual growth rates through 2022. Major online shopping trends in Western Europe include the rapid growth of mobile and cross-border E-Commerce sales, along with the emergence of omnichannel services and innovative purchase channels, such as digital voice assistants. The payments landscape in E-Commerce is also evolving amidst the adoption of PSD2 and Strong Customer Authentication (SCA) requirements, along with changing consumer preferences, the yStats.com report reveals. Credit and debit cards still held the leading position in terms of E-Commerce payments share in Europe in 2018. However, there is a clear trend towards the rise of alternative payment methods, especially digital wallets. PayPal and similar solutions already occupy the top rank by online shoppers’ preference in some Western European markets including Italy and Spain. Mobile wallets such as Apple Pay and Google Pay have not yet gained much acceptance among Europe’s online shoppers, but their adoption is increasing. WESTERN EUROPE B2C E-COMMERCE AND ONLINE PAYMENT MARKET 2019 3
  • 4. MANAGEMENT SUMMARY REGIONAL OVERVIEW  B2C E-Commerce Sales in Europe, in EUR billion, and Year-on-Year Change, in %, 2013 - 2019f  Breakdown of B2C E-Commerce Sales in Europe by Sub-Regions, in %, 2018  Retail E-Commerce Sales in the EU5, in USD billion, and Year-on-Year Change, in %, 2018-2022f  Top 10 Countries Worldwide by Retail E-Commerce Sales, in USD billion, by Canada, China, India, Germany, France, Japan, Russia, South Korea, the UK, the USA, 2018 & 2019f  Retail E-Commerce Sales in the EU5, in USD billion, by Country, 2019f  Top Product Categories Purchased Online, in % of Online Shoppers in the EU, 2018  Internet Penetration in the EU, by Country, in % of Individuals, 2012 – 2018  Online Shopper Penetration in the EU, by Country, in % of Individuals, 2012 – 2018  Cross-Border Online Shopper Penetration in the EU, by Country, in % of Online Shoppers,  2017 & 2018  Product Categories Purchased Online, in % of Individuals, by Belgium, Germany, France, Italy, the Netherlands, the Nordics, Spain and the UK, May 2018  Breakdown of Maximum Acceptable Delivery Times, in % of Online Shoppers, by Belgium, Germany, France, Italy, the Netherlands, the Nordics, Spain and the UK, May 2018  Online and Mobile Payment Trends and News about Players, February 2019  Breakdown of E-Commerce Transactions by Payment Method, in %, April 2018  Top Payment Methods Preferred in E-Commerce, in % of Online Shoppers, 2016 - 2018  Payment Methods Preferred in Online Shopping, in % of Online Shoppers, by Belgium, Germany, France, Italy, the Netherlands, the Nordics, Spain and the UK, May 2018  Top Payment Methods Preferred in E-Commerce, in % of Online Shoppers, by Selected Countries, 2018  Share of Internet Users Who Say They Would Never Use Selected Payment Providers to Pay for Goods and Services (Online or In-Store), in % of Internet Users, April 2018  Attitudes to Security of Online Shopping, incl. Payment-Related, in % of Online Shoppers, by the UK, Germany and Austria, April 2018  Payment Methods Accepted in Online Stores, in % of Online Stores, February 2018  Overview of Strong Customer Authentication Requirements Under PSD2, April 2019  Overview of The Strong Customer Authentication Perceptions by Industry Participants, June 2019  E-Commerce Merchants’ Readiness to Support Strong Customer Authentication, in %, November 2018  Levels of Awareness and Preparation of E-Commerce Merchants to Strong Customer Authentication Requirements, by SMEs and Large Businesses, June 2019  Share of Consumers Who Are Unaware of the Strong Customer Authentication Requirements for Online Purchases, in %, June 2019  Share of Consumers Who Prefer One-time Passcodes for Authentication, Compared to Fingerprint Recognition, in %, June 2019  Barriers to Buying Online, in % of Online Shoppers, July 2018  Mobile Payment Transaction Value in the EU-7, in EUR billion, and Year-on-Year Change, in %, 2016-2022f  Breakdown of Mobile Payment Transaction Value in the EU-7 by Payment Types, in %, 2022f  Mobile Wallet User Penetration, in % of Respondents, by France, Germany, Spain and the UK, 2018  Main Barriers to Mobile Payment Adoption, in % of Respondents, by France, Germany, Spain and the UK, 2018 UK 3.1. TRENDS  B2C E-Commerce Market Overview and International Comparisons, September 2019  M-Commerce Sales, in GBP billion, 2019f & 2024f 2 WESTERN EUROPE B2C E-COMMERCE AND ONLINE PAYMENT MARKET 2019 TABLE OF CONTENTS (1 OF 6) 4 1 3
  • 5. 5 5 UK (CONT.) 3.1. TRENDS (CONT.)  Key Figures about Click and Collect, incl. Click & Collect Growth Rate, 2018-2023f, Click & Collect Sales, in GBP billion, 2023f, Click & Collect Share of Total E-Commerce Sales, in %, 2023f, Clothing and Footwear’s Share of Click & Collect Sales, in %, 2018, Click & Collect Customer Satisfaction Rate, in %, 2018, and Share of Customers Who Bought an Additional Item When Collecting an Order, in %, 2018  Cross-Border Online Shopper Penetration, by Online Shoppers Buying From Other EU Countries and from the Rest of the World, in % of Online Shoppers in the UK, 2013 - 2019 3.2. SALES & SHARES  Retail E-Commerce Sales, in GBP billion, and Share of Total Retail Sales, in %, 2017 – 2023f  Retail E-Commerce Sales, in GBP billion, 2018 & 2023f  B2C E-Commerce Share of Total Retail Sales, in %, 2013 – 2018 & Q1-Q2 2019 3.3. INTERNET USERS & ONLINE SHOPPERS  Number of Internet Users, in millions, and Penetration, in % of Adults, by Frequency of Use, 2013 - 2019  Online Shopper Penetration, in % of Adults, 2013-2019  Online Shopper Penetration, in % of Adults, by Age Group and Gender, 2013 - 2019  Breakdown of Frequency of Shopping Online During a Three-Month Period, in % of Online Shoppers, by Age Group and Gender, 2019  Breakdown of Online Spending During a Three-Month Period, in GBP, in % of Online Shoppers, by Age Group and Gender, 2019 3.4. PRODUCTS  Product Categories Purchased Online, in % of Adults, 2019  Online Grocery Sales, in GBP billion, 2018, 2019f & 2023f 3.5. PAYMENT  Breakdown of E-Commerce Transactions by Payment Method, in %, April 2018  Top 10 Reasons for Shopping Cart Abandonment, in % of Online Shoppers, 2018e  Share of Online Shoppers Who Want Merchants to Offer a Range of Payment Options, in %, July 2018  Share of Online Shoppers Who Have Abandonment an Online Transaction Due to the Payment Process, in %, 2014 & 2018  Attitudes to Slow Payment Process, in % of Online Shoppers, July 2018  E-Commerce Fraud Loss on UK-Issued Cards, in GBP million, and Share of Total Card Purchase Fraud Loss, in %, 2013 - 2018  Breakdown of Consumers’ Perception of Whether They Currently Undergo Enough Security Checks When Making an Online Payment, in % of Consumers, 2018  Breakdown of the Preferred Way of Receiving a One-time Passcode to Verify a Payment Transaction, in % of Consumers, 2018  Knowledge of Technology Trends, incl. Mobile Payments, in % of Consumers, 2016 - 2018  Innovative Payment Methods That Millennial Online Shoppers Plan to Use in the Future, July 2018  Current and Future Use of Apple Pay, Google Pay and Samsung Pay, Compared to Debit/Credit Cards, in % of Online Shoppers, by Age Group, July 2018  Usage of FinTech Disruptors Compared to Banks, in % of Internet Users, July 2018 3.6. DELIVERY  Delivery-Related Reasons for Shopping Cart Abandonment, in % of Online Shoppers Who Abandoned a Shopping Cart for a Delivery-Related Reason, 2018 WESTERN EUROPE B2C E-COMMERCE AND ONLINE PAYMENT MARKET 2019 TABLE OF CONTENTS (2 OF 6) 3
  • 6. 6 6 UK (CONT.) 3.7. PLAYERS  Top 10 E-Commerce Websites by Audience Reach, in % of Internet Users, September 2018  Breakdown of Frequency of Purchasing from Amazon, in % of Consumers, February 2019 GERMANY 4.1. TRENDS  B2C E-Commerce Market Overview and International Comparisons, September 2019  Devices Used for Shopping Online, in % of Online Shoppers, 2017 & 2018  Breakdown of Research and Purchase Channels Used, in % of Consumers, 2015, 2019e & 2021f  Breakdown of Awareness of Click & Collect, in %, 2018 4.2. SALES & SHARES  B2C E-Commerce Sales, in EUR billion, by Three Comparative Estimates, and CAGR, in %, 2017 – 2023f  B2C E-Commerce Share of Total Retail Sales, in %, by Two Comparative Estimates, 2017 - 2023f 4.3. INTERNET USERS & ONLINE SHOPPERS  Number of Internet Users, in millions, and Penetration, in % of Individuals, 2012 – 2018  Number of Online Shoppers, in millions, and Penetration, in % of Internet Users, 2012 - 2018 4.4. PRODUCTS  Product Categories Purchased Online, in % of Online Shoppers, 2017 & 2018  B2C E-Commerce Sales, by Product Category, in EUR billion, 2017 & 2018 4.5. PAYMENT  Breakdown of B2C E-Commerce Product Sales by Payment Methods, in %, 2017 & 2018  Payment Methods Preferred in E-Commerce, by Type of Seller Purchased From, in % of Online Shoppers, April 2018  Breakdown of Attitude to Paying by Invoice, in % of Online Shoppers, April 2018  Breakdown of Importance of Payment Topics in Merchants’ Payment Strategy Until 2020, in % of E-Commerce Merchants, 2018  Payment Methods that E-Commerce Merchants Plan to Start Accepting in 2018/2019, in % of E-Commerce Merchants, 2018  Share of E-Commerce Merchants Who Faced Fraud or Fraud Attempts in Their Online Shops, in %, 2018  Perceived Development of Fraud and Fraud Attempts Over the Past Year, in % of E-Commerce Merchants, 2018  Types of Fraud and Fraud Attempts Faced by E-Commerce Merchants in Their Online Stores, in % of E-Commerce Merchants, 2018  Measures Taken by E-Commerce Merchants to Prevent Fraud in Their Online Stores, in % of E-Commerce Merchants, 2018  Breakdown of Usage of 3D Secure for Credit Card Payments, in % of E-Commerce Sellers, 2017 - 2019  Breakdown of the Perceived Change in Shopping Cart Abandonment Rates After Choosing Credit Card Payment as a Result of 3D Secure, in % of E-Commerce Sellers Using 3D Secure, 2019  Preference for Paying via Smartphone Compared to Cash and Cards, by Type of Payment, in % of Consumers, August 2018  Mobile Payment User Penetration, in % of Consumers, and Mobile Payment Apps Used, in % of Mobile Payment Users, August 2018  Most Trusted Mobile Payment Providers, in % of Consumers, August 2018 WESTERN EUROPE B2C E-COMMERCE AND ONLINE PAYMENT MARKET 2019 TABLE OF CONTENTS (3 OF 6) 3 4
  • 7. 7 7 UK (CONT.) 4.6. DELIVERY  Criteria Applied to Choosing an Online Shop to Buy From, in % of Online Shoppers, 2018 4.7. PLAYERS  Breakdown of B2C E-Commerce Sales by Player Type, in %, 2018  Amazon’s Market Share of B2C E-Commerce Sales, in %, 2018  Top 10 Online Shops, by Sales, in EUR million, 2018 FRANCE 5.1. TRENDS  M-Commerce Share of B2C E-Commerce Sales, in %, 2014 - 2018  M-Commerce Share of Retail E-Commerce Sales, in %, 2019f  Devices Used for Shopping Online, in % of Online Shoppers, 2018 5.2. SALES & SHARES  B2C E-Commerce Sales, in EUR billion, 2016 - 2019f  B2C E-Commerce Share of Retail E-Commerce Sales, in %, 2018  Retail E-Commerce Sales, in EUR billion, and Share of Total Retail Sales, in %, 2017 – 2023f 5.3. INTERNET USERS & ONLINE SHOPPERS  Internet Penetration, in % of Individuals, 2012 - 2018  Online Shopper Penetration, in % of Individuals, 2012 - 2018 5.4. PRODUCTS  Product Categories Purchased Online, in % of Online Shoppers, 2017 & 2018 5.5. PAYMENT  Breakdown of B2C E-Commerce Sales by Payment Methods, in %, 2018  Payment Methods Preferred in E-Commerce, in % of Online Shoppers, July 2018  Attitude Towards Alternative Payment Methods in E-Commerce, in % of Online Shoppers, March 2018  Breakdown of Main Barriers That Make Consumers Hesitant to Purchase Online, in %, by Total Population and Online Shoppers, June 2018  Share of 3D Secure Payments, in % of Online Card Payments, April 2011 – April 2018  Top 5 Services and Obligations of E-Commerce Merchants in 2019 According to Online Shoppers, in % of Online Shoppers, December 2018  Preferred Biometric Authentication Methods in E-Commerce, in % of Online Shoppers, 2019  Breakdown of Attitudes Towards Mobile Payments, in % of Internet Users, February 2018 5.6. DELIVERY  Delivery Methods Used in E-Commerce, in % of Online Shoppers, 2018 5.7. PLAYERS  Online Merchants’ Share of Total B2C E-Commerce Websites and B2C E-Commerce Market Sales, by Annual B2C E- Commerce Turnover, in %, 2017 & 2018  Top 5 E-Commerce Websites by Number of Monthly Visitors, in millions, Q1 2019  Top 10 Online Shops, by Sales, in EUR million, 2018 5 WESTERN EUROPE B2C E-COMMERCE AND ONLINE PAYMENT MARKET 2019 TABLE OF CONTENTS (4 OF 6) 4
  • 8. 8 8 SPAIN 6.1. TRENDS  Devices Used for Shopping Online, in % of Online Shoppers, June 2019  Breakdown of Research & Purchase Channels Used, in % Online Shoppers, June 2019 6.2. SALES & SHARES  B2C E-Commerce Sales, in EUR billion, and Year-on-Year Change, in %, 2015 - 2019f  B2C E-Commerce Share of Retail Sales, in %, 2018 & 2022f 6.3. INTERNET USERS & ONLINE SHOPPERS  Internet Penetration, in % of Individuals, 2012 - 2018  Online Shopper Penetration, in % of Individuals, 2012 - 2018 6.4. PRODUCTS Product Categories Purchased Online, in % of Online Shoppers, 2017 & 2018 6.5. PAYMENT  Payment Methods Used in E-Commerce, in % of E-Commerce Professionals, July 2018  Payment Methods Used in E-Commerce, in % of Online Shoppers, 2017 & 2018  Breakdown of Factors Most Important in Online Payment Methods, in % of Online Shoppers, October 2018  Breakdown of Preferred Payment Methods, by Store Type, incl. Online, in % of Internet Users, June 2018 6.6. DELIVERY  Factors Most Important to Customer Satisfaction in E-Commerce, in % of Online Shoppers, June 2019 6.7. PLAYERS  Top 10 Online Shops, by Sales, in EUR million, 2018  Top 5 Online Shops by Number of Orders, in millions, 2018 ITALY 7.1. TRENDS  M-Commerce Sales, in EUR billion, and M-Commerce Share of B2C E-Commerce Sales, in %, 2017 – 2019f  Cross-Border Imports Share of B2C E-Commerce Sales, in %, 2018e 7.2. SALES & SHARES  B2C E-Commerce Sales, in EUR billion, 2015 – 2019f  B2C E-Commerce Share of Retail Sales, in %, 2018 & 2019f 7.3. INTERNET USERS & ONLINE SHOPPERS  Internet Penetration, in % of Individuals, 2012 - 2018  Online Shopper Penetration, in % of Individuals, 2012 - 2018 7.4. PRODUCTS  Breakdown of B2C E-Commerce Sales by Products and Services, in %, 2015 – 2019f  B2C E-Commerce Sales by Category, by Products and Services, in EUR million, and Year-on-Year Change, in %, 2018 & 2019f  Product Categories Purchased Online, in % of Online Shoppers, 2017 & 2018 6 WESTERN EUROPE B2C E-COMMERCE AND ONLINE PAYMENT MARKET 2019 TABLE OF CONTENTS (5 OF 6) 7
  • 9. 9 9 ITALY (CONT.) 7.5. PAYMENT  Payment Methods Preferred in E-Commerce, in % of Online Shoppers, July 2018  Breakdown of the Number of Online Purchase Transactions by Payment Methods, in %, Q1 2018  Breakdown of Number of Online Purchase Transactions by Payment Methods, by Purchase of Physical Products and of Digital Goods and Services, in %, Q1 2018  Average Online Purchase Transaction Value by Payment Method, in EUR, Q1 2018  Breakdown of Awareness and Usage of New FinTech Services, in % of Internet Users, 2018 7.6. DELIVERY  New Delivery Options Introduced, in % of E-Commerce Companies, 2018 7.7. PLAYERS  Top 10 Online Shops, by Sales, in EUR million, 2018 WESTERN EUROPE B2C E-COMMERCE AND ONLINE PAYMENT MARKET 2019 TABLE OF CONTENTS (6 OF 6) 7
  • 10. 10 10 WESTERN EUROPE B2C E-COMMERCE AND ONLINE PAYMENT MARKET 2019 REPORT-SPECIFIC SAMPLE CHARTS
  • 11. GENERAL METHODOLOGY OF OUR MARKET REPORTS Secondary Market Research  The reports are compiled based on secondary market research. Secondary research is information gathered from previously published sources. Our reports are solely based on information and data acquired from national and international statistical offices, industry and trade associations, business reports, business and company databases, journals, company registries, news portals and many other reliable sources. By using various sources we ensure maximum objectivity for all obtained data. As a result, companies gain a precise and unbiased impression of the market situation.  Cross referencing of data is conducted in order to ensure validity and reliability.  The source of information and its release date are provided on every chart. It is possible that the information contained in one chart is derived from several sources. If this is the case, all sources are mentioned on the chart.  The reports include mainly data from the last 12 months prior to the date of report publication. Exact publication dates are mentioned in every chart. Definitions  The reports take into account a broad definition of B2C E- Commerce, which might include mobile commerce. As definitions may vary among sources, exact definition used by the source (if available) is included at the bottom of the chart. Chart Types  Our reports include text charts, pie charts, bar charts, rankings, line graphs and tables. Every chart contains an Action Title, which summarizes the main idea/finding of the chart and a Subtitle, which provides necessary information about the country, the topic, units or measures of currency, and the applicable time period(s) to which the data refers. With respect to rankings, it is possible that the summation of all categories amounts to more than 100%. In this case, multiple answers were possible, which is noted at the bottom of the chart. Report Structure  Reports are comprised of the following elements, in the following order: Cover page, preface, legal notice, methodology, definitions, table of contents, management summary (summarizing main information contained in each section of report) and report content (divided into sections and chapters). When available, we also include forecasts in our report content. These forecasts are not our own; they are published by reliable sources. Within Global and Regional reports, we include all major developed and emerging markets, ranked in order of importance by using evaluative criteria such as sales figures. Notes and Currency Values  If available, additional information about the data collection, for example the time of survey and number of people surveyed, is provided in the form of a note. In some cases, the note (also) contains additional information needed to fully understand the contents of the respective data.  When providing information about amounts of money, local currencies are most often used. When referencing currency values in the Action Title, the EUR values are also provided in brackets. The conversions are always made using the average currency exchange rate for the respective time period. Should the currency figure be in the future, the average exchange rate of the past 12 months is used. METHODOLOGY OF OUR WESTERN EUROPE B2C E-COMMERCE AND ONLINE PAYMENT MARKET 2019 Report Coverage  This report covers the B2C E-Commerce & Online Payment market in Western Europe. In addition to the regional information and country comparisons, the top 5 markets in this region are covered in- depth, including France, Germany, Italy, Spain, and the UK. A broad definition of retail E-Commerce used by some original sources cited in this report might include both B2C and C2C E-Commerce.  The report contains relevant information about international comparisons, market trends, E-Commerce sales and shares, Internet users and shoppers, products, delivery and players, as well as payment methods, trends in online payment security. In addition, information about mobile payments was included, with a focus on remote mobile payments; however, some sources cited in the report included both in- store and remote mobile payments in their definitions. Report Structure  The report starts with an overview of the regional E-Commerce market, regional and country comparisons in terms of criteria relevant to B2C E-Commerce, such as sales, Internet and online shopper penetration. The rest of the report is divided into country chapters, presented in the descending order of retail E-Commerce sales. Data availability varied by country.  Each country description starts with the “Trends” section that highlights relevant market trends, such as M-Commerce, omnichannel, and cross-border online shopping.  The section “Sales & Shares” covers the development of B2C E- Commerce sales and E-Commerce’s share of total retail sales. For top markets in the region, information from several sources was provided for cross-referencing.  In the “Users & Shoppers” section, information about Internet penetration and online shoppers is included.  Afterwards, the section “Products” shows the leading product categories purchased online.  The next section, “Payment”, covers the payment methods most used by online shoppers, mobile payment trends and attitudes of online shoppers and merchants to payment security in E-Commerce.  Furthermore, the “Delivery” section covers information related to delivery in E-Commerce.  Finally, the “Players” section includes information about the leading E-Commerce companies, including rankings of top online shopping platforms by sales, website visits, awareness and usage rates by online shoppers, where available.  For the top two B2C E-Commerce markets in the region, the UK and Germany, the country descriptions start with an overview chart, highlighting the overall B2C E-Commerce development. WESTERN EUROPE B2C E-COMMERCE AND ONLINE PAYMENT MARKET 2019 11
  • 12. Western Europe B2C E-Commerce Market 2019 October 2019 € 1,950 Central Asia & Caucasus B2C E-Commerce Market 2019: Kazakhstan, Azerbaijan, Georgia May 2019 € 950 CIS B2C E-Commerce Market 2019 Kazakhstan B2C E-Commerce Market 2019 May 2019 May 2019 € 1,950 € 750 Europe Online Payment Methods 2019 February 2019 € 1,950 Europe Online Payment Fraud and Security 2019 July 2019 € 750 Global Payment Innovation Trends 2019 July 2019 € 950 Fraud and Security in Global Online Payments 2019 July 2019 € 1,950 Global Digital Payment Forecasts 2019-2022 May 2019 € 1,450 Global Mobile Wallets 2019 April 2019 € 1,950 Global Mobile Payment Methods 2019 March 2019 € 1,950 Global Online Payment Methods 2019 March 2019 € 2,950 Asia-Pacific B2C E-Commerce Market 2019 September 2019 € 3,950 Southeast Asia B2C E-Commerce Market 2019 September 2019 € 1,950 Africa B2C E-Commerce Market 2019 June 2019 € 1,950 MENA B2C E-Commerce Market 2019 June 2019 € 2,950 Middle East B2C E-Commerce Market 2019 April 2019 € 2,450 North America B2C E-Commerce Market 2018 November 2018 € 950 Latin America B2C E-Commerce Market 2018 November 2018 € 1,950 Global Online Travel Market 2018 October 2018 € 1,950 Global Cross-Border B2C E-Commerce 2018 September 2018 € 2,950 Global B2B E-Commerce Market 2018 September 2018 € 1,950 UPCOMING RELATED REPORTS REPORT PUBLICATION DATE PRICE* Eastern Europe B2C E-Commerce Market 2019 Eastern Europe B2C E-Commerce & Online Payment Market 2019 Europe B2C E-Commerce Market 2019 Europe B2C E-Commerce & Online Payment Market 2019 October 2019 October 2019 October 2019 October 2019 € 1,950 € 2,450 € 2,950 € 3,950 12 WESTERN EUROPE B2C E-COMMERCE AND ONLINE PAYMENT MARKET 2019
  • 13. 13
  • 14. 14
  • 15. 15
  • 16. 16
  • 17. 17