2. Define - Voice of Customer Voice of the Customer Operation Requirement CTQ Characteristics 1st Priority CTQ Flow Down Factory Management Material Planning Team External Customer Reduce inbound & outbound process cycle time Shorten process cycle time, improve on-time delivery No inventory discrepancy between E-book and SAP system No tariff penalty occurred due to inventory discrepancy Transaction DPO (Targeted to reduce DPO by 70% over existing performance level) Process cycle time Targeted to reduce CT to 3 days (Benchmark) China Customs No discrepancy between 2 systems’ transaction
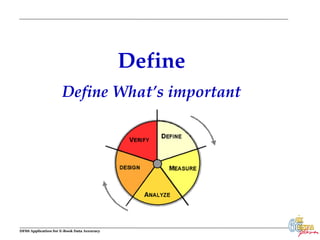
3. Define - Project Scheduling Project Planning in Define Phase Project Planning Updated in Design Phase Project Milestone: “Define” Start to Completion: Sep.22, 2008 – Sep.26, 2008 “Measurement” Start to Completion: Sep.29, 2008 – Oct.24, 2008 “Analysis” Start to Completion: Oct.27 , 2008 – Oct.31, 2008 “Design” Start to Completion: Nov.3, 2008 – Dec.28, 2008 “Verify” Start to Completion: Dec.1, 2008 – Jan.9, 2009
10. Analysis – Pareto Chart We deeply investigate discrepancy root causes for two periods, week24 to week33, week34 to week43.
11.
12. Analysis – Failure Mode & Effect Analysis 1. Establish FMEA Rating Scales Severity of The Effect Probability of Occurrence Dectection of Difficulity R isk P riority N umber X X = Calculate Risk:
13. Analysis – Failure Mode & Effect Analysis Identify failure mode occurred in which process Root causes from Pareto Chart
19. Design – Database Functions From this database function, we can either see discrepancy result, or transaction details. Transaction Comparison Functions Discrepancy Tracking Function and Resolution Matrix
25. Verify – Achievement Our conclusion based on the normal distribution, 95% CI for difference: (0.1004, 0.1512), exclude (0, 0); P-Value <.05; So reject Ho (Ho: μ 1 = μ 2). In other words, there has been a decrease in DPU from the before and after data. 1. DPU Reduction DPU: - 12.58% Two-Sample T-Test and CI: DPU(W19-43), DPU(W44-53) Two-sample T for DPU(W19-43) vs DPU(W44-53) N Mean StDev SE Mean DPU(W19-43) 25 0.1632 0.0197 0.0039 DPU(W44-53) 10 0.0374 0.0343 0.011 Difference = mu (DPU(W19-43)) - mu (DPU(W44-53)) Estimate for difference: 0.1258 95% CI for difference: (0.1004, 0.1512) T-Test of difference = 0 (vs not =): T-Value = 10.90 P-Value = 0.000 DF = 11 Outlier: before data Normal distribution
Today‘s competitive world: Technology alone doesn‘t sell In addition to our technological strength: Solutions and customer closeness: Because we want to grow profitably: This means: We want to win new customers and make more business with existing customers