Long-Term Budget Outlook
•
2 gostaram•985 visualizações

The Congressional Budget Office projects that if current laws do not change, mandatory federal spending on major health care programs will rise substantially as a percentage of GDP over the next 25 years, reaching about 10% of GDP by 2035. Spending on Social Security is also projected to increase but less sharply, reaching around 6% of GDP by 2030. Together, spending on health programs and Social Security could grow to 16% of GDP by 2035 without policy changes. To put the budget on a sustainable path, lawmakers would need to significantly reduce the growth of these programs or raise revenues substantially to match the increased spending.

Recomendados
Recomendados
Mais conteúdo relacionado
Mais procurados
Mais procurados (20)
Semelhante a Long-Term Budget Outlook
Semelhante a Long-Term Budget Outlook (20)
Mais de webmommee SuperMom
Mais de webmommee SuperMom (8)
Último
Último (20)
Long-Term Budget Outlook
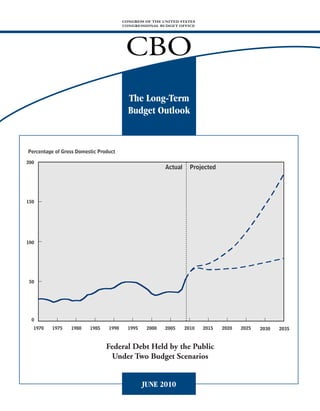
- 1. CONGRESS OF THE UNITED STATES CONGRESSIONAL BUDGET OFFICE CBO The Long-Term Budget Outlook Percentage of Gross Domestic Product 200 Actual Projected 150 100 50 0 1970 1975 1980 1985 1990 1995 2000 2005 2010 2015 2020 2025 2030 2035 Federal Debt Held by the Public Under Two Budget Scenarios JUNE 2010
- 3. A CBO R E P O R T The Long-Term Budget Outlook June 2010 The Congress of the United States O Congressional Budget Office
- 4. Notes Unless otherwise indicated, the years referred to in this report are federal fiscal years (which run from October 1 to September 30). Numbers in the text and tables may not add up to totals because of rounding. In this report, “recently enacted health care legislation” refers to the Patient Protection and Affordable Care Act (Public Law 111-148) and the Health Care and Education Reconciliation Act of 2010 (P.L. 111-152). The figure on the cover shows federal debt held by the public under the Congressional Budget Office’s extended-baseline scenario (lower line) and alternative fiscal scenario (upper line). The extended-baseline scenario adheres closely to current law, following CBO’s 10-year base- line budget projections through 2020 (with adjustments for the aforementioned health care legislation) and then extending the baseline concept for the rest of the long-term projection period. The alternative fiscal scenario incorporates several changes to current law that are widely expected to occur or that would modify some provisions of law that might be difficult to sustain for a long period. Supplementary data underlying the long-term budget scenarios are posted along with this report on CBO’s Web site (www.cbo.gov). CBO
- 5. Preface T his Congressional Budget Office (CBO) report examines the pressures on the federal budget by presenting the agency’s projections of federal spending and revenues over the com- ing decades. Under current laws and policies, an aging population and rapidly rising health care costs will sharply increase federal spending for health care programs and Social Security. Unless revenues increase at a similar pace, such spending will cause federal debt to grow to unsustainable levels. If policymakers are to put the nation on a sustainable budgetary path, they will need to let revenues increase substantially as a percentage of gross domestic product, decrease spending significantly from projected levels, or adopt some combination of those two approaches. This report was prepared under the supervision of Joyce Manchester, with assistance and help- ful comments from many others at CBO. Noah Meyerson wrote Chapter 1, with contribu- tions from Jonathan Huntley, Benjamin Page, and Sam Papenfuss. Philip Ellis, Lyle Nelson, and Julie Topoleski were the authors of Chapter 2. Noah Meyerson wrote Chapter 3, and Joshua Shakin wrote Chapter 4. Michael Simpson wrote the appendixes. Charles Pineles- Mark, Jonathan Schwabish, Michael Simpson, and Julie Topoleski developed the long-term simulations, and Marika Santoro and Michael Simpson prepared the macroeconomic simula- tions. David Weiner coordinated the revenue simulations, which were prepared by Paul Burn- ham, Grant Driessen, Ed Harris, Larry Ozanne, Kurt Seibert, and Joshua Shakin. Sarah Axeen and David Munroe provided research assistance. Christine Bogusz, Christian Howlett, and Loretta Lettner edited and proofread the report, with assistance from Leah Mazade and Sherry Snyder. Maureen Costantino and Jeanine Rees prepared the report for publication, and Maureen Costantino designed the cover. Monte Ruffin printed the initial copies, Linda Schimmel handled the print distribution, and Simone Thomas prepared the electronic version for CBO’s Web site (www.cbo.gov). Douglas W. Elmendorf Director June 2010 CBO
- 7. Contents Summary ix 1 The Long-Term Outlook for the Federal Budget 1 Alternative Scenarios for the Long-Term Budget Outlook 2 The Long-Term Outlook for Spending 6 The Long-Term Outlook for Revenues 12 The Size of the Fiscal Imbalance 13 Uncertainty of Long-Term Budget Projections 16 The Economic Impact of Rising Federal Debt 17 Changes in CBO’s Long-Term Projections Since June 2009 22 2 The Long-Term Outlook for Mandatory Spending on Health Care 25 Overview of Current Financing for Health Care 27 The Historical Growth of Health Care Spending 29 CBO’s Projection Methodology 31 Recent Health Care Legislation 33 Long-Term Projections of Mandatory Federal Spending 36 Slowing the Growth of Health Care Costs 44 3 The Long-Term Outlook for Social Security 45 How Social Security Works 45 The Outlook for Social Security Spending and Revenues 46 Changes in CBO’s Long-Term Social Security Projections Since June 2009 50 Slowing the Growth of Social Security Spending 50 4 The Long-Term Outlook for Revenues 51 Revenues Over the Past 40 Years 53 Revenue Projections Under CBO’s Long-Term Budget Scenarios 54 Changes in CBO’s Long-Term Revenue Projections Since June 2009 59 Implications of the Long-Term Revenue Scenarios 60 CBO
- 8. VI THE LONG-TERM BUDGET OUTLOOK A Long-Term Projections Through 2080 65 B Demographic and Economic Variables Underlying CBO’s Analysis 73 CBO
- 9. CONTENTS THE LONG-TERM BUDGET OUTLOOK VII Tables 1 1. Assumptions About Spending and Revenues Underlying CBO’s Long Term Budget Scenarios 3 1 2. Projected Spending and Revenues Under CBO’s Long Term Budget Scenarios 7 1 3. The Federal Fiscal Gap Under CBO’s Long Term Budget Scenarios 15 2 1. Excess Cost Growth in Spending for Health Care 31 2 2. Financial Measures for Medicare’s Hospital Insurance Trust Fund Under CBO’s Extended Baseline Scenario 44 3 1. Financial Measures for Social Security Under CBO’s Long Term Budget Scenarios 49 4 1. Assumptions About Revenues Underlying CBO’s Long Term Budget Scenarios 54 4 2. Sources of Growth in Total Revenues as a Share of GDP Between 2010 and 2035 Under CBO’s Extended Baseline Scenario 55 4 3. Estimates of Effective Marginal Tax Rates Under CBO’s Extended Baseline Scenario 61 4 4. Individual Income and Payroll Taxes as a Share of Income Under CBO’s Extended Baseline Scenario 63 Figures 1 1. Revenues and Primary Spending, by Category, Under CBO’s Long Term Budget Scenarios 5 1 2. Federal Debt Held by the Public Under CBO’s Long Term Budget Scenarios 14 1 3. Reductions in Primary Spending or Increases in Revenues in Various Years Needed to Close the 25 Year Fiscal Gap Under CBO’s Alternative Fiscal Scenario 16 1 4. Various Paths for Primary Spending That Would Close the 25 Year Fiscal Gap Under CBO’s Alternative Fiscal Scenario 17 1 5. Real GDP per Capita Under Stable Economic Conditions or with Crowding Out Effects 20 1 6. Federal Debt Held by the Public With and Without Crowding Out Effects 21 1 7. Comparison of CBO’s 2009 and 2010 Budget Projections Under the Extended Baseline Scenario 23 1 8. Comparison of CBO’s 2009 and 2010 Budget Projections Under the Alternative Fiscal Scenario 24 2 1. Distribution of Spending for Health Services and Supplies, 2008 27 CBO
- 10. VIII THE LONG-TERM BUDGET OUTLOOK Figures (Continued) 2 2. Mandatory Federal Spending on Health Care, by Category, Under CBO’s Extended Baseline Scenario 38 2 3. Mandatory Federal Spending on Health Care Under CBO’s Long Term Budget Scenarios 39 2 4. Comparison of CBO’s 2009 and 2010 Projections of Mandatory Federal Spending on Health Care Under the Extended Baseline Scenario 42 2 5. Mandatory Federal Spending on Health Care Under CBO’s Alternative Fiscal Scenario and Different Assumptions About Excess Cost Growth 43 3 1. Spending for Social Security Under CBO’s Long Term Budget Scenarios 46 3 2. The Population Age 65 or Older as a Percentage of the Population Ages 20 to 64 47 4 1. Total Revenues Under CBO’s Long Term Budget Scenarios 52 4 2. Revenues, by Source, 1970 to 2009 53 4 3. Individual Income Tax Revenues Under CBO’s Extended Baseline Scenario and Two Variants 56 4 4. The Impact of the Alternative Minimum Tax on Individual Income Tax Liability Under CBO’s Extended Baseline Scenario, 2009 to 2035 60 A 1. Revenues and Primary Spending, by Category, Under CBO’s Long Term Budget Scenarios Through 2080 66 A 2. Federal Debt Held by the Public Under CBO’s Long Term Budget Scenarios Through 2080 67 A 3. Comparison of CBO’s 2009 and 2010 Budget Projections Under the Extended Baseline Scenario Through 2080 68 A 4. Comparison of CBO’s 2009 and 2010 Budget Projections Under the Alternative Fiscal Scenario Through 2080 69 A 5. Spending for Social Security Under CBO’s Long Term Budget Scenarios Through 2080 70 A 6. Total Revenues Under CBO’s Long Term Budget Scenarios Through 2080 71 Boxes 1 1. The Statutory Pay As You Go Act of 2010 4 1 2. How the Aging of the Population and Rising Costs for Health Care Affect Federal Spending on Major Mandatory Programs 10 2 1. National Spending on Health Care 40 CBO
- 11. Summary R ecently, the federal government has been record- ing the largest budget deficits, as a share of the economy, The Outlook for Major Health Care Programs and Social Security since the end of World War II. As a result of those defi- CBO projects that if current laws do not change, federal cits, the amount of federal debt held by the public has spending on major mandatory health care programs will surged. At the end of 2008, that debt equaled 40 percent grow from roughly 5 percent of GDP today to about of the nation’s annual economic output (as measured 10 percent in 2035 and will continue to increase there- by gross domestic product, or GDP), a little above the after.1 Those projections include all of the effects of the 40-year average of 36 percent. Since then, large budget recently enacted health care legislation, which is expected deficits have caused debt held by the public to shoot to increase federal spending in the next 10 years and for upward; the Congressional Budget Office (CBO) projects most of the following decade.2 By 2030, however, that that federal debt will reach 62 percent of GDP by the end legislation will slightly reduce federal spending for health of this year—the highest percentage since shortly after care if all of its provisions are fully implemented, CBO World War II. The sharp rise in debt stems partly from projects. That reduction in the level of spending in 2030 lower tax revenues and higher federal spending related to yields lower projections of health care spending in the the recent severe recession and turmoil in financial mar- longer term—even though, owing to the great uncertain- kets. However, the growing debt also reflects an imbal- ties involved in projecting such spending many decades ance between spending and revenues that predated those in the future, enactment of the legislation did not cause economic developments. CBO to change its estimates of longer-term growth rates for spending on the government’s health care programs. As the economy recovers and the policies adopted to counteract the recession and the financial turmoil phase Under current law, spending on Social Security is also out, budget deficits will probably decline markedly in the projected to rise over time as a share of GDP, albeit much next few years. But over the long term, the budget out- look is daunting. The retirement of the baby-boom gen- 1. Mandatory programs are ones that do not require annual appro- eration portends a significant and sustained increase in priations by the Congress; the major mandatory health programs the share of the population receiving benefits from Social consist of Medicare, Medicaid, the Children’s Health Insurance Security, Medicare, and Medicaid. Moreover, per capita Program, and health insurance subsidies that will be provided spending for health care is likely to continue rising faster through the exchanges established by the recently enacted health than spending per person on other goods and services for care legislation. many years (although the magnitude of that gap is very 2. For details, see Congressional Budget Office, letter to the Honor- uncertain). Without significant changes in government able Nancy Pelosi about the budgetary effects of H.R. 4872, the Reconciliation Act of 2010 (March 20, 2010), and Chapter 2 of policy, those factors will boost federal outlays sharply this report. If all of its provisions are carried out, the legislation relative to GDP in coming decades under any plausible will also increase federal revenues and reduce budget deficits over assumptions about future trends in the economy, demo- the 2010–2019 period and in subsequent years, according to esti- graphics, and health care costs. mates by CBO and the staff of the Joint Committee on Taxation. CBO
- 12. X THE LONG-TERM BUDGET OUTLOOK less dramatically. CBO projects that Social Security percentages thereafter. At the same time, government spending will increase from less than 5 percent of GDP spending on everything other than the major mandatory today to about 6 percent in 2030 and then stabilize at health care programs, Social Security, and interest on fed- roughly that level. eral debt—activities such as national defense and a wide variety of domestic programs—would decline to the low- All told, CBO projects, the aging of the population and est percentage of GDP since before World War II. the rising cost of health care will cause spending on the major mandatory health care programs and Social Secu- That significant increase in revenues and decrease in rity to grow from roughly 10 percent of GDP today to the relative importance of other spending would offset about 16 percent of GDP 25 years from now if current much—though not all—of the rise in spending on health laws are not changed. (By comparison, spending on all of care programs and Social Security. As a result, debt would the federal government’s programs and activities, exclud- increase from its already high levels relative to GDP, as ing interest payments on debt, has averaged 18.5 percent would the required interest payments on that debt. of GDP over the past 40 years.) To put U.S. fiscal policy Federal debt held by the public would grow from an on a sustainable path, lawmakers would have to substan- estimated 62 percent of GDP this year to about 80 per- tially reduce the growth in outlays for those programs cent by 2035. Interest payments, which absorb federal relative to the amounts that CBO is projecting—or else resources that could otherwise be used to pay for govern- match that growth with equivalent declines in other ment services, currently amount to more than 1 percent federal spending, corresponding increases in federal of GDP; under this scenario, they would rise to 4 percent revenues, or some combination of the two. of GDP (or one-sixth of federal revenues) by 2035. The budget outlook is much bleaker under the alternative Alternative Long-Term Scenarios fiscal scenario, which incorporates several changes to cur- In this report, CBO presents the long-term budget pic- rent law that are widely expected to occur or that would ture under two scenarios that embody different assump- modify some provisions of law that might be difficult to tions about future policies governing federal revenues and sustain for a long period. In this scenario, CBO assumed spending. Budget projections grow increasingly uncertain that Medicare’s payment rates for physicians would grad- as they extend farther into the future, so this report ually increase (which would not happen under current focuses largely on the next 25 years. However, because law) and that several policies enacted in the recent health considerable interest exists in the longer-term outlook, care legislation that would restrain growth in health care figures showing projections through 2080 are presented spending would not continue in effect after 2020. In in Appendix A, and associated data are available on addition, under the alternative scenario, spending on CBO’s Web site. activities other than the major mandatory health care programs, Social Security, and interest would fall below The first long-term budget scenario used in this analysis, the average level of the past 40 years relative to GDP, the extended-baseline scenario, adheres closely to current though not as low as under the extended-baseline sce- law. It incorporates CBO’s current estimate of the impact nario. More important, CBO assumed for this scenario of the recently enacted health care legislation on revenues that most of the provisions of the 2001 and 2003 tax cuts and mandatory spending. (That estimate is unchanged would be extended, that the reach of the alternative mini- from the one that CBO and the staff of the Joint Com- mum tax would be kept close to its historical extent, and mittee on Taxation published in March, when the legisla- that over the longer run, tax law would evolve further so tion was being considered.) Under this scenario, the expi- that revenues would remain at about 19 percent of GDP, ration of most of the tax cuts enacted in 2001 and 2003, near their historical average. the growing reach of the alternative minimum tax, and the way in which the tax system interacts with economic Under that combination of policy assumptions, federal growth would result in steadily higher average tax rates. debt would grow much more rapidly than under the Those rising rates, combined with the tax provisions of extended-baseline scenario. With significantly lower reve- the recent health care legislation, would push total reve- nues and higher outlays, debt would reach 87 percent of nues to 23 percent of GDP by 2035—much higher than GDP by 2020, CBO projects. After that, the growing has typically been seen in recent decades—and to larger imbalance between revenues and noninterest spending, CBO
- 13. SUMMARY THE LONG-TERM BUDGET OUTLOOK XI combined with spiraling interest payments, would swiftly abroad, and less domestic investment—which in turn push debt to unsustainable levels. Debt as a share of GDP would lower income growth in the United States. would exceed its historical peak of 109 percent by 2025 and would reach 185 percent in 2035. B Growing debt would also reduce lawmakers’ ability to respond to economic downturns and other challenges. Neither of those scenarios represents a prediction by CBO of what policies will be in effect during the next B Over time, higher debt would increase the probability several decades. The policies adopted in coming years will of a fiscal crisis in which investors would lose confi- surely differ from those assumed for the scenarios. (And dence in the government’s ability to manage its even if the assumed policies were adopted, their economic budget, and the government would be forced to pay and budgetary consequences would certainly differ from much more to borrow money. those projected in this report.) Nevertheless, these projec- tions, encompassing two very different sets of policy Keeping deficits and debt from growing to unsustainable assumptions, provide a clear indication of the serious levels would require raising revenues as a percentage of nature of the fiscal challenge facing the nation. GDP significantly above past levels, reducing outlays sharply relative to CBO’s projections, or some combina- tion of those approaches. Making such changes while The Impact of Growing economic activity and employment remain well below Deficits and Debt their potential levels would probably slow the economic In fact, CBO’s projections understate the severity of the recovery. However, the sooner that long-term changes to long-term budget problem because they do not incorpo- spending and revenues are agreed on, and the sooner they rate the significant negative effects that accumulating are carried out once the economic weakness ends, the substantial amounts of additional federal debt would smaller will be the damage to the economy from growing have on the economy: federal debt. Earlier action would require more sacrifices by earlier generations to benefit future generations, but it B Large budget deficits would reduce national saving, would also permit smaller or more gradual changes and leading to higher interest rates, more borrowing from would give people more time to adjust to them. CBO
- 15. CHAPTER 1 The Long-Term Outlook for the Federal Budget T he federal government has recently been recording the largest budget deficits, relative to the size of the econ- Looking beyond the next decade, the fiscal outlook wors- ens further. Although long-term budget projections are omy, since 1945. As a result, the amount of federal debt highly uncertain, if current laws were followed, the aging held by the public has surged. Debt is expected to equal of the population and rising costs for health care would 62 percent of the economy’s annual output, or gross almost certainly cause federal spending to rise sharply domestic product (GDP), at the end of this fiscal year, up relative to GDP. Federal revenues would increase to sig- from 40 percent at the end of 2008. That sharp deteriora- nificantly higher levels under current law than have ever tion in the fiscal situation reflects several factors: an been seen in the United States, but they would still fall imbalance between spending and revenues that predated short of spending, according to CBO’s long-term projec- the recent recession and the turmoil in financial markets; tions. Consequently, federal debt would grow relative to a decline in tax revenues and an increase in spending on the size of the economy after the next decade. By 2035, it benefit programs caused by those economic problems; would equal 79 percent of GDP—the highest percentage and the costs of federal policies enacted in response to the in U.S. history except for the period between 1944 and problems. 1950. If current laws were to remain unchanged, the budget An alternative scenario presented in this report incor- deficit would drop markedly as a percentage of GDP porates several changes to current law that are widely in the next few years, the Congressional Budget Office expected to occur or that would modify some provisions (CBO) projects, and federal debt held by the public of law that might be difficult to sustain for a long period. would stabilize at about 67 percent of GDP for the next If such changes occurred—maintaining what some ana- decade.1 Those baseline projections, however, understate lysts might consider “current policy” as opposed to cur- the budget deficits that would arise if policies that are in rent law—revenues would increase much more slowly effect now or have been in effect recently were extended, than spending, and federal debt would balloon to 185 instead of implementing what current laws specify for percent of GDP by 2035. As debt grows, so does the bur- future years. Specifically, if most provisions of the tax cuts den of paying interest on it; thus, under that alternative enacted in 2001 and 2003 were extended rather than scenario, interest outlays would rise from about 1 percent allowed to expire as scheduled, if provisions designed to of GDP today to 9 percent by 2035. With still larger limit the reach of the alternative minimum tax (AMT) amounts of debt projected for later years under that sce- were also extended, and if annual appropriations kept nario, such a path for federal borrowing would clearly be pace with the growth of GDP, by 2020 the budget unsustainable. deficit would be growing steadily. In that case, debt held by the public would reach almost 90 percent of Moreover, the projected outcomes under both scenarios GDP in 2020. do not include the harmful effects that rising debt would have on economic growth and interest rates. If those 1. See Congressional Budget Office, An Analysis of the President’s effects were taken into account, projected debt would Budgetary Proposals for Fiscal Year 2011 (March 2010). increase even faster. CBO
- 16. 2 THE LONG-TERM BUDGET OUTLOOK If policymakers are to put the nation on a sustainable rent tax law, federal revenues would grow significantly budgetary path, they will need to let revenues increase faster than GDP over the long run under this scenario. substantially as a percentage of GDP, decrease spending significantly from projected levels, or adopt some combi- B The alternative fiscal scenario embodies several possible nation of those two approaches. With economic activity changes to current law that would continue certain tax and employment currently well below the levels that and spending policies that people have grown accus- could be achieved by fully utilizing the nation’s labor tomed to (because the policies are in place now or force and capital stock, raising revenues or curbing have been in place recently). Versions of some of the spending immediately would probably slow the economic changes assumed in the scenario—such as those recovery. However, the sooner that long-term changes to related to the AMT and Medicare’s payments to spending and revenues are agreed on, and the sooner they physicians—have regularly been enacted in the past. are implemented after the period of economic weakness, Those and certain other changes included in the sce- the smaller will be the damage to the economy from nario—such as changes related to the tax cuts enacted rising federal debt. in 2001 and 2003—are widely expected to be made in some form over the next few years. If they are, they Alternative Scenarios for the will receive special treatment under the Statutory Pay- Long-Term Budget Outlook As-You-Go Act of 2010 (Public Law 111-139), which In this report, CBO presents two sets of long-term bud- excludes some of the costs of such changes from the get projections that are based on differing assumptions law’s budget enforcement rules. (For details, see about future policy (see Table 1-1): Box 1-1.) B The extended-baseline scenario adheres most closely to After 2020, the alternative fiscal scenario also incor- current law. It follows CBO’s March 2010 baseline porates potential modifications to several provisions of budget projections (adjusted for the effects of recently current law that might be difficult to sustain for a long enacted health care legislation) for the next decade and period. Those provisions include certain restraints on then extends the baseline concept beyond that 10-year the growth of spending for Medicare and indexing window.2 This scenario incorporates CBO’s current provisions that will slow the growth of subsidies for estimate of the impact of the recent health care legisla- health insurance coverage. Other provisions of current tion on revenues and mandatory spending; that esti- law, if continued, would cause tax revenues as a per- mate is unchanged from March. The current-law centage of GDP to ultimately rise well above the levels assumption of the extended-baseline scenario implies that U.S. taxpayers have seen in the past. Therefore, that many adjustments that lawmakers have routinely the alternative fiscal scenario also incorporates unspec- made in the past—such as changes to the AMT and to ified changes in tax law that would keep revenues the Medicare program’s payments to physicians—will constant as a share of GDP after 2020. Together, the not be made again.3 Because of the structure of cur- changes in the alternative fiscal scenario represent one interpretation of what it would mean to continue 2. CBO’s baseline is a benchmark for measuring the budgetary effects of proposed changes to federal revenues or spending. It today’s underlying fiscal policy. However, different consists of projections of budget authority, outlays, revenues, and analysts might perceive the underlying intention of the deficit or surplus over 10 years calculated according to rules set current policy differently. forth in the Balanced Budget and Emergency Deficit Control Act of 1985. Those projections are not intended to be predictions of The projections in this report understate the size of the future budgetary outcomes; rather, they represent CBO’s best budgetary shortfalls that would be likely to result from judgment of how economic and other factors would affect federal such fiscal policies. For the purposes of the projections, revenues and spending if current laws did not change. CBO assumed stable economic conditions after 2020— 3. The alternative minimum tax is a parallel income tax system with in particular, a constant real (inflation-adjusted) interest fewer exemptions, deductions, and rates than the regular income tax. Households must calculate the amount they owe under both rate on federal debt and steady growth rates for real wages the AMT and the regular income tax and pay the larger of the two and output. That approach omits the pressures that a amounts. rise in debt as a percentage of GDP would have on real CBO
- 17. CHAPTER ONE THE LONG-TERM BUDGET OUTLOOK 3 Table 1-1. Assumptions About Spending and Revenues Underlying CBO’s Long-Term Budget Scenarios Extended-Baseline Scenario Alternative Fiscal Scenario Assumptions About Spending Medicare As scheduled under current law As scheduled under current law, except that payment rates for physicians grow with the Medicare economic index (rather than at the lower rates of the sustainable growth rate mechanism) and that after 2020, several policies that would restrain spending growth are assumed not to be in effect Medicaid and Exchange As scheduled under current law As scheduled under current law, except that after 2020, Subsidies a policy that would slow the growth of subsidies for health insurance coverage is assumed not to be in effect CHIP As projected in CBO's baseline through 2020; adjusted As projected in CBO's baseline through 2020; adjusted for growth in per capita GDP and the size of the for growth in per capita GDP and the size of the under-18 population thereafter under-18 population thereafter Social Security As scheduled under current law As scheduled under current law Other Noninterest As projected in CBO's baseline through 2020; remaining As projected in CBO's baseline through 2013; remaining at Spending at the 2020 level as a share of GDP thereafter, except the 2010 level as a share of GDP (minus stimulus and related that some refundable tax credits, Medicare premiums, spending) thereafter, except that some refundable tax credits, and certain payments by states to Medicare are as Medicare premiums, and certain payments by states to Medicare scheduled under current law are as scheduled under current law Assumptions About Revenues Individual Income Taxes As scheduled under current law Through 2020, tax cuts from EGTRRA and JGTRRA are extended (except for rate reductions that apply to high-income taxpayers) and AMT relief is extended; thereafter, individual income taxes are adjusted to keep total revenues constant as a share of GDP Payroll Taxes As scheduled under current law As scheduled under current law Corporate Income Taxes As scheduled under current law through 2020; remaining As scheduled under current law through 2020; remaining constant as a share of GDP thereafter constant as a share of GDP thereafter Excise Taxes As scheduled under current law As scheduled under current law though 2020; remaining constant as a share of GDP thereafter Estate and Gift Taxes As scheduled under current law 2009 tax rates and exemption amount (adjusted for inflation) continue through 2020; revenues are constant as a share of GDP thereafter Other Sources of Revenue As scheduled under current law through 2020; remaining As scheduled under current law through 2020; remaining constant as a share of GDP thereafter constant as a share of GDP thereafter Source: Congressional Budget Office. Notes: The extended-baseline scenario adheres closely to current law, following CBO’s 10-year baseline budget projections through 2020 (with adjustments for the recently enacted health care legislation) and then extending the baseline concept for the rest of the long- term projection period. The alternative fiscal scenario incorporates several changes to current law that are widely expected to occur or that would modify some provisions that might be difficult to sustain for a long period. CHIP = Children’s Health Insurance Program; GDP = gross domestic product; EGTRRA = Economic Growth and Tax Relief Recon- ciliation Act of 2001; JGTRRA = Jobs and Growth Tax Relief Reconciliation Act of 2003; AMT = alternative minimum tax. CBO
- 18. 4 THE LONG-TERM BUDGET OUTLOOK Box 1-1. The Statutory Pay-As-You-Go Act of 2010 In February 2010, lawmakers enacted a new version Act provides special treatment for legislation that of some of the budget enforcement procedures that does the following: were in effect in the 1990s. The Statutory Pay-As- You-Go Act of 2010 (Public Law 111-139) aims to B Amends or supersedes the system for updating make sure that most new legislation affecting reve- Medicare’s payments to physicians; nues or mandatory spending does not increase federal budget deficits. The law requires the Congressional B Continues the parameters of the estate and gift Budget Office (CBO) to estimate the potential bud- taxes at their 2009 levels, adjusted for inflation; getary effects of proposed legislation that is subject to the new procedures; it also requires the Office of B Adjusts the exemption amounts under the alterna- Management and Budget to keep a running tally of tive minimum tax to keep the number of people the average annual budgetary impact of any such leg- affected by that tax at the same level as in 2008; or islation that is enacted.1 If, at the end of a Congres- sional session, the tally shows a net cost for the bud- B Extends certain expiring provisions of the Eco- get year from such legislation, the Administration nomic Growth and Tax Relief Reconciliation must order a sequestration—canceling certain already Act of 2001 and the Jobs and Growth Tax Relief enacted mandatory funding—to cover that cost. Reconciliation Act of 2003 for taxpayers who cur- rently make less than $250,000 (in the case of Under current law, some payment rates and tax rates couples filing joint returns) or $200,000 (in the will change significantly if they are not extended at case of single filers). their present levels. The Statutory Pay-As-You-Go Such legislation is subject to the new law’s pay-as- you-go rules. But the tally of the budgetary effects of 1. The Statutory Pay-As-You-Go Act does not apply to discre- the legislation must reflect specific “current-policy tionary funding provided in appropriation acts or to any leg- adjustments” that reduce the recorded cost of those islative provision that the Congress designates as an changes. The authority to allow for such adjustments emergency requirement. expires on January 1, 2012. interest rates and economic growth. It also omits the last year, the highest level since World War II. Those fac- impact that higher effective marginal tax rates and the tors will keep spending at roughly the same level in 2010 increasing value of government benefits would have on and 2011, CBO projects. However, as the economy incentives to work and save.4 recovers and the budgetary effects of those policies dimin- ish, primary spending is projected to decline to 20 per- The Extended-Baseline Scenario cent of GDP and remain near that level through 2020. In Under CBO’s current-law scenario, primary spending— subsequent years, primary spending would follow a long all spending except interest payments on federal debt— upward trajectory under the extended-baseline scenario, would drop relative to GDP in the next few years, level reaching 24 percent of GDP in 2035 (see the top panel of out for the rest of the decade, and grow significantly in later decades. The severe recession and financial turmoil, Figure 1-1) and 30 percent in 2080.5 (This report focuses as well as federal policies implemented in response to on primary spending because growth in debt as a share of them, pushed primary spending to 23 percent of GDP GDP is determined mainly by the relationship between revenues and primary outlays.) 4. Effective marginal tax rates on labor or capital income represent the percentage of the last dollar of such income that is taken by 5. Longer-term versions of some of the figures in this chapter are federal taxes. presented in Appendix A. CBO
- 19. CHAPTER ONE THE LONG-TERM BUDGET OUTLOOK 5 Figure 1-1. Revenues and Primary Spending, by Category, Under CBO’s Long-Term Budget Scenarios (Percentage of gross domestic product) Extended-Baseline Scenario 30 Actual Projected 25 Total Primary Spending Revenues 20 Other Noninterest Spending 15 10 Medicare, Medicaid, CHIP, and Exchange Subsidies 5 Social Security 0 2000 2005 2010 2015 2020 2025 2030 2035 Alternative Fiscal Scenario 30 Actual Projected Revenues Total Primary Spending 25 20 Other Noninterest Spending 15 10 Medicare, Medicaid, CHIP, and Exchange Subsidies 5 Social Security 0 2000 2005 2010 2015 2020 2025 2030 2035 Source: Congressional Budget Office. Notes: Primary spending refers to all spending other than interest payments on federal debt. The extended-baseline scenario adheres closely to current law, following CBO’s 10-year baseline budget projections through 2020 (with adjustments for the recently enacted health care legislation) and then extending the baseline concept for the rest of the long- term projection period. The alternative fiscal scenario incorporates several changes to current law that are widely expected to occur or that would modify some provisions that might be difficult to sustain for a long period. (For details, see Table 1-1 on page 3.) CHIP = Children’s Health Insurance Program. CBO
- 20. 6 THE LONG-TERM BUDGET OUTLOOK Revenues would also rise considerably under current law; On the revenue side, the alternative fiscal scenario by the 2020s, they would reach higher levels relative to the incorporates the assumptions that most of the cuts in size of the economy than ever recorded in the nation’s his- individual income taxes enacted in 2001 and 2003 that tory. Currently about 15 percent of GDP, revenues would are now scheduled to expire in 2011 (except the lower jump to 19 percent in 2012 as the economic recovery rates applying to high-income taxpayers) are extended increased taxable income, and thus tax receipts; as most of through 2020; that relief from the AMT, which expired the tax reductions enacted in 2001 and 2003 expired at after 2009, continues through 2020; and that the 2009 the end of 2010 as scheduled; and as the reach of the parameters of the estate tax (adjusted for inflation) apply AMT expanded greatly, because (unlike most of the tax through 2020. Thereafter, revenues are assumed to code) the dollar amounts of its parameters do not increase remain at their 2020 level of just over 19 percent of GDP, about a percentage point above the average of the past with inflation. In subsequent years, revenues would con- 40 years. That revenue path, combined with the spending tinue to rise relative to GDP, for three main reasons. First, policies described above, would produce a deficit equal to ongoing increases in real income would push taxpayers 16 percent of GDP by 2035 and would push federal debt into higher tax brackets. Second, ongoing inflation, even to levels unprecedented in the United States. Debt would if modest, would cause more people to owe tax under the exceed 100 percent of GDP by 2023 and 200 percent by AMT. And third, the recently enacted excise tax on certain 2037. high-premium health insurance plans would have a grow- ing effect on revenues. Taken together, those factors would cause federal revenues to grow faster than the econ- The Long-Term Outlook for Spending omy, reaching 23 percent of GDP in 2035 and 30 percent Excluding interest payments on debt held by the public, in 2080. federal outlays have averaged 18.5 percent of GDP over the past 40 years. Such primary spending is now unusu- However, even with revenues rising to those levels (and ally high—and is expected to remain so through next omitting the economic effects of such increases), the bud- year—because of the recent recession, tumult in financial get would still be out of balance over the long term under markets, and policies implemented in response to those the extended-baseline scenario. As a result, the deficit conditions. However, CBO projects that such outlays will decline to 20 percent of GDP by 2014. (including interest costs) would equal about 4 percent of GDP in 2035, and federal debt held by the public would Beyond that point, primary spending would rise again continue to accumulate, rising to 79 percent of GDP in under both of CBO’s long-term budget scenarios—to 2035 and larger percentages thereafter. 24 percent of GDP by 2035 under the extended-baseline scenario and to 26 percent under the alternative fiscal The Alternative Fiscal Scenario scenario (see Table 1-2). In both cases, primary outlays Under the alternative fiscal scenario, primary spending would continue to grow steadily in later years. would be 1.6 percentage points higher as a share of GDP in 2020 than under the extended-baseline scenario (see Mandatory Outlays for Health Care the bottom panel of Figure 1-1). That difference would Programs and Social Security grow in later years. The higher spending stems from sev- Federal spending for mandatory programs has grown eral assumptions of the alternative fiscal scenario: that sharply as a share of primary outlays in the past several lawmakers would act to raise Medicare’s payments to decades, reaching about 60 percent in recent years. Most physicians; that lawmakers would not allow various of that growth has been concentrated in the three largest restraints on the growth of costs for Medicare and for entitlement programs—Medicare, Medicaid, and Social health insurance subsidies to have their full effect in the decade after 2020; and that federal spending for things 6. Mandatory programs are ones that do not require annual appro- other than major mandatory programs or interest pay- priations by the Congress; the funding available for them is gener- ally not limited. Most mandatory spending is for entitlement ments would be similar to typical recent levels as a per- programs, in which the federal government is required to make centage of GDP (rather than declining through 2020, payments to any person or other entity that meets the eligibility as under the extended-baseline scenario).6 criteria set in law. CBO
- 21. CHAPTER ONE THE LONG-TERM BUDGET OUTLOOK 7 Table 1-2. Projected Spending and Revenues Under CBO’s Long-Term Budget Scenarios (Percentage of gross domestic product) 2010 2020 2035 Extended-Baseline Scenario Spending Primary spending Social Security 4.8 5.2 6.2 Medicarea 3.6 4.1 5.9 Medicaid, CHIP, and exchange subsidies 1.9 2.8 3.8 Other noninterest spending 12.5 ____ 8.3 ____ 7.8 ____ Subtotal, primary spending 22.9 20.4 23.7 Interest spending 1.4 ____ 3.1 ____ 3.9 ____ Total Spending 24.3 23.5 27.6 Revenues 14.9 20.7 23.3 Deficit (-) or Surplus Primary deficit or surplus -8.0 0.3 -0.4 Total deficit -9.4 -2.7 -4.3 Debt Held by the Publicb 62 66 79 Alternative Fiscal Scenario Spending Primary spending Social Security 4.8 5.2 6.2 Medicarea 3.6 4.3 7.0 Medicaid, CHIP, and exchange subsidies 1.9 2.9 3.9 Other noninterest spending 12.5 ____ 9.7 ____ 9.3 ____ Subtotal, primary spending 22.9 22.1 26.4 Interest spending 1.4 ____ 3.8 ____ 8.7 ____ Total Spending 24.3 25.9 35.2 Revenues 14.9 19.3 19.3 Deficit Primary deficit -8.0 -2.9 -7.2 Total deficit -9.4 -6.6 -15.9 Debt Held by the Publicb 62 87 185 Source: Congressional Budget Office. Notes: Primary spending refers to all spending other than interest payments on federal debt. The primary deficit or surplus is the difference between revenues and primary spending. The extended-baseline scenario adheres closely to current law, following CBO’s 10-year baseline budget projections through 2020 (with adjustments for the recently enacted health care legislation) and then extending the baseline concept for the rest of the long- term projection period. The alternative fiscal scenario incorporates several changes to current law that are widely expected to occur or that would modify some provisions that might be difficult to sustain for a long period. (For details, see Table 1-1 on page 3.) CHIP = Children’s Health Insurance Program. a. Spending for Medicare beneficiaries includes amounts funded through beneficiaries’ premiums. b. At the end of the year. CBO
- 22. 8 THE LONG-TERM BUDGET OUTLOOK Security. Together, federal outlays for those three pro- ever, CBO projects that the number of workers per grams accounted for an average of 46 percent of primary beneficiary will decline significantly over the next quarter spending over the past 10 years, up from 27 percent in century (from 2.9 in 2010 to 2.0 in 2035) and then will 1975. continue to drift downward. Under CBO’s scenarios, all of the projected growth in In the case of the major mandatory health care programs, primary outlays as a share of GDP in coming years stems both aging and the rapid growth of per capita health care from increases in mandatory spending, particularly in costs are responsible for the projected rise in federal spending for the government’s major health care pro- spending as a share of GDP, because more elderly people grams: Medicare, Medicaid, the Children’s Health Insur- will use increasingly expensive health care. (For a detailed ance Program (CHIP), and insurance subsidies that will breakdown of the roles played by those two factors, see be provided through the exchanges created by the Box 1-2 on page 10.) In its long-term projections, CBO recently enacted health care legislation. Under both of anticipates that spending growth for health programs will CBO’s scenarios, total outlays for those health programs moderate from past rates even if federal laws do not would roughly double as a share of GDP over the next change (see Chapter 2). Both Medicaid and CHIP are 25 years, from 5.5 percent in 2010 to about 10 percent or financed jointly by the federal government and state gov- 11 percent in 2035.7 (For details about long-term projec- ernments, so growth in federal spending is expected to tions of health care spending, see Chapter 2.) Spending slow as states move to limit their costs. And even without on Social Security would rise much more slowly, from changes to the laws governing Medicare, growth in almost 5 percent of GDP in 2009 to about 6 percent in spending on that program is projected to slow (though the 2030s and beyond (see Chapter 3). to a lesser degree than for the other health programs) because of future regulatory changes to the program and Causes of Spending Growth. Two factors account for the changes to the health care system as a whole. projected increases in outlays for the government’s large entitlement programs: the aging of the population and Effects of Recent Legislation. The health care legislation the rapid growth of health care costs per capita. The enacted in March 2010—the Patient Protection and retirement of the large baby-boom generation born Affordable Care Act (P.L. 111-148), as modified by the between 1946 and 1964 portends a long-lasting shift in Health Care and Education Reconciliation Act (P.L. 111- the age profile of the U.S. population. That shift will sub- 152)—will cause major changes in the components of stantially alter the balance between the working-age and federal spending on health care. Both the expansion of retirement-age segments of the population. The share of eligibility for Medicaid and the provision of subsidies people age 65 or older is projected to grow from 13 per- through new insurance exchanges will increase federal cent in 2010 to 20 percent in 2035, while the share of spending. At the same time, the legislation contains vari- people ages 20 to 64 is expected to fall from 60 percent to ous provisions that will substantially reduce spending on 55 percent. In later decades, the aging of the population Medicare relative to what would have occurred under is expected to continue, but at a slower rate, because of prior law. On net, the legislation will raise federal spend- increases in life expectancy. ing on health care during most of the next two decades but lower it by the end of the second decade, according to In the case of Social Security, population aging drives the the projections of CBO and the staff of the Joint Com- projected growth of spending as a percentage of GDP. mittee on Taxation (JCT). During that period, the net Initial Social Security benefits are based on an individual’s effects in either direction represent less than 0.5 percent earnings, indexed to the overall growth of wages. Because of GDP in any year. average benefits increase at approximately the same rate as average earnings, economic growth does not significantly As discussed in Chapter 2, CBO does not believe it has change Social Security spending as a share of GDP. How- an analytic basis for evaluating the effects of the legisla- tion on the growth rate of spending over the very long 7. Those totals include gross Medicare spending (that is, they do not run. Therefore, after the next decade or two (depending net out offsetting receipts, which consist mainly of premiums paid on the scenario), the projections in this report extrapolate by Medicare beneficiaries). federal spending on health care (including the incremen- CBO
- 23. CHAPTER ONE THE LONG-TERM BUDGET OUTLOOK 9 tal effects of the legislation) using the same growth rates baseline scenario—a difference that persists in later years that would be assumed in the absence of the legislation. because the growth rates of spending beyond that point Because those growth rates are applied to different levels are the same under the two scenarios. That gap highlights of spending, however, health care spending varies from the important implications of those health care policies the amounts that would be projected without that legisla- for the federal budget. tion for the rest of the long-term projection period. Under both scenarios, the trust funds for Social Security Differences Between the Long-Term Scenarios. Spending and Part A of Medicare would become insolvent during for Social Security would be identical under CBO’s the long-term projection period.10 However, to measure extended-baseline and alternative fiscal scenarios, and the imbalance between the revenues and the outlays for spending for Medicaid, CHIP, and the exchange subsidies benefits currently specified in law, CBO assumed that the would be very similar. In the case of Medicare, however, two programs would continue to pay benefits as now spending would be about 1 percentage point higher rela- scheduled. (Spending for other parts of Medicare also tive to GDP in 2035 under the alternative fiscal scenario flows through a trust fund, but automatic infusions of than under the extended-baseline scenario, and the differ- general funds effectively ensure that it cannot become ence would widen to 2 percentage points by 2080. Those insolvent. Medicaid has no underlying trust fund.) projected spending paths differ for two main reasons: B Under the current-law assumptions of the extended- Other Federal Outlays baseline scenario, Medicare’s sustainable growth rate A larger difference between the two scenarios involves mechanism would reduce payment rates for physicians projections of federal spending for everything besides the by 21 percent this year, with additional smaller reduc- major mandatory health programs and Social Security. tions for the next few years.8 Under the alternative fis- Other primary spending (net of Medicare premiums and cal scenario, by contrast, Medicare’s payment rates for other offsetting receipts) would total about 8 percent of physicians would be stable in 2010 and then increase GDP in 2020 under the extended-baseline scenario and gradually. about 10 percent under the alternative fiscal scenario, declining slowly thereafter in both cases. Under the B The extended-baseline scenario incorporates the extended-baseline scenario, interest payments by the gov- effects of the recent health care legislation, as esti- ernment would increase to almost 4 percent of GDP by mated by CBO and JCT, over the next 20 years and 2035 and then remain close to that level thereafter. Under then extrapolates those effects on spending levels in the alternative fiscal scenario, interest spending would later years.9 By contrast, the alternative fiscal scenario equal 9 percent of GDP in 2035 and would continue to incorporates the estimated effects of that legislation rise dramatically—by 2055, it would exceed that year’s for only 10 years and then extrapolates the estimated total federal revenues. changes in spending levels beyond that. In particular, several policies that would restrain the growth of Other Noninterest Spending Under the Extended- spending for Medicare are assumed in the alternative Baseline Scenario. For the extended-baseline scenario, scenario not to be in effect after 2020, yielding a CBO used its 2010–2020 baseline projections of outlays higher level of spending in the 2020s and beyond. for programs other than the major mandatory health care programs and Social Security. This year, about one- The upshot of those differences is that Medicare spending seventh of those outlays (or about 1.9 percent of GDP) in 2035 is projected to be about 17 percent higher under the alternative fiscal scenario than under the extended- are associated with the federal government’s response to 10. The balances of those trust funds represent the total amount that 8. Those projections do not include the effects of recent legislation the government is legally authorized to spend on each program. that delayed the reduction in payment rates until December 2010. For a discussion of the legal issues related to trust fund insolvency, 9. See Congressional Budget Office, letter to the Honorable Nancy see Christine Scott, Social Security: What Would Happen If the Pelosi about the budgetary effects of H.R. 4872, the Reconcilia- Trust Funds Ran Out? Report for Congress RL33514 (Congres- tion Act of 2010 (March 20, 2010). sional Research Service, August 20, 2009). CBO
- 24. 10 THE LONG-TERM BUDGET OUTLOOK Box 1-2. How the Aging of the Population and Rising Costs for Health Care Affect Federal Spending on Major Mandatory Programs In the Congressional Budget Office’s (CBO’s) long- health care programs and Social Security: the aging of term projections of spending, growth in noninterest the U.S. population, which increases the number of spending as a share of gross domestic product (GDP) beneficiaries in those programs, and rapid growth in is attributable entirely to increases in spending on health care costs per beneficiary. CBO calculated how several large mandatory programs: Social Security, much of the projected rise in federal spending for the Medicare, Medicaid, and (to a lesser extent) insur- health care programs and Social Security under the ance subsidies that will be provided through the extended-baseline scenario is attributable to aging exchanges established by the recently enacted health and how much is attributable to “excess cost care legislation.1 The health programs are the main growth”—the extent to which health care costs per drivers of that growth; they are responsible for enrollee (adjusted for changes in the age profile of the 80 percent of the total projected rise in spending on population) grow faster than GDP per capita. CBO those mandatory programs over the next 25 years. made that calculation by comparing the outlays pro- jected under the extended-baseline scenario with the Two factors underlie the projected increase in federal outlays that would occur under two alternative paths: spending on the government’s major mandatory one with an aging population but no excess cost growth for health care programs, and one with no aging but with excess cost growth. 1. Under the new law, certain people with income up to 400 percent of the federal poverty level will be eligible for federal subsidies to reduce their cost of obtaining private The interaction between the aging of the population health insurance coverage. Although the premium subsidies and excess cost growth accentuates their individual are structured as tax credits, most of the funds involved will effects. As aging causes the number of beneficiaries of be classified as outlays because their value will generally Medicare and Medicaid to rise, higher health care exceed what recipients’ income tax liability would otherwise spending per person has a larger impact. Conversely, be. CBO’s spending projections for major mandatory health care programs also include the Children’s Health Insurance when health care costs are growing, having more Program, but spending on that program constitutes less than beneficiaries imposes a larger budgetary cost. That 0.1 percent of GDP. interaction can be identified separately, or—as in Continued the recent recession.11 Over the coming decade, such expected to equal 1.1 percent of GDP this year)—is spending is either scheduled to expire under current law assumed to increase at the same rate as inflation through or is explicitly assumed in CBO’s projections to be tem- 2020. Because output generally grows faster than prices porary and not to recur. Much of the rest of the govern- do, that spending is projected to shrink as a share of ment’s other noninterest spending—including spending GDP: from 12.5 percent this year to 10.9 percent in on military operations in Iraq and Afghanistan (which is 2012 and 8.3 percent in 2020. 11. The total amount of 1.9 percent of GDP includes outlays from For later years, other noninterest outlays are generally the American Recovery and Reinvestment Act of 2009 (Public assumed to remain constant at their 2020 levels as a share Law 111-5) and the portion of outlays for unemployment insur- of GDP under the extended-baseline scenario. However, ance and the Supplemental Nutrition Assistance Program (for- two components of that spending were modeled merly known as Food Stamps) that CBO estimates would not occur if economic output were at its potential level. For a related explicitly. First, premiums paid by Medicare beneficiaries discussion, see Congressional Budget Office, The Effects of Auto- and certain payments by states to Medicare—which matic Stabilizers on the Federal Budget (May 2010). are classified as offsetting receipts (that is, as offsets to CBO
- 25. CHAPTER ONE THE LONG-TERM BUDGET OUTLOOK 11 Box 1-2. Continued How the Aging of the Population and Rising Costs for Health Care Affect Federal Spending on Major Mandatory Programs Explaining Projected Growth in Federal effect on spending for Social Security. Given the sub- Spending on Major Mandatory Health Care stantial uncertainties that exist about long-term rates Programs and Social Security by of cost growth for health care, much more caution 2035 and 2080, by Source should be applied to those longer-term projections. (Percent) (For a discussion of the rates of excess cost growth Excess Cost that underlie those calculations, and the basis for Aging Growth them, see Chapter 2.) Major Health Care Programs Looking only at the major health care programs, and Social Security CBO found excess cost growth to be the main factor 2035 63 37 responsible for the projected increase in federal 2080 44 56 spending for those programs. Specifically, excess Major Health Care Programs cost growth accounts for 55 percent of the programs’ projected growth by 2035 and 71 percent by 2080. 2035 45 55 2080 29 71 Again, the precision of those calculations should not be taken as an indication of certainty. Future rates of Source: Congressional Budget Office. aging and especially of excess cost growth could differ substantially from CBO’s assumptions, particularly in CBO’s analysis—it can be allocated according to the the longer term. shares attributable to aging and excess cost growth. Of the two factors, aging is the more important over Sources of Growth in Federal Spending on the next 25 years. With the interaction allocated Major Mandatory Health Care Programs and between the two, aging accounts for 63 percent of the Social Security, 2010 to 2035 total projected growth in spending on Social Security (Percentage of gross domestic product) and the major mandatory health care programs by 2035, and excess cost growth accounts for 37 percent 18 Effect of Excess (see the table above and the figure at right). That 16 Cost Growth result is not surprising given that the aging of the 14 baby-boom generation will significantly expand the 12 number of people participating in many of those Effect of Aging 10 programs. 8 6 Spending in the Absence of Over the longer term, however, the situation changes. Aging and Excess Cost Growth By 2080, excess cost growth is responsible for 56 per- 4 cent of the total projected growth in federal spending 2 on the health care programs and Social Security, and 0 the share attributable to aging falls to 44 percent. The 2010 2015 2020 2025 2030 2035 impact of excess cost growth is felt only in the health care programs; rising health care costs have no direct Source: Congressional Budget Office. CBO
- 26. 12 THE LONG-TERM BUDGET OUTLOOK outlays) and which will equal 0.4 percent of GDP in its 10-year baseline projections, CBO projects that inter- 2010—are projected to increase at the same rate as gross est spending will increase again—to 2.0 percent of GDP Medicare outlays.12 When those offsetting receipts rise, in 2013 and 3.1 percent in 2020—as federal debt grows total spending falls. Second, the refundable portions of and interest rates rebound from their recent unusually the earned income tax credit and the child tax credit, low levels. which the budget records as outlays, were modeled along with revenues. Such refunds are projected to decrease For the long-term budget projections, CBO assumed that over time as incomes rise. Because of the projected interest rates would remain stable after 2020, meaning changes in those two components, other primary spend- that interest outlays would grow at the same pace as fed- ing is projected to decline to 7.8 percent of GDP by eral debt. Under the extended-baseline scenario, annual 2035. For comparison, over the past 40 years, such interest spending would approach 4 percent of GDP by spending has never fallen below 8.3 percent of GDP. 2035 and then grow slowly, reaching 5 percent in 2080. Under the alternative fiscal scenario, interest spending Other Noninterest Spending Under the Alternative Fiscal would grow much faster—from 4 percent of GDP in Scenario. In the alternative fiscal scenario, spending for 2020 to almost 9 percent by 2035 and much more in most programs other than the major mandatory health later years—because of widening deficits and ballooning care programs and Social Security is assumed to match debt. As discussed later in this chapter, higher federal CBO’s baseline projections for the next few years debt would in fact lead to higher interest rates, making (12.5 percent of GDP in 2010, 12.4 percent in 2011, interest outlays even larger, particularly under the alterna- and 10.9 percent in 2012). For subsequent years, CBO’s tive fiscal scenario. starting point was to assume that such spending would remain at this year’s levels relative to GDP rather than declining to the 2020 levels relative to GDP projected in The Long-Term Outlook for Revenues the baseline. However, in extrapolating this year’s levels, Federal revenues have fluctuated between 15 percent and CBO removed the budgetary effect of unusual, short- 21 percent of GDP over the past 40 years, averaging term policies related to current economic conditions. about 18 percent. Just as spending priorities have With those policies (and offsetting receipts related to changed during that period, the composition of revenues Medicare) excluded, primary spending on programs other has shifted. Receipts from payroll taxes have grown faster than the major mandatory health care programs and than GDP, producing a larger share of total revenue.13 At Social Security will equal 10.5 percent of GDP in 2010, the same time, the shares of revenue contributed by cor- CBO estimates. Under the alternative fiscal scenario, that porate income taxes and excise taxes have shrunk. percentage would continue from 2013 through the end of the long-term projection period. After totaling nearly 18 percent of GDP in 2008, federal revenues fell sharply the following year, to about 15 per- Net of offsetting receipts from Medicare and outlays on cent of GDP, because of the recession and the tax cuts refundable tax credits, other noninterest spending is pro- enacted in response to it. CBO expects revenues to jected to equal 10.2 percent of GDP in 2013. Thereafter, remain near 15 percent of GDP this year. However, because of increases in offsetting receipts and decreases in under the current-law assumptions of CBO’s baseline, tax credit refunds, the net amount is projected to decline revenues would rebound over the next decade with to 9.3 percent of GDP by 2035. improvement in the economy, the scheduled expiration of tax cuts enacted in 2001 and 2003, and sharp growth Interest Spending. For much of the past decade, federal in the number of taxpayers subject to the alternative min- debt was relatively constant as a share of GDP, but federal imum tax. As a result, revenues would equal 19 percent of interest spending declined (from 2.3 percent of GDP in GDP in 2012 and close to 21 percent in 2020. 2000 to 1.3 percent in 2009) because interest rates fell. In 13. The bulk of payroll tax revenue comes from taxes designated for 12. In Congressional Budget Office, The Long-Term Budget Outlook Social Security and Medicare; smaller amounts come from unem- (June 2009), those offsetting receipts were netted against Medi- ployment insurance taxes and contributions to federal retirement care spending rather than against other spending. programs. CBO