SlideShare uma empresa Scribd logo
1 de 12
SOURCE INTERLINK COMPANIES, INC.
Business Unit:
In Millions
                                                             Company Profile

Company Toys R Us                  28-Jan          2008 FYE              last year
                                   29-Jan          2009 FYE              next year

                                                                           2009
                                            Quarter 1 Quarter 2 Quarter 3 Quarter 4              Year

Revenue                                         2,719
Cost Of Revenue                                 1,742
Gross Profit                                     977            -            -         -          -
Operating Expenses                               975
Operating Income                                  2             -            -         -          -
Interest Income (expense)                       (100)
Other Income (expense )                           7
Income From Operations                           (91)           -            -         -          -

Gross Margin %                                  35.9%         #DIV/0!     #DIV/0!    #DIV/0!    #DIV/0!
Operating Income %                               0.1%         #DIV/0!     #DIV/0!    #DIV/0!    #DIV/0!
Income From Operations %                        -3.3%         #DIV/0!     #DIV/0!    #DIV/0!    #DIV/0!


Current Ratio:
          Current Assets                           3121
          Current Liabilities
                     RATIO                       #DIV/0!       #DIV/0!     #DIV/0!    #DIV/0!    #DIV/0!

Quick Ratio:
          Cash                                      408
          Marketable Securities
          Receivables                               198
          Current Liablities
                     RATIO                       #DIV/0!       #DIV/0!     #DIV/0!    #DIV/0!    #DIV/0!

Total Debt:

           Short Term                                   48


           Long term                               5898


Free Cash Flow

           Operarting Activities                   (514)
           Less:      Capex                         (65)
                      Prefered Stock Div    ?
                      Acq of Business       ?

           Free Cash Flow                          (579)            -            -         -            -
Debt Coverage Ratio:
         Operarting Activities              (514)         -         -         -           -
         Average Total Liabilities          8641
                    RATIO                  (0.06)    #DIV/0!   #DIV/0!   #DIV/0!   #DIV/0!


                                                               2009
                                       Quarter 1 Quarter 2 Quarter 3 Quarter 4     Year


Adjusted Operating Income:
          Operating Income:               2           -         -         -         -
          Add:
          Asset Impairment


Adjusted Operating Income:                      2


Payment Terms:
        Average Industry Days
                  late beyond term

          Average Source Days
                    late beyond term

Cash Usage:
         Cash Increase ( Decrease)            -343
         Loan Increase ( Decrease)

Revolver Balance
Highest Revolver Balance
Borrowing Base


Rating:   S&P
          D&B
          Source


                                       Alliance
Description Of Business wirth Source:


Products/Service Sold :


                                        total       0.0%

Average Sales:                          FYE07   FYE08      FYE 09


Years with Source:


Key Contacts:
( Include Email & title & Phone)


Terms:
Alliance

Issue Log:                     1)

                               2)

                               3)


Security On file:
Letter of Credit
Purchase Money Security
UCC
Personal Guarantee


Average Outstanding Balance:
not fi
                      2008                                                  2007
Quarter 1 Quarter 2 Quarter 3 Quarter 4     Year     Quarter 1 Quarter 2 Quarter 3     Quarter 4

                                                      2,581      2,605      2,781       5,827
                                                      1,671      1,669      1,804       3,843
             -          -          -         -         910        936        977        1,984
                                                       887        908       1,003       1,313
   -         -          -          -         -          23         28        (26)        671
                                                      (114)      (116)      (133)       (113)
                                   -                    50         46         83        (246)
   -         -          -          -         -         (41)       (42)       (76)        312

#DIV/0!    #DIV/0!    #DIV/0!    #DIV/0!   #DIV/0!    35.3%      35.9%      35.1%       34.0%
#DIV/0!    #DIV/0!    #DIV/0!    #DIV/0!   #DIV/0!     0.9%       1.1%      -0.9%       11.5%
#DIV/0!    #DIV/0!    #DIV/0!    #DIV/0!   #DIV/0!    -1.6%      -1.6%      -2.7%        5.4%


                                                      2,897      2,778      4,107       3,393
                                                      2,420      2,307      3,312       2,708
 #DIV/0!    #DIV/0!    #DIV/0!    #DIV/0! #DIV/0!          1.2        1.2       1.24        1.25


                                                       379        230        240         751
   -                                                    -          -          -           -
                                                       246        173        179         256
                                                      2,420      2,307      3,312       2,708
 #DIV/0!    #DIV/0!    #DIV/0!    #DIV/0! #DIV/0!         0.26       0.17       0.13        0.37


                                                       268        329        291        1,584


                                                      6,407      6,593      7,023       6,612


                                                       (423)     (202)      (311)       1,463
                                                        (31)      (69)      (118)       (108)
                                                         (1)       -         -            -
                                                         -         -         -            -

       -         -          -          -         -       (455)      (271)      (429)       1,355
-         -           -        -         -        (423)      (202)        (311)       1,463
                                                     8,954      8,934       10,369       9,341
 #DIV/0!    #DIV/0!     #DIV/0!   #DIV/0! #DIV/0!      (0.05)     (0.02)       (0.03)        0.16


                       2008                                                 2007
Quarter 1 Quarter 2 Quarter 3 Quarter 4   Year      Quarter 1 Quarter 2 Quarter 3       Quarter 4


   -         -           -        -         -             23        28          (26)          671


       -         -           -        -         -         23        28          (26)          671


                                                        (386)     (149)          10           511


                      SIM                                                  Magazine
SIM   Magazine
not finished
  Year

  13,794
  8,987
  4,807
  4,111
    696
   (476)
    (67)
    153

  34.8%
  5.0%
  1.1%


  3,393
  2,708
       1.25


   751
    -
   256
  2,708
      0.37


  1,584


  6,612


   527
  (326)
    (1)
    -

      200
527
9,341
    0.06


Year


    696


    696


       (14)
Toys R Us financial report analysis

Mais conteúdo relacionado

Mais procurados

newmont mining oct_30_Q32008EarningsReleasePresentationFinal
newmont mining oct_30_Q32008EarningsReleasePresentationFinalnewmont mining oct_30_Q32008EarningsReleasePresentationFinal
newmont mining oct_30_Q32008EarningsReleasePresentationFinalfinance37
 
09.09 09.10.2009 - Presentation of Pré-sal E&P Executive Manager, José Mira...
09.09   09.10.2009 - Presentation of Pré-sal E&P Executive Manager, José Mira...09.09   09.10.2009 - Presentation of Pré-sal E&P Executive Manager, José Mira...
09.09 09.10.2009 - Presentation of Pré-sal E&P Executive Manager, José Mira...Petrobras
 
Webcast q306 ing
Webcast q306 ingWebcast q306 ing
Webcast q306 ingPetrobras
 
Frontline Q3 2012 results presentation
Frontline Q3 2012 results presentationFrontline Q3 2012 results presentation
Frontline Q3 2012 results presentationTradeWindsnews
 
ColorLine årsrapport engelsk 2009
ColorLine årsrapport engelsk 2009ColorLine årsrapport engelsk 2009
ColorLine årsrapport engelsk 2009Color Line
 
Color Group AS Annual report 2010
Color Group AS Annual report 2010Color Group AS Annual report 2010
Color Group AS Annual report 2010Color Line
 
Webcast4 t06ingles
Webcast4 t06inglesWebcast4 t06ingles
Webcast4 t06inglesPetrobras
 
May 2010 Agnico Eagle Corporate Presentation
May 2010 Agnico Eagle Corporate PresentationMay 2010 Agnico Eagle Corporate Presentation
May 2010 Agnico Eagle Corporate PresentationAgnico Eagle Mines
 
occidental petroleum 2005 Annual Report
occidental petroleum 2005 Annual Reportoccidental petroleum 2005 Annual Report
occidental petroleum 2005 Annual Reportfinance13
 
csx 02 annual
csx 02 annualcsx 02 annual
csx 02 annualfinance27
 
jacobs2003ARFinal1
jacobs2003ARFinal1jacobs2003ARFinal1
jacobs2003ARFinal1finance28
 
arrow electronics annual reports 2006
arrow electronics annual reports 2006arrow electronics annual reports 2006
arrow electronics annual reports 2006finance16
 
Webcast: Results Announcement - 2nd Quarter 2007 (Brazilian Corporate Law)
Webcast: Results Announcement - 2nd Quarter 2007 (Brazilian Corporate Law)Webcast: Results Announcement - 2nd Quarter 2007 (Brazilian Corporate Law)
Webcast: Results Announcement - 2nd Quarter 2007 (Brazilian Corporate Law)Petrobras
 

Mais procurados (16)

newmont mining oct_30_Q32008EarningsReleasePresentationFinal
newmont mining oct_30_Q32008EarningsReleasePresentationFinalnewmont mining oct_30_Q32008EarningsReleasePresentationFinal
newmont mining oct_30_Q32008EarningsReleasePresentationFinal
 
09.09 09.10.2009 - Presentation of Pré-sal E&P Executive Manager, José Mira...
09.09   09.10.2009 - Presentation of Pré-sal E&P Executive Manager, José Mira...09.09   09.10.2009 - Presentation of Pré-sal E&P Executive Manager, José Mira...
09.09 09.10.2009 - Presentation of Pré-sal E&P Executive Manager, José Mira...
 
Webcast q306 ing
Webcast q306 ingWebcast q306 ing
Webcast q306 ing
 
Frontline Q3 2012 results presentation
Frontline Q3 2012 results presentationFrontline Q3 2012 results presentation
Frontline Q3 2012 results presentation
 
ColorLine årsrapport engelsk 2009
ColorLine årsrapport engelsk 2009ColorLine årsrapport engelsk 2009
ColorLine årsrapport engelsk 2009
 
Color Group AS Annual report 2010
Color Group AS Annual report 2010Color Group AS Annual report 2010
Color Group AS Annual report 2010
 
Sample Budget
Sample BudgetSample Budget
Sample Budget
 
Oi
OiOi
Oi
 
Webcast4 t06ingles
Webcast4 t06inglesWebcast4 t06ingles
Webcast4 t06ingles
 
May 2010 Agnico Eagle Corporate Presentation
May 2010 Agnico Eagle Corporate PresentationMay 2010 Agnico Eagle Corporate Presentation
May 2010 Agnico Eagle Corporate Presentation
 
occidental petroleum 2005 Annual Report
occidental petroleum 2005 Annual Reportoccidental petroleum 2005 Annual Report
occidental petroleum 2005 Annual Report
 
csx 02 annual
csx 02 annualcsx 02 annual
csx 02 annual
 
jacobs2003ARFinal1
jacobs2003ARFinal1jacobs2003ARFinal1
jacobs2003ARFinal1
 
Ejercicio 9
Ejercicio 9Ejercicio 9
Ejercicio 9
 
arrow electronics annual reports 2006
arrow electronics annual reports 2006arrow electronics annual reports 2006
arrow electronics annual reports 2006
 
Webcast: Results Announcement - 2nd Quarter 2007 (Brazilian Corporate Law)
Webcast: Results Announcement - 2nd Quarter 2007 (Brazilian Corporate Law)Webcast: Results Announcement - 2nd Quarter 2007 (Brazilian Corporate Law)
Webcast: Results Announcement - 2nd Quarter 2007 (Brazilian Corporate Law)
 

Destaque

Q1 2009 Earning Report of Sekisui Chemical Co., Ltd.
Q1 2009 Earning Report of Sekisui Chemical Co., Ltd.Q1 2009 Earning Report of Sekisui Chemical Co., Ltd.
Q1 2009 Earning Report of Sekisui Chemical Co., Ltd.earningreport earningreport
 
Thomasitus life and stuff in it
Thomasitus life and stuff in itThomasitus life and stuff in it
Thomasitus life and stuff in itthomas123abc
 
Vice President Ages
Vice President AgesVice President Ages
Vice President Agesthomas123abc
 
Vice President Ages
Vice President AgesVice President Ages
Vice President Agesthomas123abc
 
Walter Campagnas Excellent Resume With Finance Position Included
Walter Campagnas Excellent Resume With Finance Position IncludedWalter Campagnas Excellent Resume With Finance Position Included
Walter Campagnas Excellent Resume With Finance Position Includedwcampagn
 
Vice President Ages
Vice President AgesVice President Ages
Vice President Agesthomas123abc
 
Circuit City Report1 (2) Earning Call Example
Circuit City Report1 (2) Earning Call ExampleCircuit City Report1 (2) Earning Call Example
Circuit City Report1 (2) Earning Call Examplewcampagn
 

Destaque (17)

Q1 2009 Earning Report of Sekisui Chemical Co., Ltd.
Q1 2009 Earning Report of Sekisui Chemical Co., Ltd.Q1 2009 Earning Report of Sekisui Chemical Co., Ltd.
Q1 2009 Earning Report of Sekisui Chemical Co., Ltd.
 
Thomasitus life and stuff in it
Thomasitus life and stuff in itThomasitus life and stuff in it
Thomasitus life and stuff in it
 
Stem and leaf
Stem and leafStem and leaf
Stem and leaf
 
nino gognadze
nino gognadzenino gognadze
nino gognadze
 
Vice President Ages
Vice President AgesVice President Ages
Vice President Ages
 
Angles in LIfe
Angles in LIfe Angles in LIfe
Angles in LIfe
 
Stem and leaf
Stem and leafStem and leaf
Stem and leaf
 
Stem and lea
Stem and leaStem and lea
Stem and lea
 
Vice President Ages
Vice President AgesVice President Ages
Vice President Ages
 
Stem and lea
Stem and leaStem and lea
Stem and lea
 
Walter Campagnas Excellent Resume With Finance Position Included
Walter Campagnas Excellent Resume With Finance Position IncludedWalter Campagnas Excellent Resume With Finance Position Included
Walter Campagnas Excellent Resume With Finance Position Included
 
Stem and lea
Stem and leaStem and lea
Stem and lea
 
The Chase
The ChaseThe Chase
The Chase
 
Vice President Ages
Vice President AgesVice President Ages
Vice President Ages
 
Circuit City Report1 (2) Earning Call Example
Circuit City Report1 (2) Earning Call ExampleCircuit City Report1 (2) Earning Call Example
Circuit City Report1 (2) Earning Call Example
 
Angles in life
Angles in life Angles in life
Angles in life
 
Conflict Resolution Samples 1
Conflict Resolution Samples 1Conflict Resolution Samples 1
Conflict Resolution Samples 1
 

Semelhante a Toys R Us financial report analysis

advanced micro devices Q408Financials
advanced micro devices Q408Financialsadvanced micro devices Q408Financials
advanced micro devices Q408Financialsfinance34
 
AMD Q408Financials
AMD Q408FinancialsAMD Q408Financials
AMD Q408Financialsfinance34
 
AMD-Q408Financials
AMD-Q408FinancialsAMD-Q408Financials
AMD-Q408Financialsfinance34
 
AMD Q408Financials
AMD Q408FinancialsAMD Q408Financials
AMD Q408Financialsfinance34
 
advanced micro devices Q408Financials
advanced micro devices Q408Financialsadvanced micro devices Q408Financials
advanced micro devices Q408Financialsfinance34
 
advanced micro devices Q308Financials
advanced micro devices Q308Financialsadvanced micro devices Q308Financials
advanced micro devices Q308Financialsfinance34
 
monsanto 11-08-07-8
monsanto 11-08-07-8monsanto 11-08-07-8
monsanto 11-08-07-8finance28
 
Maxim 2Q FISCAL 2009 RESULTS
Maxim 2Q FISCAL 2009 RESULTSMaxim 2Q FISCAL 2009 RESULTS
Maxim 2Q FISCAL 2009 RESULTSearningsreport
 
advanced micro devices Q407Financials
advanced micro devices Q407Financialsadvanced micro devices Q407Financials
advanced micro devices Q407Financialsfinance34
 
SHAWGROUPAR03
SHAWGROUPAR03SHAWGROUPAR03
SHAWGROUPAR03finance36
 
Management Discussion and Analysis Year Ended
Management Discussion and Analysis Year EndedManagement Discussion and Analysis Year Ended
Management Discussion and Analysis Year EndedSpider Resources, Inc.
 
BBB2005Annual
BBB2005AnnualBBB2005Annual
BBB2005Annualfinance44
 
BBB2005Annual
BBB2005AnnualBBB2005Annual
BBB2005Annualfinance44
 
advanced micro devices ResultsQ406
advanced micro devices ResultsQ406advanced micro devices ResultsQ406
advanced micro devices ResultsQ406finance34
 
fannie mae Investor Summary
fannie mae Investor Summary fannie mae Investor Summary
fannie mae Investor Summary finance6
 
Cr2 presentation deutsche bank - 01-jun-11
Cr2 presentation   deutsche bank - 01-jun-11Cr2 presentation   deutsche bank - 01-jun-11
Cr2 presentation deutsche bank - 01-jun-11SiteriCR2
 

Semelhante a Toys R Us financial report analysis (20)

advanced micro devices Q408Financials
advanced micro devices Q408Financialsadvanced micro devices Q408Financials
advanced micro devices Q408Financials
 
AMD Q408Financials
AMD Q408FinancialsAMD Q408Financials
AMD Q408Financials
 
AMD-Q408Financials
AMD-Q408FinancialsAMD-Q408Financials
AMD-Q408Financials
 
AMD Q408Financials
AMD Q408FinancialsAMD Q408Financials
AMD Q408Financials
 
advanced micro devices Q408Financials
advanced micro devices Q408Financialsadvanced micro devices Q408Financials
advanced micro devices Q408Financials
 
credit-suisse Restatement re
credit-suisse Restatement recredit-suisse Restatement re
credit-suisse Restatement re
 
advanced micro devices Q308Financials
advanced micro devices Q308Financialsadvanced micro devices Q308Financials
advanced micro devices Q308Financials
 
monsanto 11-08-07-8
monsanto 11-08-07-8monsanto 11-08-07-8
monsanto 11-08-07-8
 
Financial Statements
Financial StatementsFinancial Statements
Financial Statements
 
Maxim 2Q FISCAL 2009 RESULTS
Maxim 2Q FISCAL 2009 RESULTSMaxim 2Q FISCAL 2009 RESULTS
Maxim 2Q FISCAL 2009 RESULTS
 
advanced micro devices Q407Financials
advanced micro devices Q407Financialsadvanced micro devices Q407Financials
advanced micro devices Q407Financials
 
Amd Q407 Financials
Amd Q407 FinancialsAmd Q407 Financials
Amd Q407 Financials
 
SHAWGROUPAR03
SHAWGROUPAR03SHAWGROUPAR03
SHAWGROUPAR03
 
Management Discussion and Analysis Year Ended
Management Discussion and Analysis Year EndedManagement Discussion and Analysis Year Ended
Management Discussion and Analysis Year Ended
 
BBB2005Annual
BBB2005AnnualBBB2005Annual
BBB2005Annual
 
BBB2005Annual
BBB2005AnnualBBB2005Annual
BBB2005Annual
 
Amd Results Q406
Amd Results Q406Amd Results Q406
Amd Results Q406
 
advanced micro devices ResultsQ406
advanced micro devices ResultsQ406advanced micro devices ResultsQ406
advanced micro devices ResultsQ406
 
fannie mae Investor Summary
fannie mae Investor Summary fannie mae Investor Summary
fannie mae Investor Summary
 
Cr2 presentation deutsche bank - 01-jun-11
Cr2 presentation   deutsche bank - 01-jun-11Cr2 presentation   deutsche bank - 01-jun-11
Cr2 presentation deutsche bank - 01-jun-11
 

Toys R Us financial report analysis

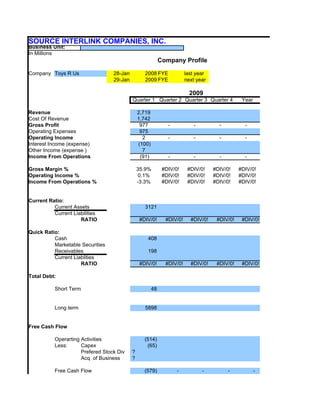
  • 1. SOURCE INTERLINK COMPANIES, INC. Business Unit: In Millions Company Profile Company Toys R Us 28-Jan 2008 FYE last year 29-Jan 2009 FYE next year 2009 Quarter 1 Quarter 2 Quarter 3 Quarter 4 Year Revenue 2,719 Cost Of Revenue 1,742 Gross Profit 977 - - - - Operating Expenses 975 Operating Income 2 - - - - Interest Income (expense) (100) Other Income (expense ) 7 Income From Operations (91) - - - - Gross Margin % 35.9% #DIV/0! #DIV/0! #DIV/0! #DIV/0! Operating Income % 0.1% #DIV/0! #DIV/0! #DIV/0! #DIV/0! Income From Operations % -3.3% #DIV/0! #DIV/0! #DIV/0! #DIV/0! Current Ratio: Current Assets 3121 Current Liabilities RATIO #DIV/0! #DIV/0! #DIV/0! #DIV/0! #DIV/0! Quick Ratio: Cash 408 Marketable Securities Receivables 198 Current Liablities RATIO #DIV/0! #DIV/0! #DIV/0! #DIV/0! #DIV/0! Total Debt: Short Term 48 Long term 5898 Free Cash Flow Operarting Activities (514) Less: Capex (65) Prefered Stock Div ? Acq of Business ? Free Cash Flow (579) - - - -
  • 2. Debt Coverage Ratio: Operarting Activities (514) - - - - Average Total Liabilities 8641 RATIO (0.06) #DIV/0! #DIV/0! #DIV/0! #DIV/0! 2009 Quarter 1 Quarter 2 Quarter 3 Quarter 4 Year Adjusted Operating Income: Operating Income: 2 - - - - Add: Asset Impairment Adjusted Operating Income: 2 Payment Terms: Average Industry Days late beyond term Average Source Days late beyond term Cash Usage: Cash Increase ( Decrease) -343 Loan Increase ( Decrease) Revolver Balance Highest Revolver Balance Borrowing Base Rating: S&P D&B Source Alliance
  • 3. Description Of Business wirth Source: Products/Service Sold : total 0.0% Average Sales: FYE07 FYE08 FYE 09 Years with Source: Key Contacts: ( Include Email & title & Phone) Terms:
  • 4. Alliance Issue Log: 1) 2) 3) Security On file: Letter of Credit Purchase Money Security UCC Personal Guarantee Average Outstanding Balance:
  • 5. not fi 2008 2007 Quarter 1 Quarter 2 Quarter 3 Quarter 4 Year Quarter 1 Quarter 2 Quarter 3 Quarter 4 2,581 2,605 2,781 5,827 1,671 1,669 1,804 3,843 - - - - 910 936 977 1,984 887 908 1,003 1,313 - - - - - 23 28 (26) 671 (114) (116) (133) (113) - 50 46 83 (246) - - - - - (41) (42) (76) 312 #DIV/0! #DIV/0! #DIV/0! #DIV/0! #DIV/0! 35.3% 35.9% 35.1% 34.0% #DIV/0! #DIV/0! #DIV/0! #DIV/0! #DIV/0! 0.9% 1.1% -0.9% 11.5% #DIV/0! #DIV/0! #DIV/0! #DIV/0! #DIV/0! -1.6% -1.6% -2.7% 5.4% 2,897 2,778 4,107 3,393 2,420 2,307 3,312 2,708 #DIV/0! #DIV/0! #DIV/0! #DIV/0! #DIV/0! 1.2 1.2 1.24 1.25 379 230 240 751 - - - - - 246 173 179 256 2,420 2,307 3,312 2,708 #DIV/0! #DIV/0! #DIV/0! #DIV/0! #DIV/0! 0.26 0.17 0.13 0.37 268 329 291 1,584 6,407 6,593 7,023 6,612 (423) (202) (311) 1,463 (31) (69) (118) (108) (1) - - - - - - - - - - - - (455) (271) (429) 1,355
  • 6. - - - - - (423) (202) (311) 1,463 8,954 8,934 10,369 9,341 #DIV/0! #DIV/0! #DIV/0! #DIV/0! #DIV/0! (0.05) (0.02) (0.03) 0.16 2008 2007 Quarter 1 Quarter 2 Quarter 3 Quarter 4 Year Quarter 1 Quarter 2 Quarter 3 Quarter 4 - - - - - 23 28 (26) 671 - - - - - 23 28 (26) 671 (386) (149) 10 511 SIM Magazine
  • 7.
  • 8. SIM Magazine
  • 9. not finished Year 13,794 8,987 4,807 4,111 696 (476) (67) 153 34.8% 5.0% 1.1% 3,393 2,708 1.25 751 - 256 2,708 0.37 1,584 6,612 527 (326) (1) - 200
  • 10. 527 9,341 0.06 Year 696 696 (14)