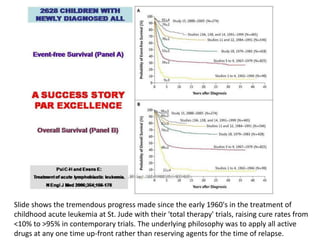
SlideShare uma empresa Scribd logo
1 de 41
Slide shows the tremendous progress made since the early 1960's in the treatment of childhood acute leukemia at St. Jude with their 'total therapy' trials, raising cure rates from <10% to >95% in contemporary trials. The underlying philosophy was to apply all active drugs at any one time up-front rather than reserving agents for the time of relapse.
The first ever myeloma tandem transplant trial – Total Therapy 1 – enrolled 231 patients. Shown are the long-term outcome results. At 10 years, 33% are alive and 15% have never relapsed (left panel). Duration of complete remission is depicted on the right, revealing 15 patients who are in continuous complete remission of the 94 who entered such state originally. These patients can be considered cured as all are beyond 10 years.
This slide shows the treatment diagrams for Total Therapy 1 (TT1, top) and Total Therapy 2 (TT2, bottom). The difference in TT2 v TT1 included: a) more intensive induction therapy; b) the introduction of consolidation chemotherapy after tandem transplants with Melphalan; and, c) the addition of Dexamethasone pulsing during the first year of maintenance. All patients were randomized to receive or not to receive Thalidomide, which we discovered here to have profound anti-myeloma activity in endstage disease.
Outcomes are shown here according to Thalidomide v no Thalidomide for CR (left upper panel), event-free survival (right upper panel), overall survival (left lower panel) and survival after relapse (right lower panel). Note the superior outcomes in terms of CR and event-free survival for patients randomized to Thalidomide, with a divergence in survival curves beginning at 5 years, now actually with further separation, suggesting that statistical significance will eventually be reached. The survival of all patients as of December 1, 2007, has not reached the median at 8 years.
Here we are comparing TT2 without thalidomide v TT1 data. Timing of onset of CR and final CR rate were similar; CR duration was superior with TT2 v TT1 as were event-free and overall survival.
In this series of MRI examinations, we are pointing to the emergence with therapy of focal white lesions due to unmasking as a result of therapy, showing that the bone marrow background in the spine is getting darker so that these focal lesions can be appreciated. Eventually by June 2001, the MRI looks normal – "hypo-intense and homogeneous" – dark. By December 2002, focal lesions re-appear.
The left panel of this slide shows the timing of onset of disappearance of MRI-defined focal lesions which, especially in case of many (>7; blue) lag behind the onset of clinical complete remission (CCR; green). The right panel denotes that patients achieving MRI-defined CR status (blue) fare better than those not achieving MRI-CR status (red).
The combined information on both MRI-defined focal lesion number (MRI-FL) and whether or not cytogenetic abnormalities (CA) are present provides separation of survival outcomes. Thus, for those without CA, fewer than 8 FL (=<7) imparts superior survival (blue) than the presence of more than 7 FL (red). Conversely, among patients presenting with CA, higher FL implies poorer outcome than lower FL (gold v green).
The top left panel portrays survival outcomes in Total Therapy 2 according to molecular subgroups; the worst outcomes were observed in patients with MS (FGFR3/MMSET; magenta), PR (proliferation; purple) and MF (MAFMAF-B; gold) subgroups, whereas the other five subgroups fared well including CD1 (CCND1-1; blue), CD2 (CCND1-2; red), LB (low bone disease; pink), HV (hyperdiploidy; green) and MY (myeloid subgroup; grey). The top right panel shows survival according to whether the gene array showed a MGUS-like (blue) or non-MGUS-like signature (red). The bottom left panel shows that the ~15% of patients with high-risk myeloma have a much shorter survival with a median of less than 2 years as opposed to the remainder with a 6-yr survival estimate of 65%. The right lower panel addresses the combined effects of high-risk gene signature and the FGFR3 translocation: both in the absence and in the presence of FGFR3 or t(4;14), high-risk imparts poor outcome (blue v green and gold v red).
This table examines, among the patients with complete information on all baseline prognostic factors, the roles of standard prognostic factors (SPF, left column), with the progressive inclusion of information on cytogenetic abnormalities (CA, next column to the right), MRI, FISH, and finally, gene expression profiling (GEP) data (right-most column). Indicated are the hazard ratios (HR) along with P-values. Note that for the right-most column with GEP information, the HR value is greatest (3.01). Also, as a measure of the clinical outcome heterogeneity accounted for, the R2-value (bottom row) was highest at 38% for the prognostic model that included GEP data.
This slide is very complex with loaded information. In the left half of the slide, we are portraying overall survival HR and P-values in the context of standard prognostic factors (SPF) and the additional impact of CR. Note that adverse variables in the context of Total Therapy 2 (TT2) included elevations of creatinine and LDH as well as CA, whereas achieving CR status was a positive feature (HR=0.56). On the right part of the slide, data are portrayed in the context of GEP data: note the overwhelming importance of GEP-defined high-risk (HR=5.74) and the favorable impact of CR which however was restricted to the high-risk subset (HR=0.35). These data imply that, in the context of GEP information, CR is critically important for the group of patients with the so-defined high risk, whereas CR was not an independent favorable outcome feature in the GEP-defined good risk group. Also note the independent favorable implications of applying a second transplant (HR=0.58).
Some of the data described in slide 11 are depicted graphically in this slide: note the huge difference imparted by achieving CR status within 18 months from treatment start among high-risk patients (right panel), whereas no such impact was observed among the good-risk subgroup (left panel).
Here we are showing that a second transplant benefit is particularly evident among patients already in CR after the first transplant (left panel), whereas no such benefit was apparent in patients not in CR after first transplant.
Another important aspect of our work in TT1 and TT2 is portrayed here: we examined whether it was relevant or not for subsequent survival whether patients had been in uninterrupted remission for 4 years from starting therapy. Counting from a 5-year post-treatment landmark, you will notice that those patients not suffering a relapse within 4 years (continuous remission) fared significantly better than their counterparts who had experienced a recurrence during that time interval. Thus, at 7 years from the +5-year landmark, that is at 13 years from treatment start, 66% v 30% of patients are alive in uninterrupted v interrupted remission in the first 4 years.
In Total Therapy 3 (TT3), we added Velcade ("V) to DT-PACE as V-DTPACE for induction and consolidation therapies prior to and after Melphalan 200mg/m2-based tandem transplants (left upper panel); during the first year of maintenance, patients are receiving VTD (Velcade, Thalidomide, Dexamethasone) and thereafter only THAL  plus DEX. Patient characteristics are depicted in the left bottom panel, with a median age of almost 60 years and cytogenetic abnormalities present in 33%. The treatment objectives are summarized in the panel on the right. Importantly, compared to TT2, both induction and consolidation phases were reduced from 4 cycles to 2 cycles. Velcade was added as it targets both myeloma cells and the bone marrow microenvironment.
As intended, the progression of patients through the successive treatment phases was faster in TT3 than in TT2. Thus, by 6 months, almost all patients had completed the second transplant, and consolidation therapy was finished within 12 to 13 months.
This slide shows the rapid onset of remission in terms of PR, near-CR (N-CR) and stringently defined CR; over 80% achieved N-CR status.
Here, the response kinetics are portrayed in relationship to TT2, showing again significantly faster onset to the various response levels with TT3 v TT2.
Clinical outcome data are summarized in this slide for the 303 patients who entered TT3 in relationship to the 2 arms of TT2. Note the superior CR duration and event-free survival rates with TT3 compared to both arms of TT2 with a strong trend apparent for overall survival.  Despite similar CR rates for TT3 and the Thalidomide arm of TT2, CR duration was superior with TT3.
As shown in this slide, the relapse rates after TT3 were significantly suppressed in comparison with comparable phases of TT2.
Looking at the TT3 outcome data in the context of gene expression profiling (GEP), the 85% with low-risk MM have 2-yr survival, event-free and continuous CR of 91%, 90% and 94%, respectively, as opposed to 70%, 58% and 60% among the 15% with high-risk MM.
Importantly, FGFR3 status does not affect TT3 survival once GEP risk status is accounted for.
According to translational research studies performed as part of TT3, a 48hr GEP sample obtained after a test dose of Velcade showed that the patients showing suppression of a micro-environment-associated gene (MAG-1) fared significantly better than those without change and especially those with an increased expression of MAG-1 48hr after Velcade – attesting to the important contribution of bone marrow micro-environment alteration by Velcade to the clinical course.
This slide summarizes for TT3 and TT2 CR duration (top panels), event-free survival (middle panels) and overall survival (bottom panels) according to gene expression profiling (GEP) –defined risk (low-risk, left panels; high-risk, right panels). The benefit of TT3 was limited to the 85% with low-risk.
Although considered a high-risk feature with TT2, the FGFR3 subgroup fared significantly better with TT3 for all 3 clinical endpoints examined.
This slide summarizes the progress made as we transitioned from TT1 to TT2 to TT3 protocols. The remarkable improvement in CR duration with TT3 is striking (top right). As a result of abbreviated induction and consolidation in TT3 v TT2, completion of first and second transplants has markedly improved in TT3 (left panel).
We next examined the role of completion of protocol steps in a timely fashion in TT2: survival was superior among the patients completing all protocol steps within 3 years, which was particularly true for high-risk patients presenting with cytogenetic abnormalities (CA, right panel).
Similar observations pertained to TT3, employing a landmark of completion of steps of 1.5 years.
In order to appreciate the role of Velcade in the improvement of TT3 v TT2, we examined outcomes of patients in both studies who finished consolidation within 2 years from starting protocol therapy, in order to account for the faster application of treatment steps in TT3. Note the marked improvement in event-free survival (right panel).
This table stresses that completion of treatment steps is an independent positive feature that is associated with superior event-free survival in TT2 and TT3, adjusting for GEP-defined high-risk disease.
Appreciating that the mere observation of achieving CR status may be insufficient, since CR rates are actually higher in high-risk myeloma, we explored the optimal time interval of remaining in CR after initiation of therapy. As is shown for TT2 (upper left), sustained CR status for 3yr was associated with superior survival, followed by the group of patients who had not achieved CR status in 3yr while the worst outcome was observed in subjects who attained and lost CR status within that time frame.  Similar results pertained to patients enrolled in TT1 (bottom left) and those treated on other protocols for previously treated myeloma (bottom right).
The table reveals that sustained CR (SUS-CR) indeed was an independent favorable feature associated with superior survival in these three patient groups.
This slide portrays, for all total therapy protocols, the post-transplant survival according to the presence of cytogenetic abnormalities (CA) present at baseline or prior to 1st transplant. Superior outcomes were observed in the absence of CA at both time points, followed by the group of patients that exhibited CA only at baseline but not at relapse, whereas survival was equally poor among those who had persistent CA pre-transplant regardless of baseline status.
Similar observations pertained to the subset of patients treated with TT2.
Here we examine post-relapse survival according to the presence of CA at baseline and at relapse. Best survival outcomes were noted among patients without CA at both time points, followed by those with baseline abnormalities only while the post-relapse survival was similar among patients with CA at relapse whether or not CA were present at baseline.
Here we are examining the hazard rates over time of death among high- versus low-risk myeloma patients in TT2. Four to five years are required for the hazard rate in high-risk myeloma to drop to the level observed in low-risk disease.
The same scenario is examined here for TT3: note the faster drop with TT3 in hazard rate among GEP-defined high-risk patients to levels seen in low-risk myeloma within 3 years.
This slide summarizes the collective experience at Arkansas with Total Therapy protocols, TT1, TT2 and TT3, collectively referred to as TT-p, versus non-Total Therapy protocols (non-TT-p) for previously treated patients versus patients receiving off-protocol tandem transplants (non-p). Overall and event-free survival data are summarized in the top panels. The bottom panels reveal, for all patients regardless of protocol status, their outcomes according to the presence of 5, 4, 3, 2, 1 or 0 favorable prognostic factors for overall survival (left bottom) and event-free survival (right bottom) – note the huge differences in outcomes related to this grouping.
Outcome evaluation according to age is portrayed in the left lower panel: survival was similar for the age groups from <35yr to 64yr and then worsened especially in patients older than 75yr. Deaths from any cause are counted as events. In the case of renal function (right bottom), favorable outcomes were noted up to creatinine levels of 2.0mg/dl, while there was no difference between the <3.7 and >3.6mg/dl groups. The top left panel reveals superior post-salvage third transplant survival in patients for whom at least 3 years had elapsed since second transplant.
A potential consequence of chemotherapy as well as autotransplant-supported high-dose therapy is the development of myelodysplasia (MDS), which is best recognized by typical cytogentic abnormalities. As part of every bone marrow examination for myeloma, we are also performing cytogenetic studies which can reveal MDS-associated CA (MDS-CA). Portrayed in this slide is the cumulative frequency of MDS-CA in relationship to the number of potential risk factors present, which include lower number of stem cells (CD34 < 3x 10⁶/kg), age (>=70yr) and when the first transplant occurred late in the course of a patient's management (>30 months from initial therapy).
Summarized here are the principles pursued in the Arkansas program.

Mais conteúdo relacionado

Mais procurados

Maslak p.g.-et-al.-asco-2016-phase-2-acute-myeloid-leukemia-oral-presentation
Maslak p.g.-et-al.-asco-2016-phase-2-acute-myeloid-leukemia-oral-presentationMaslak p.g.-et-al.-asco-2016-phase-2-acute-myeloid-leukemia-oral-presentation
Maslak p.g.-et-al.-asco-2016-phase-2-acute-myeloid-leukemia-oral-presentation
SellasCorp
 
May r.j.-et-al.-2007-clinical-cancer-research
May r.j.-et-al.-2007-clinical-cancer-researchMay r.j.-et-al.-2007-clinical-cancer-research
May r.j.-et-al.-2007-clinical-cancer-research
SellasCorp
 
Egfr in colorectal
Egfr in colorectalEgfr in colorectal
Egfr in colorectal
Ahmed Allam
 
Pinilla ibarz-j.-et-al.-2006-leukemia
Pinilla ibarz-j.-et-al.-2006-leukemiaPinilla ibarz-j.-et-al.-2006-leukemia
Pinilla ibarz-j.-et-al.-2006-leukemia
SellasCorp
 
Brayer j.-l.-et-al.-2015-acute-myeloid-leukemia-and-myelodysplastic-syndrome
Brayer j.-l.-et-al.-2015-acute-myeloid-leukemia-and-myelodysplastic-syndromeBrayer j.-l.-et-al.-2015-acute-myeloid-leukemia-and-myelodysplastic-syndrome
Brayer j.-l.-et-al.-2015-acute-myeloid-leukemia-and-myelodysplastic-syndrome
SellasCorp
 

Mais procurados (20)

Maslak p.g.-et-al.-asco-2016-phase-2-acute-myeloid-leukemia-oral-presentation
Maslak p.g.-et-al.-asco-2016-phase-2-acute-myeloid-leukemia-oral-presentationMaslak p.g.-et-al.-asco-2016-phase-2-acute-myeloid-leukemia-oral-presentation
Maslak p.g.-et-al.-asco-2016-phase-2-acute-myeloid-leukemia-oral-presentation
 
thalassemia
thalassemiathalassemia
thalassemia
 
Hemostatic markers and atrial fibrillation in ARIC
Hemostatic markers and atrial fibrillation in ARICHemostatic markers and atrial fibrillation in ARIC
Hemostatic markers and atrial fibrillation in ARIC
 
May r.j.-et-al.-2007-clinical-cancer-research
May r.j.-et-al.-2007-clinical-cancer-researchMay r.j.-et-al.-2007-clinical-cancer-research
May r.j.-et-al.-2007-clinical-cancer-research
 
Egfr in colorectal
Egfr in colorectalEgfr in colorectal
Egfr in colorectal
 
Pathology Insights on Innovation in AML: The Rapid Emergence of Precision Dia...
Pathology Insights on Innovation in AML: The Rapid Emergence of Precision Dia...Pathology Insights on Innovation in AML: The Rapid Emergence of Precision Dia...
Pathology Insights on Innovation in AML: The Rapid Emergence of Precision Dia...
 
Pinilla ibarz-j.-et-al.-2006-leukemia
Pinilla ibarz-j.-et-al.-2006-leukemiaPinilla ibarz-j.-et-al.-2006-leukemia
Pinilla ibarz-j.-et-al.-2006-leukemia
 
Upfront AutoSCT in High Risk NHL
Upfront AutoSCT in High Risk NHLUpfront AutoSCT in High Risk NHL
Upfront AutoSCT in High Risk NHL
 
Mechanism of resistance to target therapy
Mechanism of resistance to target therapyMechanism of resistance to target therapy
Mechanism of resistance to target therapy
 
Brayer j.-l.-et-al.-2015-acute-myeloid-leukemia-and-myelodysplastic-syndrome
Brayer j.-l.-et-al.-2015-acute-myeloid-leukemia-and-myelodysplastic-syndromeBrayer j.-l.-et-al.-2015-acute-myeloid-leukemia-and-myelodysplastic-syndrome
Brayer j.-l.-et-al.-2015-acute-myeloid-leukemia-and-myelodysplastic-syndrome
 
West egfr mutation acquired resistance
West egfr mutation acquired resistanceWest egfr mutation acquired resistance
West egfr mutation acquired resistance
 
Koehne, G., et al. Galinpepimut-S in multiple myeloma data – clinical updates...
Koehne, G., et al. Galinpepimut-S in multiple myeloma data – clinical updates...Koehne, G., et al. Galinpepimut-S in multiple myeloma data – clinical updates...
Koehne, G., et al. Galinpepimut-S in multiple myeloma data – clinical updates...
 
AML: improving standard therapy
AML: improving standard therapyAML: improving standard therapy
AML: improving standard therapy
 
EGFR -TkI resistance pathways
EGFR -TkI resistance pathways  EGFR -TkI resistance pathways
EGFR -TkI resistance pathways
 
Polymorphisms rs1800587 and rs1143634 of the Interleukin-1α Gene are associat...
Polymorphisms rs1800587 and rs1143634 of the Interleukin-1α Gene are associat...Polymorphisms rs1800587 and rs1143634 of the Interleukin-1α Gene are associat...
Polymorphisms rs1800587 and rs1143634 of the Interleukin-1α Gene are associat...
 
Lymphoma
LymphomaLymphoma
Lymphoma
 
Gallbladder cancer patient analysis
Gallbladder cancer patient analysisGallbladder cancer patient analysis
Gallbladder cancer patient analysis
 
Targeted therapy in lung cancer
Targeted therapy in lung cancerTargeted therapy in lung cancer
Targeted therapy in lung cancer
 
Mt200833a
Mt200833aMt200833a
Mt200833a
 
Retinoic Acid Receptor Alpha
Retinoic Acid Receptor AlphaRetinoic Acid Receptor Alpha
Retinoic Acid Receptor Alpha
 

Semelhante a Myeloma treatment

Myeloma Treatment Approach
Myeloma Treatment ApproachMyeloma Treatment Approach
Myeloma Treatment Approach
uamsmyeloma
 
Rare Solid Cancers: An Introduction - Slide 13 - R. Soffietti - Rare CNS canc...
Rare Solid Cancers: An Introduction - Slide 13 - R. Soffietti - Rare CNS canc...Rare Solid Cancers: An Introduction - Slide 13 - R. Soffietti - Rare CNS canc...
Rare Solid Cancers: An Introduction - Slide 13 - R. Soffietti - Rare CNS canc...
European School of Oncology
 
Disseminated lung metastases in thyroid cancer
Disseminated lung metastases in thyroid cancerDisseminated lung metastases in thyroid cancer
Disseminated lung metastases in thyroid cancer
Jacoblix
 
Early stage lung_cancer- jtl
Early stage lung_cancer- jtlEarly stage lung_cancer- jtl
Early stage lung_cancer- jtl
John Lucas
 
Philadephia chromosomal positive acute lymphoblastic leukemia
Philadephia chromosomal positive acute lymphoblastic leukemiaPhiladephia chromosomal positive acute lymphoblastic leukemia
Philadephia chromosomal positive acute lymphoblastic leukemia
spa718
 

Semelhante a Myeloma treatment (20)

Journal club article rtog 9111 dr kiran
Journal club article rtog 9111 dr kiranJournal club article rtog 9111 dr kiran
Journal club article rtog 9111 dr kiran
 
Myeloma Treatment Approach
Myeloma Treatment ApproachMyeloma Treatment Approach
Myeloma Treatment Approach
 
Low grade glioma evidence based management
Low grade glioma evidence based managementLow grade glioma evidence based management
Low grade glioma evidence based management
 
STUPP TRIAL - treatment of high grade glioma
STUPP TRIAL - treatment of high grade gliomaSTUPP TRIAL - treatment of high grade glioma
STUPP TRIAL - treatment of high grade glioma
 
Clinical Development of ADC Drugs Targeting TROP-2.pdf
Clinical Development of ADC Drugs Targeting TROP-2.pdfClinical Development of ADC Drugs Targeting TROP-2.pdf
Clinical Development of ADC Drugs Targeting TROP-2.pdf
 
Rare Solid Cancers: An Introduction - Slide 13 - R. Soffietti - Rare CNS canc...
Rare Solid Cancers: An Introduction - Slide 13 - R. Soffietti - Rare CNS canc...Rare Solid Cancers: An Introduction - Slide 13 - R. Soffietti - Rare CNS canc...
Rare Solid Cancers: An Introduction - Slide 13 - R. Soffietti - Rare CNS canc...
 
Future direction in the management of high risk LOW GRADE GLIOMA
Future direction in the management of high risk LOW GRADE GLIOMAFuture direction in the management of high risk LOW GRADE GLIOMA
Future direction in the management of high risk LOW GRADE GLIOMA
 
NACT in Head and Neck cancer
NACT in Head and Neck cancerNACT in Head and Neck cancer
NACT in Head and Neck cancer
 
Disseminated lung metastases in thyroid cancer
Disseminated lung metastases in thyroid cancerDisseminated lung metastases in thyroid cancer
Disseminated lung metastases in thyroid cancer
 
S.c.l.c dr.hatem
S.c.l.c dr.hatemS.c.l.c dr.hatem
S.c.l.c dr.hatem
 
Austin Oncology Case Reports
Austin Oncology Case ReportsAustin Oncology Case Reports
Austin Oncology Case Reports
 
MANAGEMENT OF GLIOMAS
MANAGEMENT OF GLIOMASMANAGEMENT OF GLIOMAS
MANAGEMENT OF GLIOMAS
 
Early stage lung_cancer- jtl
Early stage lung_cancer- jtlEarly stage lung_cancer- jtl
Early stage lung_cancer- jtl
 
International Journal of Neurooncology & Brain Tumors
International Journal of Neurooncology & Brain TumorsInternational Journal of Neurooncology & Brain Tumors
International Journal of Neurooncology & Brain Tumors
 
Effect of differnt chemotherapy regimens on pathological response in the preo...
Effect of differnt chemotherapy regimens on pathological response in the preo...Effect of differnt chemotherapy regimens on pathological response in the preo...
Effect of differnt chemotherapy regimens on pathological response in the preo...
 
Success and failures of combined modalities in GBM
Success and failures of combined modalities in GBMSuccess and failures of combined modalities in GBM
Success and failures of combined modalities in GBM
 
Philadephia chromosomal positive acute lymphoblastic leukemia
Philadephia chromosomal positive acute lymphoblastic leukemiaPhiladephia chromosomal positive acute lymphoblastic leukemia
Philadephia chromosomal positive acute lymphoblastic leukemia
 
408131
408131408131
408131
 
Follicular lymphoma
Follicular lymphomaFollicular lymphoma
Follicular lymphoma
 
Tnbc 2018 update
Tnbc 2018 updateTnbc 2018 update
Tnbc 2018 update
 

Último

Cardiac Impulse: Rhythmical Excitation and Conduction in the Heart
Cardiac Impulse: Rhythmical Excitation and Conduction in the HeartCardiac Impulse: Rhythmical Excitation and Conduction in the Heart
Cardiac Impulse: Rhythmical Excitation and Conduction in the Heart
MedicoseAcademics
 
Failure to thrive in neonates and infants + pediatric case.pptx
Failure to thrive in neonates and infants  + pediatric case.pptxFailure to thrive in neonates and infants  + pediatric case.pptx
Failure to thrive in neonates and infants + pediatric case.pptx
claviclebrown44
 

Último (20)

The Orbit & its contents by Dr. Rabia I. Gandapore.pptx
The Orbit & its contents by Dr. Rabia I. Gandapore.pptxThe Orbit & its contents by Dr. Rabia I. Gandapore.pptx
The Orbit & its contents by Dr. Rabia I. Gandapore.pptx
 
Video capsule endoscopy (VCE ) in children
Video capsule endoscopy (VCE ) in childrenVideo capsule endoscopy (VCE ) in children
Video capsule endoscopy (VCE ) in children
 
Cardiac Impulse: Rhythmical Excitation and Conduction in the Heart
Cardiac Impulse: Rhythmical Excitation and Conduction in the HeartCardiac Impulse: Rhythmical Excitation and Conduction in the Heart
Cardiac Impulse: Rhythmical Excitation and Conduction in the Heart
 
Case presentation on Antibody screening- how to solve 3 cell and 11 cell panel?
Case presentation on Antibody screening- how to solve 3 cell and 11 cell panel?Case presentation on Antibody screening- how to solve 3 cell and 11 cell panel?
Case presentation on Antibody screening- how to solve 3 cell and 11 cell panel?
 
In-service education (Nursing Mangement)
In-service education (Nursing Mangement)In-service education (Nursing Mangement)
In-service education (Nursing Mangement)
 
5CL-ADB powder supplier 5cl adb 5cladba 5cl raw materials vendor on sale now
5CL-ADB powder supplier 5cl adb 5cladba 5cl raw materials vendor on sale now5CL-ADB powder supplier 5cl adb 5cladba 5cl raw materials vendor on sale now
5CL-ADB powder supplier 5cl adb 5cladba 5cl raw materials vendor on sale now
 
5Cladba ADBB 5cladba buy 6cl adbb powder 5cl ADBB precursor materials
5Cladba ADBB 5cladba buy 6cl adbb powder 5cl ADBB precursor materials5Cladba ADBB 5cladba buy 6cl adbb powder 5cl ADBB precursor materials
5Cladba ADBB 5cladba buy 6cl adbb powder 5cl ADBB precursor materials
 
TEST BANK For Lewis's Medical Surgical Nursing in Canada, 4th Edition by Jane...
TEST BANK For Lewis's Medical Surgical Nursing in Canada, 4th Edition by Jane...TEST BANK For Lewis's Medical Surgical Nursing in Canada, 4th Edition by Jane...
TEST BANK For Lewis's Medical Surgical Nursing in Canada, 4th Edition by Jane...
 
5cladba raw material 5CL-ADB-A precursor raw
5cladba raw material 5CL-ADB-A precursor raw5cladba raw material 5CL-ADB-A precursor raw
5cladba raw material 5CL-ADB-A precursor raw
 
DR. Neha Mehta Best Psychologist.in India
DR. Neha Mehta Best Psychologist.in IndiaDR. Neha Mehta Best Psychologist.in India
DR. Neha Mehta Best Psychologist.in India
 
SURGICAL ANATOMY OF ORAL IMPLANTOLOGY.pptx
SURGICAL ANATOMY OF ORAL IMPLANTOLOGY.pptxSURGICAL ANATOMY OF ORAL IMPLANTOLOGY.pptx
SURGICAL ANATOMY OF ORAL IMPLANTOLOGY.pptx
 
CONGENITAL HYPERTROPHIC PYLORIC STENOSIS by Dr M.KARTHIK EMMANUEL
CONGENITAL HYPERTROPHIC PYLORIC STENOSIS  by Dr M.KARTHIK EMMANUELCONGENITAL HYPERTROPHIC PYLORIC STENOSIS  by Dr M.KARTHIK EMMANUEL
CONGENITAL HYPERTROPHIC PYLORIC STENOSIS by Dr M.KARTHIK EMMANUEL
 
Cas 28578-16-7 PMK ethyl glycidate ( new PMK powder) best suppler
Cas 28578-16-7 PMK ethyl glycidate ( new PMK powder) best supplerCas 28578-16-7 PMK ethyl glycidate ( new PMK powder) best suppler
Cas 28578-16-7 PMK ethyl glycidate ( new PMK powder) best suppler
 
Cardiovascular Physiology - Regulation of Cardiac Pumping
Cardiovascular Physiology - Regulation of Cardiac PumpingCardiovascular Physiology - Regulation of Cardiac Pumping
Cardiovascular Physiology - Regulation of Cardiac Pumping
 
Failure to thrive in neonates and infants + pediatric case.pptx
Failure to thrive in neonates and infants  + pediatric case.pptxFailure to thrive in neonates and infants  + pediatric case.pptx
Failure to thrive in neonates and infants + pediatric case.pptx
 
hypo and hyper thyroidism final lecture.pptx
hypo and hyper thyroidism  final lecture.pptxhypo and hyper thyroidism  final lecture.pptx
hypo and hyper thyroidism final lecture.pptx
 
Hemodialysis: Chapter 1, Physiological Principles of Hemodialysis - Dr.Gawad
Hemodialysis: Chapter 1, Physiological Principles of Hemodialysis - Dr.GawadHemodialysis: Chapter 1, Physiological Principles of Hemodialysis - Dr.Gawad
Hemodialysis: Chapter 1, Physiological Principles of Hemodialysis - Dr.Gawad
 
World Hypertension Day 17th may 2024 ppt
World Hypertension Day 17th may 2024 pptWorld Hypertension Day 17th may 2024 ppt
World Hypertension Day 17th may 2024 ppt
 
TEST BANK for The Nursing Assistant Acute, Subacute, and Long-Term Care, 6th ...
TEST BANK for The Nursing Assistant Acute, Subacute, and Long-Term Care, 6th ...TEST BANK for The Nursing Assistant Acute, Subacute, and Long-Term Care, 6th ...
TEST BANK for The Nursing Assistant Acute, Subacute, and Long-Term Care, 6th ...
 
TEST BANK For Huether and McCance's Understanding Pathophysiology, Canadian 2...
TEST BANK For Huether and McCance's Understanding Pathophysiology, Canadian 2...TEST BANK For Huether and McCance's Understanding Pathophysiology, Canadian 2...
TEST BANK For Huether and McCance's Understanding Pathophysiology, Canadian 2...
 

Myeloma treatment

  • 1. Slide shows the tremendous progress made since the early 1960's in the treatment of childhood acute leukemia at St. Jude with their 'total therapy' trials, raising cure rates from <10% to >95% in contemporary trials. The underlying philosophy was to apply all active drugs at any one time up-front rather than reserving agents for the time of relapse.
  • 2. The first ever myeloma tandem transplant trial – Total Therapy 1 – enrolled 231 patients. Shown are the long-term outcome results. At 10 years, 33% are alive and 15% have never relapsed (left panel). Duration of complete remission is depicted on the right, revealing 15 patients who are in continuous complete remission of the 94 who entered such state originally. These patients can be considered cured as all are beyond 10 years.
  • 3. This slide shows the treatment diagrams for Total Therapy 1 (TT1, top) and Total Therapy 2 (TT2, bottom). The difference in TT2 v TT1 included: a) more intensive induction therapy; b) the introduction of consolidation chemotherapy after tandem transplants with Melphalan; and, c) the addition of Dexamethasone pulsing during the first year of maintenance. All patients were randomized to receive or not to receive Thalidomide, which we discovered here to have profound anti-myeloma activity in endstage disease.
  • 4. Outcomes are shown here according to Thalidomide v no Thalidomide for CR (left upper panel), event-free survival (right upper panel), overall survival (left lower panel) and survival after relapse (right lower panel). Note the superior outcomes in terms of CR and event-free survival for patients randomized to Thalidomide, with a divergence in survival curves beginning at 5 years, now actually with further separation, suggesting that statistical significance will eventually be reached. The survival of all patients as of December 1, 2007, has not reached the median at 8 years.
  • 5. Here we are comparing TT2 without thalidomide v TT1 data. Timing of onset of CR and final CR rate were similar; CR duration was superior with TT2 v TT1 as were event-free and overall survival.
  • 6. In this series of MRI examinations, we are pointing to the emergence with therapy of focal white lesions due to unmasking as a result of therapy, showing that the bone marrow background in the spine is getting darker so that these focal lesions can be appreciated. Eventually by June 2001, the MRI looks normal – "hypo-intense and homogeneous" – dark. By December 2002, focal lesions re-appear.
  • 7. The left panel of this slide shows the timing of onset of disappearance of MRI-defined focal lesions which, especially in case of many (>7; blue) lag behind the onset of clinical complete remission (CCR; green). The right panel denotes that patients achieving MRI-defined CR status (blue) fare better than those not achieving MRI-CR status (red).
  • 8. The combined information on both MRI-defined focal lesion number (MRI-FL) and whether or not cytogenetic abnormalities (CA) are present provides separation of survival outcomes. Thus, for those without CA, fewer than 8 FL (=<7) imparts superior survival (blue) than the presence of more than 7 FL (red). Conversely, among patients presenting with CA, higher FL implies poorer outcome than lower FL (gold v green).
  • 9. The top left panel portrays survival outcomes in Total Therapy 2 according to molecular subgroups; the worst outcomes were observed in patients with MS (FGFR3/MMSET; magenta), PR (proliferation; purple) and MF (MAFMAF-B; gold) subgroups, whereas the other five subgroups fared well including CD1 (CCND1-1; blue), CD2 (CCND1-2; red), LB (low bone disease; pink), HV (hyperdiploidy; green) and MY (myeloid subgroup; grey). The top right panel shows survival according to whether the gene array showed a MGUS-like (blue) or non-MGUS-like signature (red). The bottom left panel shows that the ~15% of patients with high-risk myeloma have a much shorter survival with a median of less than 2 years as opposed to the remainder with a 6-yr survival estimate of 65%. The right lower panel addresses the combined effects of high-risk gene signature and the FGFR3 translocation: both in the absence and in the presence of FGFR3 or t(4;14), high-risk imparts poor outcome (blue v green and gold v red).
  • 10. This table examines, among the patients with complete information on all baseline prognostic factors, the roles of standard prognostic factors (SPF, left column), with the progressive inclusion of information on cytogenetic abnormalities (CA, next column to the right), MRI, FISH, and finally, gene expression profiling (GEP) data (right-most column). Indicated are the hazard ratios (HR) along with P-values. Note that for the right-most column with GEP information, the HR value is greatest (3.01). Also, as a measure of the clinical outcome heterogeneity accounted for, the R2-value (bottom row) was highest at 38% for the prognostic model that included GEP data.
  • 11. This slide is very complex with loaded information. In the left half of the slide, we are portraying overall survival HR and P-values in the context of standard prognostic factors (SPF) and the additional impact of CR. Note that adverse variables in the context of Total Therapy 2 (TT2) included elevations of creatinine and LDH as well as CA, whereas achieving CR status was a positive feature (HR=0.56). On the right part of the slide, data are portrayed in the context of GEP data: note the overwhelming importance of GEP-defined high-risk (HR=5.74) and the favorable impact of CR which however was restricted to the high-risk subset (HR=0.35). These data imply that, in the context of GEP information, CR is critically important for the group of patients with the so-defined high risk, whereas CR was not an independent favorable outcome feature in the GEP-defined good risk group. Also note the independent favorable implications of applying a second transplant (HR=0.58).
  • 12. Some of the data described in slide 11 are depicted graphically in this slide: note the huge difference imparted by achieving CR status within 18 months from treatment start among high-risk patients (right panel), whereas no such impact was observed among the good-risk subgroup (left panel).
  • 13. Here we are showing that a second transplant benefit is particularly evident among patients already in CR after the first transplant (left panel), whereas no such benefit was apparent in patients not in CR after first transplant.
  • 14. Another important aspect of our work in TT1 and TT2 is portrayed here: we examined whether it was relevant or not for subsequent survival whether patients had been in uninterrupted remission for 4 years from starting therapy. Counting from a 5-year post-treatment landmark, you will notice that those patients not suffering a relapse within 4 years (continuous remission) fared significantly better than their counterparts who had experienced a recurrence during that time interval. Thus, at 7 years from the +5-year landmark, that is at 13 years from treatment start, 66% v 30% of patients are alive in uninterrupted v interrupted remission in the first 4 years.
  • 15. In Total Therapy 3 (TT3), we added Velcade ("V) to DT-PACE as V-DTPACE for induction and consolidation therapies prior to and after Melphalan 200mg/m2-based tandem transplants (left upper panel); during the first year of maintenance, patients are receiving VTD (Velcade, Thalidomide, Dexamethasone) and thereafter only THAL plus DEX. Patient characteristics are depicted in the left bottom panel, with a median age of almost 60 years and cytogenetic abnormalities present in 33%. The treatment objectives are summarized in the panel on the right. Importantly, compared to TT2, both induction and consolidation phases were reduced from 4 cycles to 2 cycles. Velcade was added as it targets both myeloma cells and the bone marrow microenvironment.
  • 16. As intended, the progression of patients through the successive treatment phases was faster in TT3 than in TT2. Thus, by 6 months, almost all patients had completed the second transplant, and consolidation therapy was finished within 12 to 13 months.
  • 17. This slide shows the rapid onset of remission in terms of PR, near-CR (N-CR) and stringently defined CR; over 80% achieved N-CR status.
  • 18. Here, the response kinetics are portrayed in relationship to TT2, showing again significantly faster onset to the various response levels with TT3 v TT2.
  • 19. Clinical outcome data are summarized in this slide for the 303 patients who entered TT3 in relationship to the 2 arms of TT2. Note the superior CR duration and event-free survival rates with TT3 compared to both arms of TT2 with a strong trend apparent for overall survival. Despite similar CR rates for TT3 and the Thalidomide arm of TT2, CR duration was superior with TT3.
  • 20. As shown in this slide, the relapse rates after TT3 were significantly suppressed in comparison with comparable phases of TT2.
  • 21. Looking at the TT3 outcome data in the context of gene expression profiling (GEP), the 85% with low-risk MM have 2-yr survival, event-free and continuous CR of 91%, 90% and 94%, respectively, as opposed to 70%, 58% and 60% among the 15% with high-risk MM.
  • 22. Importantly, FGFR3 status does not affect TT3 survival once GEP risk status is accounted for.
  • 23. According to translational research studies performed as part of TT3, a 48hr GEP sample obtained after a test dose of Velcade showed that the patients showing suppression of a micro-environment-associated gene (MAG-1) fared significantly better than those without change and especially those with an increased expression of MAG-1 48hr after Velcade – attesting to the important contribution of bone marrow micro-environment alteration by Velcade to the clinical course.
  • 24. This slide summarizes for TT3 and TT2 CR duration (top panels), event-free survival (middle panels) and overall survival (bottom panels) according to gene expression profiling (GEP) –defined risk (low-risk, left panels; high-risk, right panels). The benefit of TT3 was limited to the 85% with low-risk.
  • 25. Although considered a high-risk feature with TT2, the FGFR3 subgroup fared significantly better with TT3 for all 3 clinical endpoints examined.
  • 26. This slide summarizes the progress made as we transitioned from TT1 to TT2 to TT3 protocols. The remarkable improvement in CR duration with TT3 is striking (top right). As a result of abbreviated induction and consolidation in TT3 v TT2, completion of first and second transplants has markedly improved in TT3 (left panel).
  • 27. We next examined the role of completion of protocol steps in a timely fashion in TT2: survival was superior among the patients completing all protocol steps within 3 years, which was particularly true for high-risk patients presenting with cytogenetic abnormalities (CA, right panel).
  • 28. Similar observations pertained to TT3, employing a landmark of completion of steps of 1.5 years.
  • 29. In order to appreciate the role of Velcade in the improvement of TT3 v TT2, we examined outcomes of patients in both studies who finished consolidation within 2 years from starting protocol therapy, in order to account for the faster application of treatment steps in TT3. Note the marked improvement in event-free survival (right panel).
  • 30. This table stresses that completion of treatment steps is an independent positive feature that is associated with superior event-free survival in TT2 and TT3, adjusting for GEP-defined high-risk disease.
  • 31. Appreciating that the mere observation of achieving CR status may be insufficient, since CR rates are actually higher in high-risk myeloma, we explored the optimal time interval of remaining in CR after initiation of therapy. As is shown for TT2 (upper left), sustained CR status for 3yr was associated with superior survival, followed by the group of patients who had not achieved CR status in 3yr while the worst outcome was observed in subjects who attained and lost CR status within that time frame. Similar results pertained to patients enrolled in TT1 (bottom left) and those treated on other protocols for previously treated myeloma (bottom right).
  • 32. The table reveals that sustained CR (SUS-CR) indeed was an independent favorable feature associated with superior survival in these three patient groups.
  • 33. This slide portrays, for all total therapy protocols, the post-transplant survival according to the presence of cytogenetic abnormalities (CA) present at baseline or prior to 1st transplant. Superior outcomes were observed in the absence of CA at both time points, followed by the group of patients that exhibited CA only at baseline but not at relapse, whereas survival was equally poor among those who had persistent CA pre-transplant regardless of baseline status.
  • 34. Similar observations pertained to the subset of patients treated with TT2.
  • 35. Here we examine post-relapse survival according to the presence of CA at baseline and at relapse. Best survival outcomes were noted among patients without CA at both time points, followed by those with baseline abnormalities only while the post-relapse survival was similar among patients with CA at relapse whether or not CA were present at baseline.
  • 36. Here we are examining the hazard rates over time of death among high- versus low-risk myeloma patients in TT2. Four to five years are required for the hazard rate in high-risk myeloma to drop to the level observed in low-risk disease.
  • 37. The same scenario is examined here for TT3: note the faster drop with TT3 in hazard rate among GEP-defined high-risk patients to levels seen in low-risk myeloma within 3 years.
  • 38. This slide summarizes the collective experience at Arkansas with Total Therapy protocols, TT1, TT2 and TT3, collectively referred to as TT-p, versus non-Total Therapy protocols (non-TT-p) for previously treated patients versus patients receiving off-protocol tandem transplants (non-p). Overall and event-free survival data are summarized in the top panels. The bottom panels reveal, for all patients regardless of protocol status, their outcomes according to the presence of 5, 4, 3, 2, 1 or 0 favorable prognostic factors for overall survival (left bottom) and event-free survival (right bottom) – note the huge differences in outcomes related to this grouping.
  • 39. Outcome evaluation according to age is portrayed in the left lower panel: survival was similar for the age groups from <35yr to 64yr and then worsened especially in patients older than 75yr. Deaths from any cause are counted as events. In the case of renal function (right bottom), favorable outcomes were noted up to creatinine levels of 2.0mg/dl, while there was no difference between the <3.7 and >3.6mg/dl groups. The top left panel reveals superior post-salvage third transplant survival in patients for whom at least 3 years had elapsed since second transplant.
  • 40. A potential consequence of chemotherapy as well as autotransplant-supported high-dose therapy is the development of myelodysplasia (MDS), which is best recognized by typical cytogentic abnormalities. As part of every bone marrow examination for myeloma, we are also performing cytogenetic studies which can reveal MDS-associated CA (MDS-CA). Portrayed in this slide is the cumulative frequency of MDS-CA in relationship to the number of potential risk factors present, which include lower number of stem cells (CD34 < 3x 10⁶/kg), age (>=70yr) and when the first transplant occurred late in the course of a patient's management (>30 months from initial therapy).
  • 41. Summarized here are the principles pursued in the Arkansas program.