OCR F585 Global Economy Extract 5
•
2 gostaram•5,553 visualizações

1) Zambia faces several key structural issues that constrain its economic growth including overdependence on copper mining, low agricultural productivity, inadequate infrastructure, poor access to credit, and high unemployment. 2) To address these challenges, Zambia is pursuing policies to promote investment and diversification through special economic zones, incentives for foreign investment, and liberalizing financial markets. 3) However, Zambia still faces headwinds including falling copper prices, rising debt levels, and a challenging macroeconomic environment that threaten progress toward its goal of becoming a prosperous middle-income country by 2030.

Recomendados
Recomendados
Mais conteúdo relacionado
Mais procurados
Mais procurados (20)
Destaque
Destaque (20)
Semelhante a OCR F585 Global Economy Extract 5
Semelhante a OCR F585 Global Economy Extract 5 (20)
Mais de tutor2u
Mais de tutor2u (20)
Último
Último (20)
OCR F585 Global Economy Extract 5
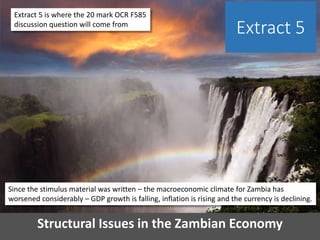
- 1. Structural Issues in the Zambian Economy Extract 5 Extract 5 is where the 20 mark OCR F585 discussion question will come from Since the stimulus material was written – the macroeconomic climate for Zambia has worsened considerably – GDP growth is falling, inflation is rising and the currency is declining.
- 2. OCR F585 June 2016 Country Focus: Zambia • Zambia is a factor-driven developing country and has enjoyed strong GDP growth in recent years • Has it made similar human development progress? • Is their growth and development path sustainable? • Will the Zambian economy get through a difficult period of falling copper prices and rising inflation? • How best can Zambia benefit from regional and global trade? • How can it diversify away from high dependence on copper?
- 3. World Bank Report on Zambia (June 2015) • “With strong economic growth in the last decade traceable to significant investments in Zambia’s copper mining sector, Zambia has now reached lower– middle-income status.” • “Despite this income growth, however, more than 60 percent of its people live below the national poverty line.” • “In addition, a century of mining has imposed environmental and public health costs on the country and its people.” This World Bank quote is a useful reminder of some of the externalities from countries experiencing rapid economic growth. Zambia is a good example of this.
- 4. Zambia and Malawi – Real GDP per capita (PPP) The good news for Zambia is that a period of sustained economic growth has led to significant increases in their real GDP per capita (PPP adjusted). In 2008, Zambia overtook the Sub Saharan average and is now classified as a lower middle income country. Malawi on the other hand has been left behind; real incomes per head have increased at a slower rate and it remains one of the poorest countries on the planet with very low HDI scores.
- 5. Per Capita Incomes across the African Continent Zambia
- 6. Slower Growth Limits Gains in the Standard of Living 8.4 7.8 9.2 10.3 6.4 6.8 6.7 5.6 4.3 4.0 5.4 4.8 6.1 7.0 3.1 3.4 3.3 2.2 0.9 0.6 0.0 2.0 4.0 6.0 8.0 10.0 12.0 2007 2008 2009 2010 2011 2012 2013 2014 2015 2016 Annual growth of real GDP and real GDP per capita for Zambia (Source IMF World Economic Outlook, data for 2016 is forecast (November 2015) Real GDP Growth Real GDP Per Capita Growth Zambian government’s GDP growth target = 7% pa
- 7. How many of these growth limiters apply to Zambia? Infrastructure Gaps Primary Export Dependency Macroeconomic Instability Conflict and Corruption Human Resource Gaps Insufficient Savings & High Debt Natural Capital Depletion Rising Income Inequality
- 8. Extract 5: What are key structural issues facing Zambia? • Structural issues refer to underlying weaknesses on the supply-side of the Zambian economy: Here are some of the supply-side deficiencies: 1. Low capital investment as a share of GDP and falling private sector investment – in part the result of changing corporation tax and royalty regimes and – more recently – the global slump in copper/cobalt prices 2. Heavy dependence on copper mining – volatile X revenues and investment 3. Low productivity agriculture – still employing over 60% of workforce 4. High rates of unemployment & under-employment (a dual labour market) 5. Severe infrastructure weaknesses – especially power supplies and poor transport networks which increase the costs of doing business 6. Inadequate financial services industry – poor & expensive access to credit 7. High levels of income and wealth inequality (high Gini coefficient = 0.57) 8. High drop-out rate for secondary education + poor quality of teaching 9. Zambian manufacturing industry is shrinking (an example of premature de-industrialisation associated with the natural resource curse) 10. Outward migration of some skilled, younger workers – estimated to be 1.5% of the Zambian population in 2011 – many go to RSA, Botswana & UK
- 9. Zambia – A Case Study in Poor Access to Credit Poor access to credit Poor infrastructure Excessive bureaucracy Regulations and licensing requirements Supply-Side Constraints • Poor Access to Credit • Less than 38% of the Zambian adult population have access to any form of financial service • Lending to the private sector is low at 12% of GDP in 2013, below the Sub-Saharan average of 21% • Interest rates on loans are high • Businesses seeking credit to expand are limited in their access to loans • Few households or businesses have any form of insurance • Many rely on informal lenders which exploit and are very high risk • The majority of households do not save or have formal savings accounts with banks
- 10. Zambia – Poor Access to Credit • While 36% of adults in Zambia’s urban areas have a bank account, only 17% in rural areas have one • In 2013 there were just 360 bank branches in Zambia • The number of ATM machines has increased from 537 in 2011 to 744 in 2013 • Only 5% of adult Zambians who own mobile phones use them for financial transactions, far less than the average of 16% in Sub- Saharan Africa Zambia is behind Kenya in expanding access to financial services through mobile payment systems. Micro finance may help to deepen the available of credit available for households, farmers and other small-scale producers in the Zambian economy.
- 11. Supply-Side Policies to Address Poor Access to Credit • World Bank Report (2014) • “Financial inclusion has major effects on people’s lives. It helps them save, borrow, reduce costs of transactions, and manage shocks. There is growing empirical evidence that financial inclusion is important for economic development and poverty reduction, and that the poor benefit considerably from basic payment and savings services.” Investment in basic financial literacy rates Encourage micro-finance lenders Incentives for foreign investment from overseas banks Allow Zambia Post to provide financial services – especially in rural areas
- 12. Zambia suffers from Chronic Infrastructure Gaps Poor access to credit Poor infrastructure Excessive bureaucracy Regulations and licensing requirements Supply-Side Constraints • Landlocked Zambia scores poorly in the infrastructure rankings published as part of the Global Competitiveness Index • Quality of overall infrastructure 93/140 • Quality of roads 81/140 • Quality of railroad 80/140 • Quality of port infrastructure 131/140 • Quality of air transport 112/140 • Electricity and telephony 119/140 • 90% of Zambia’s power comes from hydro- electric plants making the country especially vulnerable to drought • To earn foreign exchange, Zambia exports much of it’s own power from hydro-electric power – this damages electricity supply to the farming industry • Copper mines absorb much available energy supply. There are frequent power outages affecting homes & businesses • Much copper output is transported on poor roads which adds to costs and hurts profits
- 13. Other Constraints facing the Zambian Economy High youth unemployment and huge under- employment problem High extreme poverty levels especially in rural areas (>80% on less than $1.25 per day PPP) Low agricultural productivity – much subsistence farming High public sector wages compared to the private sector Persistent fuel shortages and reliance on fuel subsidies Volatile currency – this adds to investor risk and may limit FDI inflows
- 14. Extract 5: Supply-Side Polices to Promote Growth • The aim of the government is – by 2030 – to become a prosperous middle-income nation. The history of other many resource-rich countries suggests this will not happen unless Zambia successfully diversifies the economy and achieves more inclusive growth • Policies aim to increase capacity, competitiveness and capabilities 1. Special Economic Zones (currently two – low import tariffs and 5- year relief from corporation tax and taxes on dividends) 2. Incentives to attract inward investment especially in power and transport and telecoms infrastructure and in commercial farming 3. Liberalizing financial markets to encourage more competition in basic financial services / attracting micro-finance organisations 4. Reductions in the state minimum wage (it is 3 times the private sector min wage) to cut state spending and encourage private employment 5. More efficient tax collection systems to fund an long-run increase in education spending especially in rural areas / remote communities
- 15. Investment as a % of GDP for the Zambian Economy One feature of Zambia shown in this chart is the significantly higher level of capital investment as a share of GDP contrasted with Sub-Saharan Africa and the continent’s largest economy, South Africa. Gross Capital Investment in Zambia (% of GDP) 2013 2014 2015 Gross Investment 33.6 31.1 31.7 Government Investment 6.3 5.4 5.9 Private Sector Investment 27.3 25.7 25.8 Source: IMF (2015 is a forecast)
- 16. Employment Structure for Zambia Economic activity Employment by sector (% of total employment) 1975 1991 2000 2005 2010 2013 Agriculture n/a 65 72.5 72.2 65.5 55.3 Mining & utilities n/a 2.7 2.2 1.8 2.4 2.3 Manufacturing n/a 10.1 3.9 4 3.8 4.1 Construction n/a 0.9 1 1.3 2.5 3.7 Wholesale, retail, hotels n/a 10 10.3 10.2 11.9 13.7 Transport, storage, communications n/a 2.3 2 2.1 2.7 3.5 Other n/a 8.9 8 8.4 11.2 17.5 Total n/a 100 100 100 100 100
- 17. Most problematic factors for doing business (Zambia) This chart is taken from the 2015-16 World Economic Forum Competitiveness Report and ranks the biggest barriers to doing business in the Zambian economy. Low access to credit is easily the dominant factor.
- 18. Zambia – Ease of Doing Business Rankings (2014) Source: World Bank (2015) Ranking within Sub Saharan Africa Economy Ease of Doing Business Rank (Global) Starting a Business Getting Electricity Getting Credit Trading Across Borders Enforcing Contracts Mauritius 28 3 1 3 1 2 South Africa 43 7 27 5 5 4 Rwanda 46 15 4 1 33 9 Ghana 70 12 6 3 11 16 Botswana 74 26 11 7 26 8 Seychelles 85 18 16 40 2 18 Namibia 88 28 5 7 17 7 Swaziland 110 25 22 7 13 41 Zambia 111 8 14 2 41 17 Tanzania 131 17 9 32 18 3 Ethiopia 132 33 8 38 35 6 Kenya 136 24 23 15 25 25 Malawi 164 29 41 32 37 32 One of the policy priorities for the Zambian government is to improve the country’s rankings for ease of doing business. Zambia is ranked only 9th in Sub Saharan Africa using these criteria and 111th globally.
- 19. Zambia – Special Economic Zones • A Special Economic Zone (SEZ) is an area within a country that has special economic treatment and policies, for example lower corporation tax rates, better access to economic advisors, and more flexible labour laws. • Usually, firms that operate in an SEZ are able to produce at a lower cost than firms elsewhere in a country, therefore gaining a competitive advantage. • The general aims of SEZs are to increase employment, increase capital investment and increase trade • China is probably the best-known example of using SEZs to stimulate economic growth and development
- 20. Zambia – Special Economic Zones • Zambia currently has two SEZs, both developed in partnership with China’s imaginatively-named (state- owned enterprise or SOE) China Non-Ferrous Metal Mining Corporation. • One, near the capital city Lusaka, specializes in producing clothing, food and electronics. • The other is found in Zambia’s copper-belt, and unsurprisingly specializes in copper- related products • Companies operating in SEZ pay no corporation tax for the first 5 years and zero tax on dividends for 5 years • Zero import duty on capital goods and specialized vehicles
- 21. Zambia – Gross Saving Rate (% of GDP) Gross national saving (for households, businesses and government) in Zambia climbed from 2000 onwards and has remained above 30% of GDP since 2008. Gross saving = GDP minus consumption by government and the private sector, expressed as a percentage of GDP. A high gross domestic saving rate usually indicates a country's high potential to invest in capital
- 22. Zambia – Tax Revenues (% of GDP) This chart relates to a key feature of the F585 case study. Over the last fifteen years – save for a large spike in 2005, the Zambian government has not achieved a rise in tax revenues as a share of their GDP. Tax income has remained below a fifth of their annual GDP, limiting the financial resources available for the government to spend on public and merit goods.
- 23. Gross Government Debt for Zambia 22 19 21 19 21 25 29 35 42 45 0 5 10 15 20 25 30 35 40 45 50 2007 2008 2009 2010 2011 2012 2013 2014 2015 2016 Gross Government Debt for Zambia, measured as a % of GDP The Zambian government has been borrowing heavily to fund investment – it has issued several billion worth of Eurobonds. Collapsing copper revenues and slower growth is now causing a fast- rising budget deficit and rising debt.
- 24. Some Advantages of Foreign Direct Investment (FDI) Infrastructure accelerator effects – a rise in investment/GDP Higher capital intensity / capital deepening i.e. more capital per worker Better training for local workers – improved human capital Grows a country’s export capacity (e.g. special economic zones) Technology & know-how transfer / diversification of the economy More competition in markets which then lowers consumer prices Creates new jobs – higher incomes and household savings Lift in the level of labour productivity which increases GNI per capita
- 25. Risks from Foreign Direct Investment (FDI) Inequality – profits from FDI are flow disproportionately to powerful elites Land grabs / extractive FDI which generates little extra tax revenues Ethical standards from TNCs may be poor – especially in mining, farming and textiles Volatile / footloose FDI flows – e.g. FDI is more volatile than remittance flows Limited job creation effects / small spillover for local content suppliers Monopsony power of TNCs who are able to negotiate highly favourable prices
- 26. Productivity Gaps in Zambia 0 0.5 1 1.5 2 2.5 3 3.5 4 4.5 0 10 20 30 40 50 60 70 80 90 100 Relativeproductivity Cumulative employment share (%) Construction Mining & utilities Manufacturing Transport, storage, comms Other Wholesale, retail, hotels Agriculture Productivity in agriculture is far and away the lowest of any sector in the Zambian economy. Measures to lift efficiency would do much to sustain higher per capita incomes in the long run
- 27. Number of Export Items and Markets, Zambia, 2005–13 90 95 100 105 110 115 120 125 130 - 500 1,000 1,500 2,000 2,500 2005 2006 2007 2008 2009 2010 2011 2012 2013 No. HS 6-digit subheads exported (left axis) No. of markets (right axis) 28 EU countries are counted individually e.g. UK, Germany etc. Source: UN’s COMTRADE database Number of export items (LHS) In common with many primary product dependent countries, Zambia exports only a limited number of separate products. This number has declined since 2008 as has the number of individual markets after a significant rise from 2006 onwards.
- 28. Zambian Currency versus the US Dollar ($) Zambia operates with a floating exchange rate with the central bank prepared to intervene using monetary policy if necessary. The central bank has an inflation target of 7% in the near term, falling to 5% in the medium term. 2014-2015 has seen a significant depreciation in the value of the Zambian currency against the US dollar. Consider the benefits and the costs of such a fall in the external value of their currency for the Zambian economy
- 29. Ethiopian Shoe Factory (2013) Source: http://fsmevents.com/csae/2016/session11/assets/slides.pdf
- 30. Garment Factory in Rwanda (2015) Source: http://fsmevents.com/csae/2016/session11/assets/slides.pdf
- 31. Challenges for Economic Transformation in Zambia Enterprise Diversification Resilience Productivity •Drive private sector innovation •Micro-finance in urban and rural areas to promote gender equality Less reliance on state businesses •Lower the risk of premature de- industrialization of manufacturing •Expand tourism / financial services •Expand food exports to China •Raise household income and savings •Expand insurance and pensions •Stronger government finances with a fairer mining tax regime •Expand FDI into commercial farming •Raise human capital / expertise •Address huge infrastructure gaps The crucial challenge facing Zambia is to take steps to improve inclusive sustainable growth and maintain macro stability. Economic growth in Africa in future years is likely to favour less resource-intensive countries such as Ethiopia, Kenya and Uganda. These nations have a more diverse economy & larger consumer markets
- 32. Tutor2u.net/economics @tutor2ugeoff Extract 5 Extract 5 is where the 20 mark OCR F585 discussion question will come from