The Root Causes Behind Todays High Unemployment Situation, And Why This May Not Change Anytime Soon
•
1 gostou•4,436 visualizações


Recomendados
Recomendados
Mais conteúdo relacionado
Semelhante a The Root Causes Behind Todays High Unemployment Situation, And Why This May Not Change Anytime Soon
Semelhante a The Root Causes Behind Todays High Unemployment Situation, And Why This May Not Change Anytime Soon (20)
Mais de Tommy Toy
Mais de Tommy Toy (20)
Último
Último (20)
The Root Causes Behind Todays High Unemployment Situation, And Why This May Not Change Anytime Soon
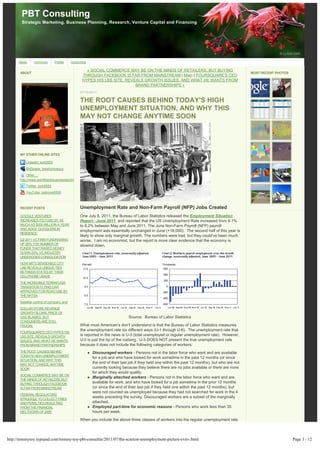
- 1. PBT Consulting Strategic Marketing, Business Planning, Research, Venture Capital and Financing Home Archives Profile Subscribe « SOCIAL COMMERCE MAY BE ON THE MINDS OF RETAILERS, BUT BUYING ABOUT MOST RECENT PHOTOS THROUGH FACEBOOK IS FAR FROM MAINSTREAM | Main | FOURSQUARE'S CEO HYPES HIS LBS SITE, REVEALS GROWTH ISSUES, AND WHAT HE WANTS FROM BRAND PARTNERSHIPS » 07/10/2011 THE ROOT CAUSES BEHIND TODAY'S HIGH UNEMPLOYMENT SITUATION, AND WHY THIS MAY NOT CHANGE ANYTIME SOON MY OTHER ONLINE SITES LinkedIn: turk5555 MySpace: tooshyniceguy Other...: http://www.pointblankbusinesstechnology.com/BusinessPlanInquiry.htm Twitter: turk5555 YouTube: cabrone5555 RECENT POSTS Unemployment Rate and Non-Farm Payroll (NFP) Jobs Created GOOGLE VENTURES One July 8, 2011, the Bureau of Labor Statistics released the Employment Situation INCREASES ITS FUND BY AS Report - June 2011, and reported that the US Unemployment Rate increased from 9.1% MUCH AS $200 MILLION A YEAR to 9.2% between May and June 2011. The June Non-Farm Payroll (NFP) payroll AND ADDS ‘GOOGLERS IN employment was essentially unchanged in June (+18,000). The second half of this year is RESIDENCE’ likely to show only marginal growth. The numbers were bad, but they could've been much Q2 2011 VC FIRM FUNDRAISING worse. I am no economist, but the report is more clear evidence that the economy is UP 29%, THE NUMBER OF slowind down. FUNDS THAT RAISED MONEY DOWN 23%, VC INDUSTRY UNDERGOES CONSOLIDATION HOW MIT'S SENSEABLE CITY LAB REVEALS UNIQUE TIES BETWEEN STATES BY THEIR CELLPHONE USAGE THE INCREDIBLE TERRAFUGIA TRANSITION FLYING CAR APPROVED FOR ROAD USE BY THE NHTSA Satellite control of company and DOLLAR STORE REVENUE GROWTH SLOWS, PRICE OF GAS BLAMED, BUT Source: Bureau of Labor Statistics CONSUMERS ARE STILL FRUGAL What most American's don't understand is that the Bureau of Labor Statistics measures the unemployment rate six different ways (U-1 through U-6). The unemployment rate that FOURSQUARE'S CEO HYPES HIS LBS SITE, REVEALS GROWTH is reported in the news is U-3 (total unemployed or regular unemployment rate). However, ISSUES, AND WHAT HE WANTS U-3 is just the tip of the iceberg. U-3 DOES NOT present the true unemployment rate FROM BRAND PARTNERSHIPS because it does not include the following categories of workers: THE ROOT CAUSES BEHIND l Discouraged workers - Persons not in the labor force who want and are available TODAY'S HIGH UNEMPLOYMENT for a job and who have looked for work sometime in the past 12 months (or since SITUATION, AND WHY THIS MAY NOT CHANGE ANYTIME the end of their last job if they held one within the past 12 months), but who are not SOON currently looking because they believe there are no jobs available or there are none for which they would qualify. SOCIAL COMMERCE MAY BE ON l Marginally attached workers - Persons not in the labor force who want and are THE MINDS OF RETAILERS, BUT BUYING THROUGH FACEBOOK available for work, and who have looked for a job sometime in the prior 12 months IS FAR FROM MAINSTREAM (or since the end of their last job if they held one within the past 12 months), but were not counted as unemployed because they had not searched for work in the 4 FEDERAL REGULATORS STRUGGLE TO COLLECT FINES weeks preceding the survey. Discouraged workers are a subset of the marginally AND PENALTIES RESULTING attached. FROM THE FINANCIAL l Employed part-time for economic reasons - Persons who work less than 35 MELTDOWN OF 2008 hours per week. When you include the above three classes of workers into the regular unemployment rate http://tommytoy.typepad.com/tommy-toy-pbt-consultin/2011/07/the-scariest-unemployment-picture-ever-.html Page 1 / 12
- 2. (U-3), the result is U-6 (Total unemployed, polus all marginally attached workers, plus RECENT COMMENTS total employed part-time for economic reasons). At the end of June 2011, U-6 was Double Glazing on RUMOR: THE nearly 17.5%. This is nearly twice the regular unemployment rate of 9.2% reported APPLE IPAD 2 IS COMING TO by the BLS at the end of June 2011. TOYS "R" US, THAT'S GREAT, BUT WILL CHILDREN REALLY LEARN? buy twitter followers on EMARKETER SAYS FACEBOOK NOW ACCOUNTS FOR MORE THAN 25% OF U.S. ONLINE DISPLAY ADS buy twitter followers on IMBEE, A SOCIAL NETWORKING SITE FOR TWEENS, RELAUNCHES WITH A LOT OF FANFARE AND TIGHTER CHILDREN'S SECURITY web hosting on HOW SONAR IS TRYING TO CONNECT MULTIPLE USERS FROM MULTIPLE SOCIAL NETWORKS, CAN THEY GET IT TO WORK? web hosting on FORRESTER Source: Bureau of Labor Statistics AND SHARETHIS SAY SAME THING: GO SOCIAL AND MOBILE Not only has the unemployment rate remained high for a long period of time, TO INCREASE ENGAGEMENT but the average duration of unemployment is skyrocketing without any hint of AND TRAFFIC TO YOUR slowing down. This truly scary chart shows this quite clearly. WEBSITE Website Design Company on AVOID THE TOP 10 INTERNET MARKETING MISTAKES BY SOFTWARE COMPANIES Jamie Shellman on FIVE KEY BUSINESS FINANCE TRENDS FOR 2010, STARTUP CAPITAL WILL BE TIGHT fruit machine games on ATLANTIC CITY'S TROPICANA CASINO AND RESORT LOSES $11 MILLION TWO GAMBLER'S IN A MATTER OF TWO MONTHS Dante Mallet on TESLA MOTORS' ENDS PRODUCTION OF ITS ROADSTER ELECTRIC SPORTSCAR, BUT TESLA NOT DONE WITH ELECTRIC SUPERCARS Robert on NOKIA'S NEW N9 SMARTPHONE OFFERS A COOL MODERN DESIGN, LARGE Source: Bureau of Labor Statistics SCREEN, SLICK MEEGO OS AND A UNIQUE GUI WITH THREE The problem has become so acute, that the Obama Administration has had to extend VIEWS unemployment benefits from 26 weeks to 52 weeks and now 99 weeks, coining the term "Ninety-Niner's" for those individuals out of work two years. According to the BLS, there are now 6.289 million workers (see graph below) who ARCHIVES have been unemployed for more than 26 weeks and still want a job. This was up from July 2011 6.2 million in May. This is very high, and long term unemployment is one of the defining features of this recession. June 2011 May 2011 April 2011 March 2011 February 2011 January 2011 December 2010 November 2010 October 2010 More... CATEGORIES Advertising Aeronautics and Space Agriculture Apparel and Accessories Archaeology Architecture and Construction Armaments and Weapons Source: Bureau of Labor Statistics Art and Design Percentage of Jobs Lost During The Great Recession Automobiles and Transportation After the miserable Bureau of Labor Statistics Employment Situation Report - June Baby Products 2011 (see above), the pace of the recovery is really starting to look dimmer. http://tommytoy.typepad.com/tommy-toy-pbt-consultin/2011/07/the-scariest-unemployment-picture-ever-.html Page 2 / 12
- 3. Beauty and Hair If you are like me, you are probably asking yourself a series of questions: Bicycles Bioscience "Why does the regular unemployment rate remain so high?" Blogs "Why do unemployed workers remain out-of-work so long?" Boats and Yachts "Where did the jobs go?" Books "Is there any hope for the future?" Branding Celebrities and Personalities In order to answer the above questions, it is important to understand the emensity of the job situation. The chart that follows shows the job losses from the start of the Great Censorship Recession of 2007, in percentage terms - this time aligned at the start of the recession. Childrens Social Development In terms of lost payroll jobs, the Great Recession is by far the worst since WWII. As Computer Viruses and Cyber a percentage of the US work force, we have lost 6.6% of the total jobs. Making Attacks things worse was the effect of the financial meltdown of September 2008 on Computers and Accessories business owners who reacted to the fear and uncertainty by laying off employees in extraordinary numbers, far greater than in past recessions. Job losses were so deep Consumer Electronics and during the Great Recession that it's no wonder the unemployment remains high. Accessories Consumer Packaged Goods Consumers Counterfeiting Crime crowdfunding and crowdsourcing Current Affairs Demographics and Lifestyle Segmentation Dictators and Rulers Digital and Video Content Sharing Diseases and Infections Earth and Environment eCommerce Economy Economy and Employment Education and Information Email Employment Energy and Green Technology Engineering Source: calculatedriskblog.com Entertainment The American Recovery and Reinvestment Act of 2009 or Stimulus Plan which was Espionage enacted in early January 2009, poured $787 billion in to the economy and lifted employment by roughly 2.5 million jobs, outside analyses have found, but that has not Fashion and Style been enough to reduce the unemployment rate substantially. Nor are there signs that Film business investment or consumer demand will do so soon. Finance Where Did All The Jobs Go? Firearms and Armaments This is a question that has haunted many economists. There is no single reason, but it Food and Drink appears that job losses began to accelerate after the year 2000. Several reasons for the Food and Nutrition incredible loss in jobs have been given, including job destruction forces from Foodservice computerization (faster computers, the internet, software productivity tools and Foreign Cultures applications) and globalization (outsourcing jobs, especially NAFTA). Franchising Outsourcing of jobs to foreign countries is one of the great hidden economic issues Funerals, Burials and Gaskets of recent years. It is big business, with multinational corporations actively shifting jobs out of the United States and around the globe in search of the cheapest possible labor. But, Furniture following popular outcry against the practice in 2004, corporations have done their best to Gambling hide the details even as they expand their offshoring activities. As a result, outsourcing Games has by and large fallen out of the headlines. Geography According to a study titled, "Sending Jobs Overseas: The Cost to America’s Economy Government and Regulatory and Working Families", was co-produced by the AFL-CIO and Working America to determine the economic impact of outsourcing jobs. Some of the findings of the study Health and Medical were as follows: History l Collapse of Manufacturing Jobs - US manufacturing jobs dropped high of 19.5 Hospitality million workers in June 1979 to 11.5 workers in December 2009, a drop of 8 million Household Consumer Items workers over 30 years. Between August 2000 and February 2004, manufacturing Information Technology jobs were lost for a stunning 43 consecutive months—the longest such stretch since the Great Depression. During the Great Recession, which began December Insurance 2007 and ended November 2010, an estimated 2.5 million manufacturing jobs were International lost. According to the Alliance for American Manufacturing (AAM, the US lost Internet 5.5 million jobs and at least $245 billion in manufacturing wages since the start of 2000. Inventions IPO's and Investments Jewelry, Watches and Accessories Legal Luxury Goods Magazines, Newspaper and http://tommytoy.typepad.com/tommy-toy-pbt-consultin/2011/07/the-scariest-unemployment-picture-ever-.html Page 3 / 12
- 4. Publications Mail and Freight Shipping Management and Human Resources Manufacturing and Prototypes Marine and Aquatic Mammals and Fish Market Intelligence and Data Analytics Marketing Mental Health and Psychology Mergers and Acquisitions Military and Wars Mining, Metals and Minerals Mobile Motorcycles and Scooters Music Natural Catastrophe's and Events Natural Resources News and Information Nuclear Energy and Radiation Oil Online Dating and Relationships Outdoor Products Parenting Pet Products and Accessories Pet Products and Health Care Pharmaceuticals Philanthropy, Foundations and Charities l Destruction of Manufacturing Sector - The number of manufacturing firms has Photography declined sharply since 1999, after growing steadily earlier in the decade. The total Physics number of manufacturing establishments of all sizes grew by nearly 26,000 Politics between 1990 and 1998 but shrank by more than 51,000 (12.5 percent) between 1998 and 2008. An additional 5,730 establishments disappeared in 2009, bringing Product Design and Development the total net decline to more than 57,000 since 1998. Public Relations l Jobs Outsourced Overseas Skyrocket - Since 2000, the United States has lost Radio Frequency Identification more than 5 million manufacturing jobs and 850,000 information sector jobs, many RFID of which have been shipped overseas. Faulty trade and tax policies continue to lead to outsourcing as corporate executives boast record-breaking profits and Real Estate salaries. Relationships and Marriage l Job Outsourcing Is Big Business - Plunkett’s Outsourcing & Offshoring Religion Industry Almanac 2010, estimates that job outsourcing was a $500 billion global Restaurants industry in 2009 that involved more than 350 prominent organizations operating in 61 distinct industry groups. Retailing l Corporate Profits Soar - While 26.1 million Americans were unemployed, Robotics underemployed, marginally attached to the labor market or involuntarily working at Science part-time jobs as of Labor Day 2010, according to the Economic Policy Institute, corporate profits increased (at an annualized rate) to $1.64 trillion dollars during the Search Engines second quarter of 2010. Security Systems and Devices The study determined that since 2000 the US has lost more than 5 million manufacturing Sex and Mature Content jobs and 850,000 information sector jobs, many of which have been shipped overseas. Social Causes Faulty trade and tax policies continue to lead to outsourcing as corporate executives Social Networks boast record-breaking profits and salaries. Software Manufacturing isn't the only sector hurt by outsourcing. A 2002 study conducted by Sports the Forrester Research concluded that 3.3 million white-collar U.S. jobs—including 500,000 information technology jobs—will shift offshore to countries by 2015 at a cost of Stock Prices over $136 billion in wages. Technology There are several arguments for and against the outsourcing of American jobs. Telecommunications Corporations claim this is the only way they can compete in the global economy. Labor Television and environmental experts say American manufacturer's go overseas because foreign Textiles countries have less restrictive employment and environmental laws and regulations. Toys Transportation Travel UFO's and Extra-Terrestrial Beings Utilities Venture Capital and Entrepreneuring Videoconferencing and Telepresence Water Wealth http://tommytoy.typepad.com/tommy-toy-pbt-consultin/2011/07/the-scariest-unemployment-picture-ever-.html Page 4 / 12
- 5. Weather Web/Tech Weblogs World Affairs World Records Add me to your TypePad People list By the way, Working America's Job Tracker tracks the hiring, layoffs and outsourcing activities of over 400,000 American companies. You can access the Job Tracker HERE. Subscribe to this blog's feed However, this is not the complete answer to this job loss puzzle. Blog powered by TypePad According to Barry Lynn and Phillip Longman, two research writers for the Washington Monthly, blame jobs losses not on job destruction forces, but a lack of job creation. And Blog powered by TypePad the engine of job creation is small businesses. Member since 09/2010 Msrrs Lynn and Longman, propose a third job destruction force: CONSOLIDATION. Starting in the early 80s, the Reagan administration began deregulating many industries and decided to quit enforcing antitrust laws. Big companies began merging in earnest, and by the early 2000's it was common for three or four firms to control upwards of half or more of entire sectors. It happened in banking, retail, transportation, pharmaceuticals, medical and health, broadcasting and automobile industries, accounting, and advertising, just to name a few. And not only do big firms innovate less than small firms, they also prevent innovative small firms from ever getting a chance to grow in the first place by hiring the smartest and the brightest, controlling channels of distribution, generating economies of scale, litigation to prevent small company innovation, and exercising monopoly power. The job growth of the 80s and 90s, Lynn and Longman suggest, was largely powered by companies that were founded in the 70s — companies like Apple, Microsoft, Oracle, and Genentech. By the time the 2000's rolled around, consolidation was largely complete and the pipeline of small, innovative companies was drier than it had been in decades. The following chart shows just how rapidly we began to lose jobs during the 2000's. To see just how widespread the job losses have been across the country, Tip Strategies, Inc, an economic development consulting firm in Austin, Texas, has designed an online animated map showing how jobs have come and gone, on a rolling 12-month from January 2004 to July 2009. If you thought the above graphs were scary, wait till you see this one. http://tommytoy.typepad.com/tommy-toy-pbt-consultin/2011/07/the-scariest-unemployment-picture-ever-.html Page 5 / 12
- 6. [Click The Map To View An Animated Map] The above map shows that JOBS GAINED rapidly turned into JOBS LOST beginning in the third quarter 2007, began to accelerate in 2008, and exploded after the Financial Meltdown of September 2009. In mid-2005, Hurricane Katrina hit New Orleans with a vengence and that part of the country was immediately hit with job losses. Job losses finally began to subside after Barack Obama came into office and enacted the Stimulus Bill in 2009. During this tumultous period, the biggest job losses occurred in California, Arizona, Nevada, Florida, Illinois, Michigan, Georgia, New York and Pennsylvannia. Part-Time Workers For Economic Reasons From the BLS report: The number of persons employed part time for economic reasons (sometimes referred to as involuntary part-time workers) was essentially unchanged in June at 8.6 million. These individuals were working part time because their hours had been cut back or because they were unable to find a full-time job. The number of workers only able to find part time jobs (or have had their hours cut for economic reasons) increased slightly to 8.552 million in June. These workers are included in the alternate measure of labor underutilization (U-6) that increased to 16.2% in June from 15.8% in May. This is the highest level this year (highest since December 2010). In a blog article dated April 8, 2011, I commented on the huge number of part-time workers (see graph below) which began trending upwards in January 2002, and really began to accelerate with the beginning of the Great Recession in December 2007. As of January 2011, the number of part-time workers is now over 9 million, continuing the trend that began in 2002. Source: Bureau of Labor Statistics Recap of the NFP Data Note that there is no category that was not under street expectations. Things are much worse in employment land than anyone thought. Source: Bureau of Labor Statistics Labor Force Participation (LFP) The LFP is now at levels not seen in a decade. The LFP rate is the percentage of working-age persons in an economy who: l Are employed. l Are unemployed but looking for a job. Typically "working-age persons" is defined as people between the ages of 16-64. People in those age groups who are not counted as participating in the labor force are typically students, homemakers, and persons under the age of 64 who are retired. In the United States the labor force participation rate is usually around 67-68%. http://tommytoy.typepad.com/tommy-toy-pbt-consultin/2011/07/the-scariest-unemployment-picture-ever-.html Page 6 / 12
- 7. A look at the below chart confirms that as of Friday, July 8, 2011, the labor force participation hit a new record low of 64.1%. The previous high LFP rate was 66.4% at the end of December 2006. Source: Bureau of Labor Statistics A LOOK AT WHAT'S INSTORE FOR THE U.S. ECONOMY The manufacturing sector has always been the engine for the U.S. economy, creating stable employment and good paying jobs so that America can maintain its high standard of living and maintain a strong middle class. The loss of millions of jobs due to computerization, outsourcing and industry consolidation, may have permanently damaged the structure of the U.S. economy, resulting in continuing high rates of unemployment, lower manufacturing activity, a stagnant and unstable economy unable to create sufficient jobs, and lower GDP growth rates. Economists have already warned of the potential for a "double dip" recession. The fragile nature of the U.S. economy makes it especially susceptible to inflation, high interest rates, bubbles (real estate, technology, etc.), wars, natural disasters and sovereign debt problems like those in Europe. The following charts make these points abundantly clear. ISM Purchasing Managers Index (PMI) Unemployment rates remain high becase we have become a nation of consumers not makers of things. The graph below charts the Institute of Supply Management's (ISM) Purchasing Managers Index (PMI) which measures the economic activity in the U.S. manufacturing sector. The graph also includes several regional PMI's for different regions of the U.S. Economic activity in the manufacturing sector expanded in June for the 23rd consecutive month, with a PMI of 55.3%, and the overall economy grew grew for the 25th consecutive month, say the nation's supply executives in the latest Manufacturing ISM Report On Business® Source: Institute of Supply Management The best single gauge of manufacturing comes from the ISM. The PMI rate on June 30, 2011 was 55.3%. A fall below 50% (PMI at the end of July 2008), which occurred just prior to the financial meltdown, would signal a contraction. Are we headed in that direction? This chart suggests we might: http://tommytoy.typepad.com/tommy-toy-pbt-consultin/2011/07/the-scariest-unemployment-picture-ever-.html Page 7 / 12
- 8. The Conference Board Leading Economic Index (LEI) On June 17, 2011, The Conference Board released its Leading Economic Index (LEI) (see below) for the United States, and the LEI increased to 114.7 (2004=100) in May 2011, an increase of 0.4 percent, following no change in April (113.3), and a 1.4 percent rise in March (113.1). The Conference Board Leading Economic Index is an American economic leading indicator intended to forecast future economic activity. The LEI has been trending upwards for 26 straight months since the March 2009 when it was at 98, just three months before the Great Recession ended (June 2009 - See above GDP graph). The US GDP managed to grow in Q3/2009 (+1.6% annualized), reversing a trend that had been in place since the start of the "Great Recession" (December 2007). Things started to accelerate in future quarters - Q4/2009 saw the economy grow at a 5% pace (annualized), while Q1/2010 clocked in at 3.7%. It seemed, for a time, that the economy was on the mend. Since the first quarter of 2010, the wheels have come off and the US economy is seemingly running in place. Bart van Ark, chief economist of The Conference Board said. “The index points to continued, though slower, U.S. growth for the rest of this year. The LEI for the United States has been rising since April 2009, and though its growth rate has slowed in 2010, it is well above its most recent peak in December 2006.” Source: The Conference Board http://tommytoy.typepad.com/tommy-toy-pbt-consultin/2011/07/the-scariest-unemployment-picture-ever-.html Page 8 / 12
- 9. Source: The Conference Board Note: The ten components of The Conference Board Leading Economic Index® for the U.S. include: 1) Average weekly hours, manufacturing, 2) Average weekly initial claims for unemployment insurance, 3) Manufacturers’ new orders, consumer goods and materials, 4) Index of supplier deliveries – vendor performance, 5) Manufacturers' new orders, nondefense capital goods, 6) Building permits, new private housing units, 7) Stock prices, 500 common stocks, 8) Money supply (M2), 9) Interest rate spread, 10- year Treasury bonds less federal funds, and 10) Index of consumer expectations The Gross Domestic Product (GDP) The United States economy grew for the 7th straight quarter, although the rate of growth was disappointing. The United States economy grew up 2.9 percent in 2010. Real GDP in the U.S. increased due to positive contributions from inventories, exports, consumer spending, business investment, and federal government spending. The overall contributions from these areas was offset by an increase in imports. The economy grew by 1.8% in the first quarter of 2011, compared to a 3.1% growth the previous quarter, the United States Department of Commerce reported. The slowdown in the growth of real GDP in the first quarter of 2011 showed that the economy is not gaining momentum, dampening prospects for a meaningful reduction in unemployment in the near future. The Housing Crisis and Construction Industry The US is one of the few western industrialized nations where the dream of home ownership has become a reality for many Americans. The era of cheap money (2003 through 2005), low or no down payment mortgages, real estate speculation, and reckless lending practices of banks and mortgage companies, resulted in highly inflated real estate prices. A real estate bubble was eminent and it hit with a vengence beginning in 2006. The resulting collapse of the US housing industry has resulted in levels of bank foreclosures that are unprecedented since the Great Depression. The result was a catastrophic decline in real estate prices and massive buildup of unsold properties and http://tommytoy.typepad.com/tommy-toy-pbt-consultin/2011/07/the-scariest-unemployment-picture-ever-.html Page 9 / 12
- 10. bank REO's (properties held by banks). In a blog article dated December 10, 2010, at the end of August 2010, the inventory of visible and "shadow inventory" (see blog article for explanation) of unsold homes totaled 6.1 million units--a two year supply. According to First American CoreLogic, at the end of September 2009, the proportion of U.S. homeowners who owed more on their mortgages than the properties were worth swelled to about 23% or 10.9 million homes (click to view interactive map by state). Not much has changed since that time. At the end of December 2010, there were 11.1 million mortgage properties underwater. At the end of March 2011 the number declined to 10.9 million. Since January 2009, new housing starts are stuck at an all-time low of about 500,000 annualized units, compared to 2.250 million units in January 2006. At the end of May 2011, new housing starts remain stuck at 500,00 annualized units, and there is no relief in sight. By every real estate construction and construction employment economic measurement used to determine the condition of real estate construction and employment, the only bit of good news are interest rates, which for a 30-year fixed mortgage have remained under 5.50% over the last two years. The interest rate for a 30- year fixed mortgage in California as of today is 4.75%. The collapse of the US housing industry has devastated the construction industry employment. The unemployment rate for experienced workers in construction was 24.7 percent in January 2010. Total construction payroll employment has dropped by 2.1 million jobs since 2006, with residential construction down by 1.3 million, or 38 percent. The following charts put things into perspective: http://tommytoy.typepad.com/tommy-toy-pbt-consultin/2011/07/the-scariest-unemployment-picture-ever-.html Page 10 / 12
- 11. Conclusion If you are unemployed, I know this has been painful to read, as it was painful for me to research and write. If you are lucky to be employed, this material should give you a lot to think about. 65% of American's live paycheck-to-paycheck. Having said this, it is my honest opinion that today's unemployment situation is structural in nature due to the three job destruction forces mentioned previously, a shift from full-time to part-time workers, a lack of sufficient job creation businesses, and practice of employer's not to hire workers's over 50 years of age, and high unemployment among minorities and college graduates. The new Digital Economy has also played a key role in the shift from blue collar to white collar jobs. Political infighting, the federal deficit, federal debt ceiling and state budget deficits have compounded the unemployment problem, resulting in additional layoffs among government sector workers. Solving the job problem is not going to be an easy task. Jobs outsourced to other countries are not coming back and corporations are content to operate with less employees while relying on part-time workers and temporary workers, instead of hiring new full-time workers. Courtesy of an article dated July 8, 2011 appearing in Business Insider, an article dated July 8, 2011 appearing in Business Insider, an article dated July 9, 2011 appearing in Business Insider, an article dated February 23, 2010 appearing in Mother Jones, an article dated October 23, 2009 appearing in WallepPop, an article dated July 8, 2011 appearing in Calculated Risk, and an article dated May 12, 2009 appearing in Spring Life, an article dated January 20, 2011 appearing in The Market Oracle, and an announcement dated June 9, 2009 by Plunkett Research, the Alliance for American Manufacturing and the Bureau of Labor Statistics Posted at 03:32 PM in Current Affairs, Economy, Economy and Employment, Politics, Real Estate | Permalink Technorati Tags: bureau of labor statistics, construction industry, economy, employment, housing industry, U.S. economy, unemployment, unemployment rate Favorite Reblog (0) Comments You can follow this conversation by subscribing to the comment feed for this post. Post a comment Name: http://tommytoy.typepad.com/tommy-toy-pbt-consultin/2011/07/the-scariest-unemployment-picture-ever-.html Page 11 / 12
- 12. Email address: URL: Comment: 5 6 Submit PBT Consulting Powered by TypePad http://tommytoy.typepad.com/tommy-toy-pbt-consultin/2011/07/the-scariest-unemployment-picture-ever-.html Page 12 / 12