

Recomendados
Mais conteúdo relacionado
Mais procurados
Mais procurados (20)
Destaque
Semelhante a Bar chart
Mais de Tu Nguyen, PMP®,PMI-RMP®
Mais de Tu Nguyen, PMP®,PMI-RMP® (20)
Bar chart
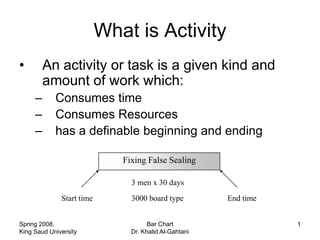
- 1. What is Activity • An activity or task is a given kind and amount of work which: – Consumes time – Consumes Resources – has a definable beginning and ending Fixing False Sealing 3 men x 30 days Start time 3000 board type End time Spring 2008, Bar Chart 1 King Saud University Dr. Khalid Al-Gahtani
- 2. What is Project • A project is a set of activities with – A well-defined objective(s) – A target completion date – An estimated budget Plan s & R equired Specification s Product Project M an agem ent L im ited Project G iven R esources O bjectives D esired Spring 2008, Bar Chart 2 King Saud University Dr. Khalid Al-Gahtani
- 3. Type of Schedule • Written Schedule • Gantt Chart (Bar Chart) • CPM Schedules (Critical Path Method) A – Activity on Arrow 5 – Activity on Node AB A B • PERT 30 X = 36 40 • LSM (Linear Schedule Method) Spring 2008, Bar Chart 3 King Saud University Dr. Khalid Al-Gahtani
- 4. Bar Chart • STEPS – Analyze the project and specify the basic approach to be used. – Break the project down into a reasonable number of activities to be scheduled. – Estimate the time required to perform each activity. – Place the activities in sequence of time, taking into account the requirements that certain activities must be performed sequentially. • Logical constrain • Resources constrain – If a completion date is specified, the diagram is adjusted until this constraint is satisfied. Spring 2008, Bar Chart 4 King Saud University Dr. Khalid Al-Gahtani
- 5. Bar Chart • Example: Activity Activity Description Dependency Duration ID A Excavation 3 C Foundation A 3 D Column B, C 2 B Moving the soil out A 2 E Wall C, D 5 F Roof E, D 5 Spring 2008, Bar Chart 5 King Saud University Dr. Khalid Al-Gahtani
- 6. Solution A C D B E F 1 2 3 4 5 6 7 8 9 10 11 12 13 14 15 16 17 18 Spring 2008, Bar Chart 6 King Saud University Dr. Khalid Al-Gahtani
- 7. Alternative Solution A B C D E F 1 2 3 4 5 6 7 8 9 10 11 12 13 14 15 16 17 18 Spring 2008, Bar Chart 7 King Saud University Dr. Khalid Al-Gahtani
- 8. Bar Chart • Advantages of Bar Chart – Very Graphical – Easy to understand – Most widely used • Disadvantages of Bar Chart – Difficult to Update – Difficult to find the Critical Path – Difficult to setup and maintain a large project because it is essentially a manual graphical procedure. Spring 2008, Bar Chart 8 King Saud University Dr. Khalid Al-Gahtani
- 9. How to identify the Critical path in a Bar Chart • Types of a Project Activity – Critical Activity: if it is delayed, it will delay the project. – Noncritical Activity: it may not delay the project if it’s well managed. Spring 2008, Bar Chart 9 King Saud University Dr. Khalid Al-Gahtani
- 10. STEPS to identify the Critical Path • Start with the last Activity; Draw a vertical line from the i Node of late Activity. i j • The activities whose j nodes touch the vertical line, are Potential Critical Activity. • Draw a vertical line from the i node of the new critical activity. • Proceed in this manner until you reach Day 0. Spring 2008, Bar Chart 10 King Saud University Dr. Khalid Al-Gahtani
- 11. Identify the Critical Path A B C D E F 1 2 3 4 5 6 7 8 9 10 11 12 13 14 15 16 17 18 Spring 2008, Bar Chart 11 King Saud University Dr. Khalid Al-Gahtani
- 12. Class Work Activity Depends upon Duration (Weeks) A C, J 3 B F 2 C F 3 D C, I 4 E G 5 F H 4 G H 2 H - 3 I E, F 4 J B 2 Spring 2008, Bar Chart 12 King Saud University Dr. Khalid Al-Gahtani
- 13. CW Solution Act. W1 W2 W3 W4 W5 W6 W7 W8 W9 W10 W11 W12 W13 W14 W15 W16 W17 W18 H F G E I B C J A D Spring 2008, Bar Chart 13 King Saud University Dr. Khalid Al-Gahtani