Poster Presentation: A Study on primary Students' errors on Column Graph
•Transferir como PPTX, PDF•
2 gostaram•702 visualizações

Poster presented at 67th Annual Sessions at Sri Lanka Association for the Advancement of Science
Recomendados

Recomendados
Mais conteúdo relacionado
Mais de The Open University of Sri Lanka
Mais de The Open University of Sri Lanka (11)
Último
Último (20)
Poster Presentation: A Study on primary Students' errors on Column Graph
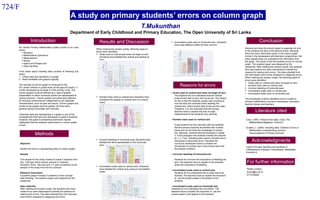
- 1. 724/F A study on primary students’ errors on column graph T.Mukunthan Department of Early Childhood and Primary Education, The Open University of Sri Lanka Introduction Results and Discussion Inconsistent scale used on horizontal axis. (Students Conclusion have used different widths for their column). Sri Lankan Primary Mathematics syllabi consist of six main Interpret and draw the column graph is essential not only topics: When marking the answer scripts, following types of errors were identified: to the students but also to the general public. Because Numbers there are many information given in the column graph Mathematical Operations Scale used on vertical axis does not begin at zero (Students have labelled the vertical axis starting at format in the newspapers and television programmes. But Measurement many people does not understand the information from Money one) the graph. This study is find the students errors on column Space and Shapes and graph. The question paper was designed by the Data Handling. researcher. After marking the answer scripts, the students who had made errors were interviewed to identify the From these topics handling data consists of following sub . reasons for making such errors. The data collected from topics: the interviewee were further analysed to categorise errors. 1. Collect data and represent in a graph When marking the answer scripts, the following types of 2. Read timetables and graphs logically. errors were identified: Scale used on vertical axis does not begin at zero The concept of column graph is introduced to the Sri Lankan children in grade three (at the age of 8 years). It Reasons for errors Number track used on vertical axis Incorrect labelling of horizontal axes is then developed up to grade 5 in the primary circle. The Inconsistent scale used on vertical axis column graphs could be defined as a ‘type of graphic Scale used on vertical axis does not begin at zero Inconsistent scale used on horizontal axis. presentation in which numerical values are represented by The students did not understand that the vertical vertical columns’. Column graphs are particularly effective Number track used on vertical axis (Students have scale should start at zero and not at one. The reason The knowledge of above identified errors is useful to for showing values that are categorized by two separate numbered the spaces on vertical axis of a column for this is that the students usually start counting at primary mathematics curriculum developers, educators, characteristics, such as year and sector. Column graphs are chart). one and they are confused when labelling the teacher trainers and teachers. similar to bar graphs and line graphs. All three have vertical axis, which should start at zero as the origin. gridlines going horizontally and vertically. Therefore, it is very important that the primary teachers have to explain the axis of scale Literature cited Collecting data and representing in a graph is one of the measurement to the students very carefully. competencies that has to be developed in grade 5 students. However, the grade 5 scholarship examiners’ reports Number track used on vertical axis Circa, (1997). Pictures from data. Circa: The highlighted that the students’ performance in column graph Mathematical Magazine. Volume 6. is poor. It was evident from the interview with the students that the primary students are familiar with number Surtees, L. (2009). Handling data, Children’s Errors in tracks and do not have the knowledge of number Mathematics understanding common Methods line. Because, students learned pictogram in grade 3. In the pictogram the students marked the pictures misconceptions in Primary Schools as 1. 2. 3 etc. indicating each picture. Number line is Incorrect labelling of horizontal axes (Students have labelled the items represented on the horizontal introduced in secondary level. Therefore the Acknowledgments Objective curriculum developers have to consider the axis). introduction of number line in the primary level with I thank Principal, teachers and students of Identify the errors in representing data on column graph. the positive numbers. C/Ramakrisna Vidyalam, Pamankadai, Wellawatte, Colombo-6 Sample Incorrect labelling of horizontal axis The sample for the study consist of Grade 5 students from Students do not know the importance of labelling the four 1 AB type Tamil medium schools in Colombo Education Zone. 108 boys and 117 girls considered as the axis. The teachers have to explain to the students about the importance of labelling. For further information Inconsistent scale used on vertical axis. (Students sample of this study from the four schools. have labelled the vertical axis using an inconsistent Please contact: Inconsistent scale used on vertical axis scale). tmuku@ou.ac.lk Research Instrument Students do not understand how a scale has to be A question paper included 5 problems on the concept decided. The teachers have to explain the important 0773732652 data handling. The question paper was designed by the of use the proper scales in the graphs to the researcher. students. Data collection Inconsistent scale used on horizontal axis After marking the answer scripts, the students who have Students do not understand the convention. The made errors were interviewed to identify the reasons for teachers have to explain the important of use the making such errors. The data collected from the interview proper scales in the graphs to the students. were further analysed to categorise the errors.
Notas do Editor
- This poster template is from http://www.swarthmore.edu/NatSci/cpurrin1/posteradvice.htm. It is free, free, free for non-commercial use. If you really like it, I’m always thrilled to get postcards from wherever you happen to be presenting your poster. -- Colin Purrington, Department of Biology, Swarthmore College, Swarthmore, PA 19081, USA. cpurrin1@swarthmore.edu