Heart
•Transferir como XLS, PDF•
0 gostou•335 visualizações

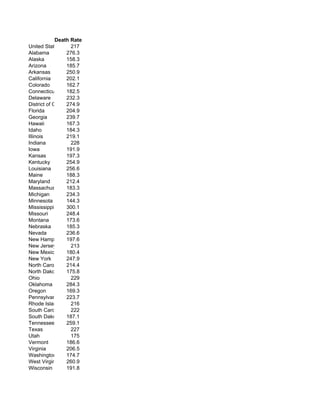
This document lists age-adjusted death rates per 100,000 population for various causes of death in the United States and its territories for 2004. The rates are highest in Mississippi at 300.1, Alabama at 276.3, and Oklahoma at 284.3. They are lowest in Minnesota at 144.3, Utah at 175, and Vermont at 186.6. The data comes from the Centers for Disease Control and Prevention's National Center for Health Statistics and is used to compare death rates between areas while controlling for differences in population composition.

Recomendados
Mais conteúdo relacionado
Mais de Tom Loughran
Mais de Tom Loughran (20)
Último
Último (20)
Heart
- 1. Death Rate United States 217 Alabama 276.3 Alaska 158.3 Arizona 185.7 Arkansas 250.9 California 202.1 Colorado 162.7 Connecticut 182.5 Delaware 232.3 District of Columbia 274.9 Florida 204.9 Georgia 239.7 Hawaii 167.3 Idaho 184.3 Illinois 219.1 Indiana 228 Iowa 191.9 Kansas 197.3 Kentucky 254.9 Louisiana 256.6 Maine 188.3 Maryland 212.4 Massachusetts 183.3 Michigan 234.3 Minnesota 144.3 Mississippi 300.1 Missouri 248.4 Montana 173.6 Nebraska 185.3 Nevada 236.6 New Hampshire 197.6 New Jersey 213 New Mexico 180.4 New York 247.9 North Carolina 214.4 North Dakota 175.8 Ohio 229 Oklahoma 284.3 Oregon 169.3 Pennsylvania 223.7 Rhode Island 216 South Carolina 222 South Dakota 187.1 Tennessee 259.1 Texas 227 Utah 175 Vermont 186.6 Virginia 206.5 Washington 174.7 West Virginia 260.9 Wisconsin 191.8
- 2. Wyoming 191 Guam 235.7 Puerto Rico 164.4 Virgin Islands 199.2 NOTES Age-adjusted rates per 100,000 U.S. standard population. Populations used for computing death rates are postcens DEFINITIONS Causes of death attributable to heart disease mortality include ICD-10 Codes I00-I09; I11;I13;I19-I51. DATASOURCES The Centers for Disease Control and Prevention (CDC), National Center for Health Statistics, Division of Vital Statis
- 4. ng death rates are postcensal estimates based on the 2000 census. Since death rates are affected by the population composition of a given stics, Division of Vital Statistics, National Vital Statistics Report Volume 55, Number 19, August 21, 2007, Table 29. Available at <a href=quot;htt
- 6. tion composition of a given area, age-adjusted death rates sh be used for comparisons between areas because they control for differences ould 9. Available at <a href=quot;http://www.cdc.gov/nchs/data/ nvsr/nvsr55/nvsr55_19.pdfquot; target=quot;_blankquot;>http://www.cdc.gov/nchs/data/nvsr/nvsr55/nv
- 8. they control for differences in population composition. Data are for 2004. ov/nchs/data/nvsr/nvsr55/nvsr55_19.pdf</a>.