SlideShare uma empresa Scribd logo
1 de 63
Baixar para ler offline
INDONESIA                                                                                                                                               Indonesia
                                                                                                                                                                                                     Indonesia
                                                                                                                                                                                                     Indonesia
        DEMOGRAPHICS
       DEMOGRAPHICS
       DEMOGRAPHICS
       DEMOGRAPHICS
       DEMOGRAPHICS
       DEMOGRAPHICS                                                                    Under-five mortality rate                                                             Causes of under-five deaths, 2004
                                                                                                                                                                             Causes of under-five deaths, 2004
  Total population (000)
 Total population (000)                                  227,345
                                                     227,345            (2008)
                                                                        (2008)
                                                                                       Deaths per 1,000 live births
                                                                                       Under-five mortality rate
                                                                                       Under-five mortality rate                                                             Causes of under-five deaths, 2004
                                                                                                                                                                             Causes of under-five deaths, 2004 Others
 Total population (000)
  Total population (000)                            227,345
                                                     227,345            (2008)
                                                                          (2008)        Under-five mortality rate                                                                                      Others 11%
                                                                                                                                                                              Causes of under-five deaths, 2004
                                                                                                                                                                              Malaria of
  Total under-five population (000)
 Total under-five population (000)
  Total population (000)
 Total population (000)                              20,89120,891
                                                     227,345
                                                    227,345
                                                                        (2008)
                                                                        (2008)
                                                                           (2008)
                                                                         (2008)
                                                                                       Under-five1,000 live births
                                                                                       Deaths per mortality rate
                                                                                       Deaths per 1,000 live births                                                          Causes 1% under-five deaths, 2004
                                                                                                                                                                               Malaria                            11%
                                                                                         120
                                                                                        Deaths per 1,000 live births                                                           1%                                         Others 11%
                                                                                                                                                                                                                          Others 11%
 Total under-five population (000)
  Total under-five population (000)                  20,891
                                                      20,891            (2008)
                                                                          (2008)       Deaths per 1,000 live births
  Total number ofpopulation (000)
                    births (000)
 Total number of births (000)(000)                     4,2204,220       (2008)
                                                                        (2008)           120
                                                                                          120                                                                                     Malaria 1%
                                                                                                                                                                                   Malaria 1%                              Others 11%
                                                                                                                                                                                                                          Others 11%
  Total under-five
 Total under-five population                           20,891
                                                      20,891               (2008)
                                                                         (2008)                                                                                                     Malaria 1%
                                                                                                                                                                                 Pneumonia
                                                                                                                                                                               Pneumonia
                                                                                                                                                                                  Malaria 1%
                                                                                          120
                                                                                         120
 Total number of births (000)
  Total number of births (000)                         4,220
                                                        4,220           (2008)
                                                                          (2008)                 86                                                                            8% 8%
  Under-five mortality rate (per 1,000 live births) 4,220 41
 Under-five mortality rate (per 1,000 live births)
  Total number of births (000)                            41            (2008)
                                                                        (2008)
                                                                           (2008)                                                                                                Pneumonia
                                                                                                                                                                                   Pneumonia                                                Neonatal
 Total number of births (000)                          4,220             (2008)           80                                                                                       Pneumonia                 Globally,
                                                                                              86
                                                                                               86                                                                                Pneumonia
                                                                                                                                                                                      8%
                                                                                                                                                                                       8%                   Globally,                         41%
                                                                                                                                                                                                                                            Neonatal
                                                                                                                                                                                                                                            Neonatal
 Under-five mortality rate (per 1,000 live births)
  Under-five mortality rate (per 1,000 live births)       4141          (2008)
                                                                          (2008)                                                                                                                            more than
 Total number ofof under-five 1,000 live births)
 Under-five mortality rate (per deaths live births)
  Total number under-five(per 1,000 (000)
  Under-five mortality rate deaths (000)                 173 173
                                                            41
                                                           41           (2008)
                                                                        (2008)
                                                                           (2008)
                                                                         (2008)            80 86
                                                                                          80 86                                                                                 Injuries 17%
                                                                                                                                                                                       8%
                                                                                                                                                                                      8%                     Globally,
                                                                                                                                                                                                              Globally,
                                                                                                                                                                                                       undernutrition                        Neonatal
                                                                                                                                                                                                                                            Neonatal
                                                                                                                                                                                                                                              41%
                                                                                                                                                                                                                                               41%
                                                                                           80                                                                                  Injuries                   oneGlobally,
                                                                                                                                                                                                               third of
                                                                                          80                                                                                    Injuries 17%
                                                                                                                                                                                 Injuries 17%               more than
                                                                                                                                                                                                             more than
                                                                                                                                                                                                             Globally,
                                                                                                                                                                                                     contributesthanmore                       41%
 Total number of under-five deaths (000)
  Total number of under-five deaths (000)                 173
                                                           173          (2008)
                                                                          (2008)                                                                 41                            17%                      childmore toare
                                                                                                                                                                                                          onedeathsof
                                                                                                                                                                                                            onethird of
                                                                                                                                                                                                                third
                                                                                                                                                                                                                                              41%
 Total mortality under-five deathslive births)
  Infantnumber of under-five 1,000 (000)
   Total mortality rate (per deaths births)
 Infantnumber of rate (per 1,000 live (000)               173 31
                                                           31
                                                           173          (2008)
                                                                        (2008)
                                                                           (2008)                                                                                               Injuries 17%
                                                                                                                                                                                  Injuries17%               more thanto
                                                                                                                                                                                                         attributable are
                                                                         (2008)           40                                                                       29                                 thanonedeathsof of
                                                                                                                                                                                                             one third
                                                                                                                                                                                                           one third
                                                                                                                                                                                                        child deaths are
                                                                                                                                                                                                         child third of
 Infant mortality rate (per 1,000 live births)
  Infant mortality rate (per 1,000 live births)            31
                                                            31          (2008)
                                                                          (2008)                                                                 41
                                                                                                                                                  41                                                     undernutrition
                                                                                                                                                  41                                                     childdeathsto
                                                                                                                                                                                                          child deaths
                                                                                                                                                                                                          attributable are
                                                                                                                                                                                                         attributable to
                                                                                                                                                                                                        child deaths are
 Neonatal mortality rate (per 1,000 live births)
 Infant mortality rate (per 1,000 1,000 births)
  Neonatal mortality rate 1,000live births)births)
   Infant mortality rate (per (per live live               17 17
                                                             31
                                                            31          (2004)
                                                                        (2004)
                                                                           (2008)
                                                                         (2008)           40
                                                                                           40                                                    41                29
                                                                                                                                                                    29
                                                                                           40                                                                                    Measles 9%              undernutritionto
                                                                                                                                                                                                           attributable
                                                                                                                                                                                                          undernutrition
                                                                                                                                                                                                         attributable to                    Neonatal
                                                                                          40                                                                    MDG 29
                                                                                                                                                                   29
 Neonatal mortality rate (per 1,000 live births)
  Neonatal mortality rate (per 1,000 live births)          17
                                                            17          (2004)
                                                                          (2004)                                                                                                                           undernutrition
                                                                                                                                                                                                         undernutrition                         41%
 HIV prevalence raterate(15–491,000live births)                                                                                                                                 Measles 9%
                                                                                                                                                                                 Measles 9%
 Neonatal mortality (15-49 years,
  HIV prevalence rate (per 1,000%)live births)
   Neonatal mortality rate (per years, %)                 0.2 0.2
                                                             17
                                                            17          (2007)
                                                                        (2007)
                                                                           (2004)
                                                                         (2004)                                                                                Target
                                                                                                                                                                               Measles 9%
                                                                                           0                                                                    MDG
                                                                                                                                                                 MDG            Measles 9%
                                                                                                                                                                                 Measles
                                                                                                                                                                                     Diarrhoea
 HIV prevalence rate (15-49 years, %)
  HIV prevalence rate (15-49 years, %)                    0.2
                                                           0.2          (2007)
                                                                          (2007)                                                                                 MDG
                                                                                                                                                               Target
                                                                                                                                                                Target
                                                                                                                                                                MDG            9%                                                 HIV/AIDS 0%
 Population belowrate (15-49 years, %)
   HIV prevalence international                             0.2            (2007)           1990
                                                                                           00          1995              2000            2005          2010         2015                13%
                                                                                                                                                                                     Diarrhoea
                                                                                                                                                                                      Diarrhoea
 HIV prevalence rate (15-49 years, %)
  Population below international                           0.2-          (2007) -                                                                               Target
                                                                                                                                                               Target                                                                     Diarrhoea
 poverty linebelow international (%)
  Population ofof US$1.25 per day
                  US$1.25 per day
 Population below international (%)                               -            -           00                                                                                         Diarrhoea
                                                                                                                                                                                     Diarrhoea
                                                                                                                                                                                        13%
                                                                                                                                                                                         13%                                      HIV/AIDS 0%
                                                                                                                                                                                                                                   HIV/AIDS 0%
  poverty line                                                                              1990
                                                                                             1990      1995
                                                                                                        1995             2000
                                                                                                                          2000           2005
                                                                                                                                          2005         2010
                                                                                                                                                        2010       2015
                                                                                                                                                                    2015
                                                              --                --     Source: IGME 2009                                                                     Source: WHO 2008                                      HIV/AIDS 0% 13%
  poverty linebelow international
   Population of US$1.25 per day
 poverty linebelow international (%)
 Population of US$1.25 per day (%)
                                                              - -               --
                                                                                             1990
                                                                                            1990        1995
                                                                                                       1995               2000
                                                                                                                         2000             2005
                                                                                                                                         2005           2010
                                                                                                                                                       2010         2015
                                                                                                                                                                   2015                  13%
                                                                                                                                                                                        13%
                                                                                                                                                                             Source: WHO 2008                                     HIV/AIDS 0%
   povertyline of US$1.25 per day (%)
 poverty    line of US$1.25 per day (%)                                                Source: IGME 2009
                                                                                        Source: IGME 2009                                                                    Source: WHO 2008
                                                                                                                                                                              Source: WHO 2008
                                                                                        Source: IGME 2009
                                                                                       Source: IGME 2009                                                                      Source: WHO 2008
                                                                                                                                                                             Source:   WHO 2008
    NUTRITIONAL STATUS
      NUTRITIONAL STATUS
    NUTRITIONAL STATUS
    NUTRITIONAL STATUS
Burden of undernutritionSTATUS
     NUTRITIONAL (2008)
    NUTRITIONAL STATUS                                                         Stunted (under-fives, 000):                                                     7,688  Underweight (under-fives, 000):                                           3,844 
Burden of undernutrition (2008)
WHO Child Growth Standards (2008)                            Stunted (under-fives, 000):                                                               7,688   Underweight (under-fives, 000):                                                  3,844
Burden of undernutrition (2008)
Burden of undernutrition
WHO	Child	Growth	Standards                                                     Share of(under-fives,world stunting burden (%):
                                                                               Stunted developing 000):
                                                                                Stunted (under-fives, 000):                                                    7,688  Wasted (under-fives, 000): 000):
                                                                                                                                                                7,688  Underweight (under-fives, 000):
                                                                                                                                                                  3.9  Underweight (under-fives,                                                3,844 
                                                                                                                                                                                                                                                 3,844 
                                                                                                                                                                                                                                                2,841 
Burden of Growth Standards (2008)
 Burden of undernutrition
WHO Child Growth Standards (2008)
WHO Child undernutrition                                     Share of developing worldcountry rank: 000):stuntingburden (%):
                                                                               Stunted (under-fives,000):
                                                                                Stunted stunting
                                                                               Share of (under-fives, world (%):                                               7,688  Wasted (under-fives, 000): 000):
                                                                                                                                                                7,688  Underweight 000):
                                                                                                                                                                        Underweight (under-fives,
                                                                                                                                                               Wasted (under-fives, (under-fives, 000):                                           3,844 
                                                                                                                                                                                                                                                3,844 
 WHO Child Growth Standards
WHO Child Growth Standards                                                     Stunting developingburdenstunting burden (%):
                                                                                Share of developingworld                                                 3.9      3.9  Severely (under-fives, 000): 000):
                                                                                                                                                                   3.9  Wasted wasted (under-fives,
                                                                                                                                                                    5                                                                           2,841
                                                                                                                                                                                                                                                2,841 
                                                                                                                                                                                                                                                 2,841 
                                                                                                                                                                                                                                                1,295 
                                                                                Share of developing world stunting burden (%):
                                                                               Share of developing world stunting burden (%):                                      3.9  Wasted (under-fives, 000):
                                                                                                                                                                  3.9  Wasted (under-fives, 000):                                                 2,841 
                                                                                                                                                                                                                                                2,841 
                                                             Stunting country rank:
                                                                               Stunting country rank:
                                                                                Stunting country rank:                                                    5    SeverelySeverely wasted (under-fives, 000):
                                                                                                                                                                        wasted (under-fives, 000): 000):
                                                                                                                                                                    5  Severely wasted (under-fives,
                                                                                                                                                                     5                                                                          1,295
                                                                                                                                                                                                                                                1,295 
                                                                                                                                                                                                                                                 1,295 
                                                                                Stunting country rank:
                                                                               Stunting country rank:                                                                5  Severely wasted (under-fives, 000):
                                                                                                                                                                    5  Severely wasted (under-fives, 000):                                        1,295 
                                                                                                                                                                                                                                                1,295 
Current nutritional status                                                                 Stunting trends                                                                   Underweight trends
Percentage of children status old suffering from:
Current nutritional < 5 years
Current nutritional status                                                                 Percentagetrends
                                                                                           Stunting trends
                                                                                           Stunting of children < 5 years old stunted                                        Underweight trends
                                                                                                                                                                             Underweight trends
                                                                                                                                                                             Percentage of children < 5 years old
Percentage of children status
 Current nutritional < 5 years
Percentage of children status old suffering from:
Current nutritional < 5 years old suffering from:                                          Percentage trends
                                                                                            Stunting of children < 5
                                                                                           Percentagetrends
                                                                                           Stunting of children < 5 years old stunted
                                                                                           NCHS reference populationyearsold stunted                                          Underweight trends
                                                                                                                                                                             Underweightchildren < Growth Standards
                                                                                                                                                                             Percentage of trends
                                                                                                                                                                             underweight, WHO Child5 years old
                                                                                                                                                                             Percentage of children < 5 years old
Percentage of children < 55years old suffering from:
 Percentage of children < years old suffering from:
                        37                                                                 NCHS reference population yearsold stunted
                                                                                           Percentage of children < 55years old stunted
                                                                                            Percentage of children <
                                                                                           NCHS reference population
                                                                                            100%                                                                             On track towards MDG1 < 5Growthold
                                                                                                                                                                             Percentage of WHO Child 5years Standards
                                                                                                                                                                             underweight, children < years Standards
                                                                                                                                                                              Percentage of children
                                                                                                                                                                             underweight, WHO Child Growthold
    Stunting                                                                                NCHS reference population
                                                                                           NCHS reference population                                                          underweight, WHO Child Growth Standards
                                                                                                                                                                             underweight, WHO Child Growth Standards
                                 37
                                  37                                                           100%
                                                                                                100%                                                                         On track towards MDG1
                                                                                                                                                                             On %
                                                                                                                                                                              100 track towards MDG1
    Stunting
     Stunting                     37
                                 37                                                             80
                                                                                                100%
                                                                                               100%                                                                           On track towards MDG1
                                                                                                                                                                             On track towards MDG1
     Stunting
    Stunting                                                                                                                                                                  100%
                                                                                                                                                                               100%
                                                                                                80
                                                                                                 80                                                                            80
                                                                                                                                                                               100%
                     18                                                                                                                                                       100%
                                                                                                60
                                                                                                 80
                                                                                                80                                                                             80
                                                                                                                                                                                80
 Underweight                                                                                                                                                                   60
                     18
                      18                                                                        60
                                                                                                 60                                                                              80
                                                                                                                                                                                80
 Underweight
  Underweight         18
                     18                                                                         40
                                                                                                 60                                                                            60
                                                                                                                                                                                60
  Underweight                                                                                   60                                                                             40
 Underweight                                                                                                                        42                                           60
                                                                                                                                                                                60
                    14                 WHO Child Growth Standards                               40
                                                                                                 40
     Wasting                                                                                    20
                                                                                                 40
                                                                                                40                                  42
                                                                                                                                     42                                        40
                                                                                                                                                                                40
                                                                                                                                                                               2040
                    14
                     14                NCHSChild Growth Standards
                                       WHO reference population
                                       WHO Child Growth Standards                                                                    42
                                                                                                                                    42                                          40          27          23           18
     Wasting
     Wasting         14                 WHO Child Growth Standards                              20
                                                                                                 20                                                                            20
                                                                                                                                                                                20
                    14                 NCHSChild Growth Standards
                                       WHO reference population
                                       NCHS reference population                                 0
                                                                                                 20                                                                              0          27
                                                                                                                                                                                             27
      Wasting
     Wasting                                                                                    20                                                                               20
                                                                                                                                                                                20                      23
                                                                                                                                                                                                         23          18
                                                                                                                                                                                                                      18
                                        NCHS reference population
                                       NCHS reference population                                                                                                                             27
                                                                                                                                                                                            27           23
                                                                                                                                                                                                        23            18
                                                                                                                                                                                                                     18
                0         20           40        60        80      100%                          00                                1995                                          00       1995        2003         2007
           00        20
                      20               40
                                        40          60
                                                     60           80
                                                                   80          100%
                                                                                100%             00                                MICS
                                                                                                                                   1995
                                                                                                                                    1995                                         00      Other NS
                                                                                                                                                                                          1995
                                                                                                                                                                                           1995      Other NS
                                                                                                                                                                                                      2003
                                                                                                                                                                                                       2003       Other NS
                                                                                                                                                                                                                   2007
                                                                                                                                                                                                                    2007
Source: Other NS 200720
           00          20               40
                                       40            60
                                                    60             80
                                                                  80            100%
                                                                               100%                                                 1995
                                                                                                                                   1995                                                    1995
                                                                                                                                                                                          1995         2003
                                                                                                                                                                                                      2003          2007
                                                                                                                                                                                                                   2007
                                                                                                                                   MICS
                                                                                                                                    MICS                                                 Other NS
                                                                                                                                                                                          Other NS   Other NS
                                                                                                                                                                                                      Other NS    Other NS
                                                                                                                                                                                                                   Other NS
Source: Other NS 2007
 Source: Other NS 2007                                                                                                               MICS
                                                                                                                                   MICS                                                   Other NS
                                                                                                                                                                                         Other NS     Other NS
                                                                                                                                                                                                     Other NS      Other NS
                                                                                                                                                                                                                  Other NS
 Source: Other NS 2007
Source: Other NS 2007
     INFANT AND YOUNG CHILD FEEDING
     INFANT AND YOUNG CHILD FEEDING
      INFANT AND YOUNG CHILD FEEDING
      INFANT AND YOUNG CHILD FEEDING
     INFANT AND YOUNG CHILD FEEDING
Infant feeding practices,YOUNG CHILD FEEDING
        INFANT AND by age
Infant feeding practices, by age
 Infant feeding practices, by age
 Infant feeding practices, by age
Infant feeding practices, by age
   100%                                                                                                                                                                       Weaned (not breastfed)                  Breastfed and
  100%
   100%                                                                                                                                                                                                               non-milk liquids
                                                                                                                                                                              Weaned (not breastfed)
                                                                                                                                                                               Weaned (not breastfed)                 Breastfed and
                                                                                                                                                                                                                       Breastfed and
   100%
   90
  100%                                                                                                                                                                        Breastfed (not breastfed)
                                                                                                                                                                               Weaned and solid/                       Breastfed and
                                                                                                                                                                              Weaned (not breastfed)
                                                                                                                                                                              semi-solid foods                        Breastfedliquids
                                                                                                                                                                                                                      non-milk liquids
                                                                                                                                                                                                                       non-milk and plain
   90
    90                                                                                                                                                                        Breastfed and solid/
                                                                                                                                                                               Breastfed and solid/                   water onlyliquids
                                                                                                                                                                                                                       non-milk
                                                                                                                                                                                                                      non-milk liquids
                                                                                                                                                                               Breastfed and solid/
                                                                                                                                                                              semi-solid and solid/                   Breastfed and plain
                                                                                                                                                                                                                       Breastfed and plain
    90
   80
   90                                                                                                                                                                         Breastfed foods
                                                                                                                                                                               semi-solid foods
                                                                                                                                                                              Breastfed and other
                                                                                                                                                                               semi-solid foods                       Exclusively andplain
                                                                                                                                                                                                                      water onlyand plain
                                                                                                                                                                                                                       Breastfed
                                                                                                                                                                                                                       water only
                                                                                                                                                                                                                      Breastfed breastfed
                                                                                                                                                                              semi-solid foods                         water only
   80
    80                                                                                                                                                                        milk/formula                            water only breastfed
    80                                                                                                                                                                        Breastfed and other
                                                                                                                                                                               Breastfed and other                    Exclusively breastfed
                                                                                                                                                                                                                       Exclusively
   70
   80
                                                                                                                                                                              Breastfed and other
                                                                                                                                                                               Breastfed and
                                                                                                                                                                              milk/formula other
                                                                                                                                                                               milk/formula                            Exclusively breastfed
                                                                                                                                                                                                                      Exclusively breastfed
   70
    70                                                                                                                                                                         milk/formula
                                                                                                                                                                              milk/formula
    70
   60
                                                                                                                                                                              Exclusive breastfeeding
   70
   60
    60
                                                                                                                                                                              Exclusive breastfeeding
                                                                                                                                                                              Exclusive breastfeeding
                                                                                                                                                                              Percentage of infants < 6 months old exclusively
    60
   50
   60                                                                                                                                                                         Percentage breastfeeding
                                                                                                                                                                               Exclusive
                                                                                                                                                                              Percentage breastfeeding
                                                                                                                                                                              Exclusive of infants < 6 months old exclusively
                                                                                                                                                                              breastfed of infants < 6 months old exclusively
                                                                                                                                                                              breastfed of infants < 66months old exclusively
                                                                                                                                                                              Percentage of infants < months old exclusively
                                                                                                                                                                               Percentage
                                                                                                                                                                              breastfed
   50
    50                                                                                                                                                                        100%
                                                                                                                                                                               breastfed
    50
   40                                                                                                                                                                         breastfed
   50
                                                                                                                                                                              100%
                                                                                                                                                                               100%
   40
    40                                                                                                                                                                         80
                                                                                                                                                                               100%
                                                                                                                                                                              100%
    40
   30
   40                                                                                                                                                                          80
                                                                                                                                                                                80
                                                                                                                                                                               6080
   30
    30                                                                                                                                                                          80
                                                                                                                                                                                     63
    30
   20
   30                                                                                                                                                                          60
                                                                                                                                                                                60
                                                                                                                                                                               4060  63
                                                                                                                                                                                      63
                                                                                                                                                                                60                45
   20
    20                                                                                                                                                                         40
                                                                                                                                                                                40    63
                                                                                                                                                                                     63                       37          42        40
    20
   10
   20                                                                                                                                                                          2040               45
                                                                                                                                                                                                   45                                          32
                                                                                                                                                                                40
                                                                                                                                                                                                              37
                                                                                                                                                                                                               37         42
                                                                                                                                                                                                                           42       40
                                                                                                                                                                                                                                     40
    10
     10                                                                                                                                                                        20
                                                                                                                                                                                20                 45
                                                                                                                                                                                                  45                       42
                                                                                                                                                                                                                          42                   32
                                                                                                                                                                                                                                                32
                                                                                                                                                                                 0                             37
                                                                                                                                                                                                              37                     40
                                                                                                                                                                                                                                    40
     10
     0
    10                                                                                                                                                                           20
                                                                                                                                                                                20                                                              32
                                                                                                                                                                                                                                               32
    000-1     2-3               4-5          6-7           8-9            10-11       12-13            14-15    16-17           18-19       20-21         22-23                  00 1987         1991         1994       1997      2002-       2007
    000-1                                                                                                                                                                        00 1987
                                                                                                                                                                                    DHS
                                                                                                                                                                                     1987        DHS
                                                                                                                                                                                                 1991
                                                                                                                                                                                                  1991        DHS
                                                                                                                                                                                                              1994
                                                                                                                                                                                                               1994      DHS
                                                                                                                                                                                                                         1997
                                                                                                                                                                                                                          1997     2003
                                                                                                                                                                                                                                   2002-
                                                                                                                                                                                                                                    2002-      DHS
                                                                                                                                                                                                                                               2007
                                                                                                                                                                                                                                                2007
      0-1     2-3
               2-3              4-5
                                 4-5         6-7
                                              6-7          8-9
                                                            8-9           10-11 (months)
                                                                              age
                                                                           10-11      12-13
                                                                                       12-13           14-15
                                                                                                        14-15   16-17
                                                                                                                 16-17          18-19
                                                                                                                                 18-19      20-21
                                                                                                                                             20-21        22-23
                                                                                                                                                           22-23
       0-1      2-3              4-5          6-7           8-9            10-11 (months)
                                                                                       12-13            14-15    16-17           18-19       20-21         22-23                     1987
                                                                                                                                                                                    1987
                                                                                                                                                                                    DHS
                                                                                                                                                                                     DHS          1991
                                                                                                                                                                                                 1991
                                                                                                                                                                                                 DHS
                                                                                                                                                                                                  DHS          1994
                                                                                                                                                                                                              1994
                                                                                                                                                                                                              DHS
                                                                                                                                                                                                               DHS        1997
                                                                                                                                                                                                                         1997
                                                                                                                                                                                                                         DHS
                                                                                                                                                                                                                          DHS       2002-
                                                                                                                                                                                                                                   2002-
                                                                                                                                                                                                                                    DHS
                                                                                                                                                                                                                                   2003
                                                                                                                                                                                                                                    2003        2007
                                                                                                                                                                                                                                               2007
                                                                                                                                                                                                                                               DHS
                                                                                                                                                                                                                                                DHS
      0-1      2-3
Source: DHS 2007                4-5          6-7           8-9            10-11 (months)
                                                                              age
                                                                               age    12-13            14-15    16-17           18-19       20-21         22-23
                                                                               age (months)                                                                                           DHS
                                                                                                                                                                                     DHS           DHS
                                                                                                                                                                                                  DHS           DHS
                                                                                                                                                                                                               DHS         DHS
                                                                                                                                                                                                                          DHS        2003
                                                                                                                                                                                                                                   2003
                                                                                                                                                                                                                                    DHS
                                                                                                                                                                                                                                     DHS         DHS
                                                                                                                                                                                                                                                DHS
                                                                              age (months)
Source: DHS 2007
Source: DHS 2007                                                                                                                                                                                                                     DHS
                                                                                                                                                                                                                                    DHS
 Source: DHS 2007
Source: DHS 2007


The Nutrition of Women and Children
 The Nutrition of Women and Children
The Nutrition of Women and Children
  58 Tracking Progress on Child and Maternal Nutrition
Utensil Dispensers Dixie

Mais conteúdo relacionado

Destaque

The accidental ecowas citizen for27march2012-22
The accidental ecowas citizen for27march2012-22The accidental ecowas citizen for27march2012-22
The accidental ecowas citizen for27march2012-22Emmanuel K Bensah Jr
 
Data Management Services
Data Management ServicesData Management Services
Data Management Servicescrr99999
 
Perks cards
Perks cards Perks cards
Perks cards PerksCard
 
CCIMTECH Partner Products
CCIMTECH Partner ProductsCCIMTECH Partner Products
CCIMTECH Partner ProductsCCIMTECH
 
Parliamentary elections in St. Petersburg, December 4, 2012
Parliamentary elections in St. Petersburg, December 4, 2012Parliamentary elections in St. Petersburg, December 4, 2012
Parliamentary elections in St. Petersburg, December 4, 2012vveshka
 
Growing Older with HIV in Scotland
Growing Older with HIV in ScotlandGrowing Older with HIV in Scotland
Growing Older with HIV in ScotlandWaverley Care
 
Legislative Calendar Weekending 052909
Legislative Calendar Weekending 052909Legislative Calendar Weekending 052909
Legislative Calendar Weekending 052909Genevieve Whitaker
 
Arkstore web ready2013
Arkstore web ready2013Arkstore web ready2013
Arkstore web ready2013coldsnipe
 

Destaque (14)

The accidental ecowas citizen for27march2012-22
The accidental ecowas citizen for27march2012-22The accidental ecowas citizen for27march2012-22
The accidental ecowas citizen for27march2012-22
 
Data Management Services
Data Management ServicesData Management Services
Data Management Services
 
Odessa
OdessaOdessa
Odessa
 
Perks cards
Perks cards Perks cards
Perks cards
 
Meeting Osterhofen
Meeting OsterhofenMeeting Osterhofen
Meeting Osterhofen
 
Crickertainment
CrickertainmentCrickertainment
Crickertainment
 
Marketing on a shoestring
Marketing on a shoestringMarketing on a shoestring
Marketing on a shoestring
 
CCIMTECH Partner Products
CCIMTECH Partner ProductsCCIMTECH Partner Products
CCIMTECH Partner Products
 
Parliamentary elections in St. Petersburg, December 4, 2012
Parliamentary elections in St. Petersburg, December 4, 2012Parliamentary elections in St. Petersburg, December 4, 2012
Parliamentary elections in St. Petersburg, December 4, 2012
 
Rhondak Stories Behind My Signs Part Ii November 2008
Rhondak Stories Behind My Signs Part Ii November 2008Rhondak Stories Behind My Signs Part Ii November 2008
Rhondak Stories Behind My Signs Part Ii November 2008
 
Growing Older with HIV in Scotland
Growing Older with HIV in ScotlandGrowing Older with HIV in Scotland
Growing Older with HIV in Scotland
 
4 mit tudnak
4 mit tudnak4 mit tudnak
4 mit tudnak
 
Legislative Calendar Weekending 052909
Legislative Calendar Weekending 052909Legislative Calendar Weekending 052909
Legislative Calendar Weekending 052909
 
Arkstore web ready2013
Arkstore web ready2013Arkstore web ready2013
Arkstore web ready2013
 

Mais de thisised

Spoon Dispensers Dixie
Spoon Dispensers DixieSpoon Dispensers Dixie
Spoon Dispensers Dixiethisised
 
IBM Supplies
IBM SuppliesIBM Supplies
IBM Suppliesthisised
 
E Commerce
E CommerceE Commerce
E Commercethisised
 
Keep On Imprssing U
Keep On Imprssing UKeep On Imprssing U
Keep On Imprssing Uthisised
 
Purchasing Stranger
Purchasing StrangerPurchasing Stranger
Purchasing Strangerthisised
 
Rewards Card
Rewards CardRewards Card
Rewards Cardthisised
 
Coffee 2011
Coffee 2011Coffee 2011
Coffee 2011thisised
 
Purell Instant Hand Sanitizer
Purell Instant Hand SanitizerPurell Instant Hand Sanitizer
Purell Instant Hand Sanitizerthisised
 
Premier In The News
Premier In The NewsPremier In The News
Premier In The Newsthisised
 
Spr 1928 Coffee Insert.Pdf
Spr 1928 Coffee Insert.PdfSpr 1928 Coffee Insert.Pdf
Spr 1928 Coffee Insert.Pdfthisised
 
Spr 2051 New Year Dec Monthly Flyer.Indd
Spr 2051 New Year Dec Monthly Flyer.InddSpr 2051 New Year Dec Monthly Flyer.Indd
Spr 2051 New Year Dec Monthly Flyer.Inddthisised
 

Mais de thisised (13)

Spoon Dispensers Dixie
Spoon Dispensers DixieSpoon Dispensers Dixie
Spoon Dispensers Dixie
 
IBM Supplies
IBM SuppliesIBM Supplies
IBM Supplies
 
Sympathy
SympathySympathy
Sympathy
 
E Commerce
E CommerceE Commerce
E Commerce
 
Imagine
ImagineImagine
Imagine
 
Keep On Imprssing U
Keep On Imprssing UKeep On Imprssing U
Keep On Imprssing U
 
Purchasing Stranger
Purchasing StrangerPurchasing Stranger
Purchasing Stranger
 
Rewards Card
Rewards CardRewards Card
Rewards Card
 
Coffee 2011
Coffee 2011Coffee 2011
Coffee 2011
 
Purell Instant Hand Sanitizer
Purell Instant Hand SanitizerPurell Instant Hand Sanitizer
Purell Instant Hand Sanitizer
 
Premier In The News
Premier In The NewsPremier In The News
Premier In The News
 
Spr 1928 Coffee Insert.Pdf
Spr 1928 Coffee Insert.PdfSpr 1928 Coffee Insert.Pdf
Spr 1928 Coffee Insert.Pdf
 
Spr 2051 New Year Dec Monthly Flyer.Indd
Spr 2051 New Year Dec Monthly Flyer.InddSpr 2051 New Year Dec Monthly Flyer.Indd
Spr 2051 New Year Dec Monthly Flyer.Indd
 

Utensil Dispensers Dixie

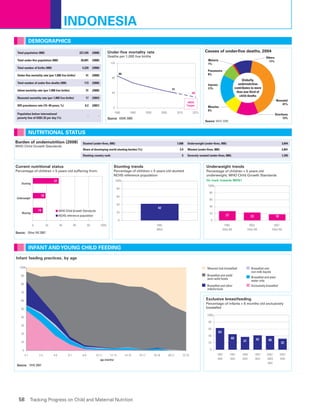
  • 1. INDONESIA Indonesia Indonesia Indonesia DEMOGRAPHICS DEMOGRAPHICS DEMOGRAPHICS DEMOGRAPHICS DEMOGRAPHICS DEMOGRAPHICS Under-five mortality rate Causes of under-five deaths, 2004 Causes of under-five deaths, 2004 Total population (000) Total population (000) 227,345 227,345 (2008) (2008) Deaths per 1,000 live births Under-five mortality rate Under-five mortality rate Causes of under-five deaths, 2004 Causes of under-five deaths, 2004 Others Total population (000) Total population (000) 227,345 227,345 (2008) (2008) Under-five mortality rate Others 11% Causes of under-five deaths, 2004 Malaria of Total under-five population (000) Total under-five population (000) Total population (000) Total population (000) 20,89120,891 227,345 227,345 (2008) (2008) (2008) (2008) Under-five1,000 live births Deaths per mortality rate Deaths per 1,000 live births Causes 1% under-five deaths, 2004 Malaria 11% 120 Deaths per 1,000 live births 1% Others 11% Others 11% Total under-five population (000) Total under-five population (000) 20,891 20,891 (2008) (2008) Deaths per 1,000 live births Total number ofpopulation (000) births (000) Total number of births (000)(000) 4,2204,220 (2008) (2008) 120 120 Malaria 1% Malaria 1% Others 11% Others 11% Total under-five Total under-five population 20,891 20,891 (2008) (2008) Malaria 1% Pneumonia Pneumonia Malaria 1% 120 120 Total number of births (000) Total number of births (000) 4,220 4,220 (2008) (2008) 86 8% 8% Under-five mortality rate (per 1,000 live births) 4,220 41 Under-five mortality rate (per 1,000 live births) Total number of births (000) 41 (2008) (2008) (2008) Pneumonia Pneumonia Neonatal Total number of births (000) 4,220 (2008) 80 Pneumonia Globally, 86 86 Pneumonia 8% 8% Globally, 41% Neonatal Neonatal Under-five mortality rate (per 1,000 live births) Under-five mortality rate (per 1,000 live births) 4141 (2008) (2008) more than Total number ofof under-five 1,000 live births) Under-five mortality rate (per deaths live births) Total number under-five(per 1,000 (000) Under-five mortality rate deaths (000) 173 173 41 41 (2008) (2008) (2008) (2008) 80 86 80 86 Injuries 17% 8% 8% Globally, Globally, undernutrition Neonatal Neonatal 41% 41% 80 Injuries oneGlobally, third of 80 Injuries 17% Injuries 17% more than more than Globally, contributesthanmore 41% Total number of under-five deaths (000) Total number of under-five deaths (000) 173 173 (2008) (2008) 41 17% childmore toare onedeathsof onethird of third 41% Total mortality under-five deathslive births) Infantnumber of under-five 1,000 (000) Total mortality rate (per deaths births) Infantnumber of rate (per 1,000 live (000) 173 31 31 173 (2008) (2008) (2008) Injuries 17% Injuries17% more thanto attributable are (2008) 40 29 thanonedeathsof of one third one third child deaths are child third of Infant mortality rate (per 1,000 live births) Infant mortality rate (per 1,000 live births) 31 31 (2008) (2008) 41 41 undernutrition 41 childdeathsto child deaths attributable are attributable to child deaths are Neonatal mortality rate (per 1,000 live births) Infant mortality rate (per 1,000 1,000 births) Neonatal mortality rate 1,000live births)births) Infant mortality rate (per (per live live 17 17 31 31 (2004) (2004) (2008) (2008) 40 40 41 29 29 40 Measles 9% undernutritionto attributable undernutrition attributable to Neonatal 40 MDG 29 29 Neonatal mortality rate (per 1,000 live births) Neonatal mortality rate (per 1,000 live births) 17 17 (2004) (2004) undernutrition undernutrition 41% HIV prevalence raterate(15–491,000live births) Measles 9% Measles 9% Neonatal mortality (15-49 years, HIV prevalence rate (per 1,000%)live births) Neonatal mortality rate (per years, %) 0.2 0.2 17 17 (2007) (2007) (2004) (2004) Target Measles 9% 0 MDG MDG Measles 9% Measles Diarrhoea HIV prevalence rate (15-49 years, %) HIV prevalence rate (15-49 years, %) 0.2 0.2 (2007) (2007) MDG Target Target MDG 9% HIV/AIDS 0% Population belowrate (15-49 years, %) HIV prevalence international 0.2 (2007) 1990 00 1995 2000 2005 2010 2015 13% Diarrhoea Diarrhoea HIV prevalence rate (15-49 years, %) Population below international 0.2- (2007) - Target Target Diarrhoea poverty linebelow international (%) Population ofof US$1.25 per day US$1.25 per day Population below international (%) - - 00 Diarrhoea Diarrhoea 13% 13% HIV/AIDS 0% HIV/AIDS 0% poverty line 1990 1990 1995 1995 2000 2000 2005 2005 2010 2010 2015 2015 -- -- Source: IGME 2009 Source: WHO 2008 HIV/AIDS 0% 13% poverty linebelow international Population of US$1.25 per day poverty linebelow international (%) Population of US$1.25 per day (%) - - -- 1990 1990 1995 1995 2000 2000 2005 2005 2010 2010 2015 2015 13% 13% Source: WHO 2008 HIV/AIDS 0% povertyline of US$1.25 per day (%) poverty line of US$1.25 per day (%) Source: IGME 2009 Source: IGME 2009 Source: WHO 2008 Source: WHO 2008 Source: IGME 2009 Source: IGME 2009 Source: WHO 2008 Source: WHO 2008 NUTRITIONAL STATUS NUTRITIONAL STATUS NUTRITIONAL STATUS NUTRITIONAL STATUS Burden of undernutritionSTATUS NUTRITIONAL (2008) NUTRITIONAL STATUS Stunted (under-fives, 000): 7,688  Underweight (under-fives, 000): 3,844  Burden of undernutrition (2008) WHO Child Growth Standards (2008) Stunted (under-fives, 000): 7,688 Underweight (under-fives, 000): 3,844 Burden of undernutrition (2008) Burden of undernutrition WHO Child Growth Standards Share of(under-fives,world stunting burden (%): Stunted developing 000): Stunted (under-fives, 000): 7,688  Wasted (under-fives, 000): 000): 7,688  Underweight (under-fives, 000): 3.9  Underweight (under-fives, 3,844  3,844  2,841  Burden of Growth Standards (2008) Burden of undernutrition WHO Child Growth Standards (2008) WHO Child undernutrition Share of developing worldcountry rank: 000):stuntingburden (%): Stunted (under-fives,000): Stunted stunting Share of (under-fives, world (%): 7,688  Wasted (under-fives, 000): 000): 7,688  Underweight 000): Underweight (under-fives, Wasted (under-fives, (under-fives, 000): 3,844  3,844  WHO Child Growth Standards WHO Child Growth Standards Stunting developingburdenstunting burden (%): Share of developingworld 3.9 3.9  Severely (under-fives, 000): 000): 3.9  Wasted wasted (under-fives, 5  2,841 2,841  2,841  1,295  Share of developing world stunting burden (%): Share of developing world stunting burden (%): 3.9  Wasted (under-fives, 000): 3.9  Wasted (under-fives, 000): 2,841  2,841  Stunting country rank: Stunting country rank: Stunting country rank: 5 SeverelySeverely wasted (under-fives, 000): wasted (under-fives, 000): 000): 5  Severely wasted (under-fives, 5  1,295 1,295  1,295  Stunting country rank: Stunting country rank: 5  Severely wasted (under-fives, 000): 5  Severely wasted (under-fives, 000): 1,295  1,295  Current nutritional status Stunting trends Underweight trends Percentage of children status old suffering from: Current nutritional < 5 years Current nutritional status Percentagetrends Stunting trends Stunting of children < 5 years old stunted Underweight trends Underweight trends Percentage of children < 5 years old Percentage of children status Current nutritional < 5 years Percentage of children status old suffering from: Current nutritional < 5 years old suffering from: Percentage trends Stunting of children < 5 Percentagetrends Stunting of children < 5 years old stunted NCHS reference populationyearsold stunted Underweight trends Underweightchildren < Growth Standards Percentage of trends underweight, WHO Child5 years old Percentage of children < 5 years old Percentage of children < 55years old suffering from: Percentage of children < years old suffering from: 37 NCHS reference population yearsold stunted Percentage of children < 55years old stunted Percentage of children < NCHS reference population 100% On track towards MDG1 < 5Growthold Percentage of WHO Child 5years Standards underweight, children < years Standards Percentage of children underweight, WHO Child Growthold Stunting NCHS reference population NCHS reference population underweight, WHO Child Growth Standards underweight, WHO Child Growth Standards 37 37 100% 100% On track towards MDG1 On % 100 track towards MDG1 Stunting Stunting 37 37 80 100% 100% On track towards MDG1 On track towards MDG1 Stunting Stunting 100% 100% 80 80 80 100% 18 100% 60 80 80 80 80 Underweight 60 18 18 60 60 80 80 Underweight Underweight 18 18 40 60 60 60 Underweight 60 40 Underweight 42 60 60 14 WHO Child Growth Standards 40 40 Wasting 20 40 40 42 42 40 40 2040 14 14 NCHSChild Growth Standards WHO reference population WHO Child Growth Standards 42 42 40 27 23 18 Wasting Wasting 14 WHO Child Growth Standards 20 20 20 20 14 NCHSChild Growth Standards WHO reference population NCHS reference population 0 20 0 27 27 Wasting Wasting 20 20 20 23 23 18 18 NCHS reference population NCHS reference population 27 27 23 23 18 18 0 20 40 60 80 100% 00 1995 00 1995 2003 2007 00 20 20 40 40 60 60 80 80 100% 100% 00 MICS 1995 1995 00 Other NS 1995 1995 Other NS 2003 2003 Other NS 2007 2007 Source: Other NS 200720 00 20 40 40 60 60 80 80 100% 100% 1995 1995 1995 1995 2003 2003 2007 2007 MICS MICS Other NS Other NS Other NS Other NS Other NS Other NS Source: Other NS 2007 Source: Other NS 2007 MICS MICS Other NS Other NS Other NS Other NS Other NS Other NS Source: Other NS 2007 Source: Other NS 2007 INFANT AND YOUNG CHILD FEEDING INFANT AND YOUNG CHILD FEEDING INFANT AND YOUNG CHILD FEEDING INFANT AND YOUNG CHILD FEEDING INFANT AND YOUNG CHILD FEEDING Infant feeding practices,YOUNG CHILD FEEDING INFANT AND by age Infant feeding practices, by age Infant feeding practices, by age Infant feeding practices, by age Infant feeding practices, by age 100% Weaned (not breastfed) Breastfed and 100% 100% non-milk liquids Weaned (not breastfed) Weaned (not breastfed) Breastfed and Breastfed and 100% 90 100% Breastfed (not breastfed) Weaned and solid/ Breastfed and Weaned (not breastfed) semi-solid foods Breastfedliquids non-milk liquids non-milk and plain 90 90 Breastfed and solid/ Breastfed and solid/ water onlyliquids non-milk non-milk liquids Breastfed and solid/ semi-solid and solid/ Breastfed and plain Breastfed and plain 90 80 90 Breastfed foods semi-solid foods Breastfed and other semi-solid foods Exclusively andplain water onlyand plain Breastfed water only Breastfed breastfed semi-solid foods water only 80 80 milk/formula water only breastfed 80 Breastfed and other Breastfed and other Exclusively breastfed Exclusively 70 80 Breastfed and other Breastfed and milk/formula other milk/formula Exclusively breastfed Exclusively breastfed 70 70 milk/formula milk/formula 70 60 Exclusive breastfeeding 70 60 60 Exclusive breastfeeding Exclusive breastfeeding Percentage of infants < 6 months old exclusively 60 50 60 Percentage breastfeeding Exclusive Percentage breastfeeding Exclusive of infants < 6 months old exclusively breastfed of infants < 6 months old exclusively breastfed of infants < 66months old exclusively Percentage of infants < months old exclusively Percentage breastfed 50 50 100% breastfed 50 40 breastfed 50 100% 100% 40 40 80 100% 100% 40 30 40 80 80 6080 30 30 80 63 30 20 30 60 60 4060 63 63 60 45 20 20 40 40 63 63 37 42 40 20 10 20 2040 45 45 32 40 37 37 42 42 40 40 10 10 20 20 45 45 42 42 32 32 0 37 37 40 40 10 0 10 20 20 32 32 000-1 2-3 4-5 6-7 8-9 10-11 12-13 14-15 16-17 18-19 20-21 22-23 00 1987 1991 1994 1997 2002- 2007 000-1 00 1987 DHS 1987 DHS 1991 1991 DHS 1994 1994 DHS 1997 1997 2003 2002- 2002- DHS 2007 2007 0-1 2-3 2-3 4-5 4-5 6-7 6-7 8-9 8-9 10-11 (months) age 10-11 12-13 12-13 14-15 14-15 16-17 16-17 18-19 18-19 20-21 20-21 22-23 22-23 0-1 2-3 4-5 6-7 8-9 10-11 (months) 12-13 14-15 16-17 18-19 20-21 22-23 1987 1987 DHS DHS 1991 1991 DHS DHS 1994 1994 DHS DHS 1997 1997 DHS DHS 2002- 2002- DHS 2003 2003 2007 2007 DHS DHS 0-1 2-3 Source: DHS 2007 4-5 6-7 8-9 10-11 (months) age age 12-13 14-15 16-17 18-19 20-21 22-23 age (months) DHS DHS DHS DHS DHS DHS DHS DHS 2003 2003 DHS DHS DHS DHS age (months) Source: DHS 2007 Source: DHS 2007 DHS DHS Source: DHS 2007 Source: DHS 2007 The Nutrition of Women and Children The Nutrition of Women and Children The Nutrition of Women and Children The Nutrition of Women and Children The Nutrition of Women and Children 58 Tracking Progress on Child and Maternal Nutrition